Legislative Analyst's Office, December 2000
California's Economy and
Budget in Perspective |
2000 Cal Facts
Program Trends
Part 5
|
Traffic Delay Increases as Driving Outpaces Highway Capacity
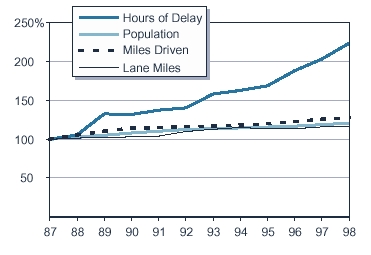
- Between 1987 and 1998, the number of miles driven on state highways in California grew faster than the state's population. Specifically, vehicle miles driven
grew by approximately 28 percent, while population grew by about 21 percent.
- During the same time frame, the number of lane miles added to urban freeways grew by an estimated 16 percent.
- Due to this imbalance between demand for driving and supply of freeway capacity, the number of hours that Californians spent delayed in traffic on the
state highway system more than doubled over the last decade.
Local Funds Account for
Half of Transportation Revenues
1999-00
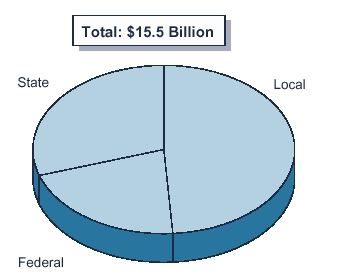
- State funds consist primarily of the state per gallon tax on gasoline, diesel fuels, and truck weight fees. From 2000-01 through 2005-06, the Traffic
Congestion Relief Program provides an additional $6.9 billion from the General Fund and gasoline sales tax revenues.
- Federal transportation funds are apportioned to California based on the state's contribution to federal fuel taxes.
- Over one-third of local funds for transportation are from optional local sales taxes, dedicated for transportation purposes. Other local funds include local
general funds, transit fares, and the 25-cent uniform sales tax dedicated to transit purposes.
Most State and Federal Transportation Revenues Come From Fuel Taxes
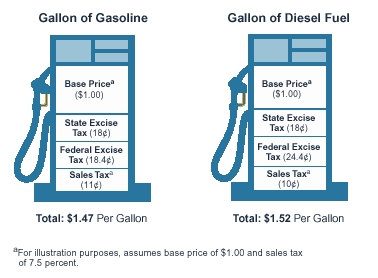
- State and federal transportation revenues are collected primarily from per gallon taxes on gasoline and diesel fuel.
- Californians pay the following taxes at the pump:
18 cents in state "gas" tax for each gallon of gasoline and diesel fuel.
18.4 cents in federal tax for each gallon of gasoline and 24.4 cents for each gallon of diesel fuel.
- 7 percent minimum state and local sales tax (as of January 1, 2001), plus optional local sales taxes for transportation or other purposes varying by county.
The majority of the state and local sales tax proceeds are not used for transportation purposes.
How Californians Commute Varies Little From National Average
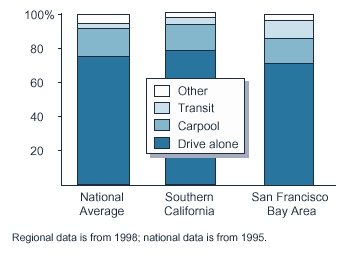
- In Southern California, 78 percent of commuters drove alone to work in 1998, while in the San Francisco Bay Area 71 percent of commuters drove alone to
work. This is relative to the national drive alone rate of 75 percent for 1995, the most recent year for which national data are available.
- In the San Francisco Bay Area, 11 percent of commuters used transit to get to work in 1998, while only 4 percent used transit for commuting in Southern
California. Nationwide, 3 percent of commuters rely on transit as their primary mode of transportation.
- Carpooling is somewhat more common in Southern California where 15.5 percent of commuters shared a ride to work compared to the San Francisco Bay
Area where 14.3 percent carpooled.
Rail Transit Passengers Grow While Bus Ridership Remains Unchanged
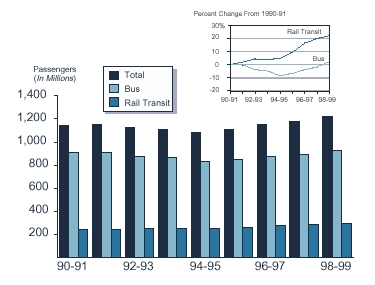
- Between 1990-91 and 1998-99, total ridership on public transportation has grown about 6 percent. The majority of the ridership growth, however, has been
on urban and commuter rail due in part to new systems that came on line.
- Over the nine-year period, ridership on commuter and urban rail systems grew by approximately 22 percent from 1990-91 levels. Ridership on bus systems
grew by about 2 percent from 1990-91 levels, but it was not until 1998-99 that bus ridership exceeded the 1990-91 total.
Are Californians Really in Love
With Their Cars?
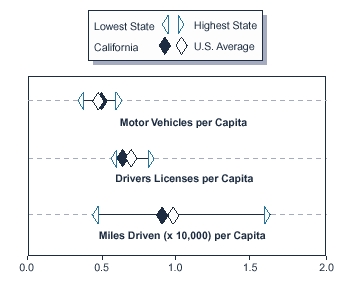
- While the conventional wisdom is that Californians are infatuated with their automobiles, some data suggest that this is not the case.
- For instance, when compared to the average American, Californians own the same number of vehicles per person, drive fewer miles per capita and are less
likely to have a driver's license.
- However, because the state's transportation infrastructure has not kept pace with the growth in population and growth in vehicle miles traveled, Californians
are above the national average in terms of how intensively they use existing roads (miles driven per lane mile and proportion of major urban highways that
are congested).
Voter Action Since 1986 on
State General Obligation Bonds
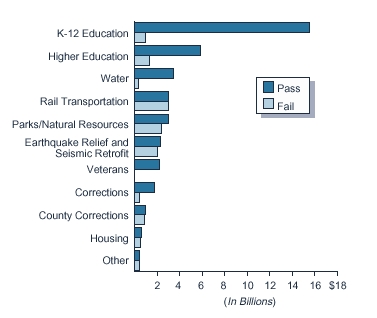
- Voters have approved $39 billion in bonds since 1986 and rejected $12 billion.
- About 40 percent of all approved bonds ($15.5 billion) have been for K-12 school facilities.
- In addition to voter-approved general obligation bonds, the Legislature has authorized nearly $9 billion in lease-payment bonds since 1986 for higher
education facilities, prisons, and state office buildings.
Share of General Fund Revenue Needed for Bond Payments
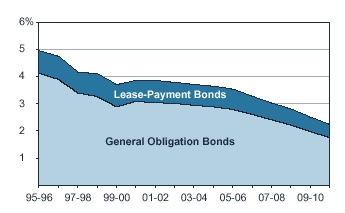
- The state's debt service ratio reflects the estimated costs to pay principal and interest on currently authorized state bonds as a percentage of projected state
General Fund revenues.
- After reaching about 5�percent in the mid-1990s, the debt ratio declined to 3.7�percent in 1999-00, will increase to 3.9�percent in 200102, and decline
thereafter. Authorization and sales of new bonds would increase these debt ratios.
- Debt payments will increase from $2.9�billion in 2000-01 to $3.5�billion in 200506 and decline thereafter if no additional bonds are approved.
Trends in State Capital Outlay
Spending Over Time
1966-67 Through 2000-01
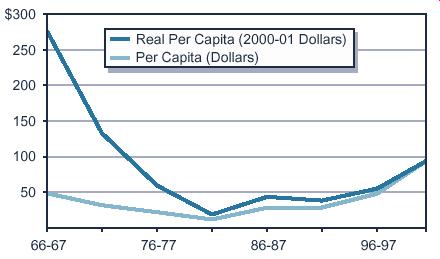
- Real per capita spending on infrastructure declined rapidly in California between 1966-67 and 1981-82. This decline reflected a reduction in spending on
major programs such as transportation and higher education.
- Per capita spending has increased moderately, but steadily, since the early 1980s, with the increase in 2000-01 spending due largely to added funds for
transportation and resources.
- The state will spend about $93 per Californian on state infrastructure in 2000-01. In real terms this is about one-third the spending level of the mid-1960s.
Return to 2000 Cal Facts Table of Contents
Return to LAO Home Page


