
 |
California's Fiscal OutlookLAO Projections2000-01 Through 2005-06 |
Economic and demographic developments in California have important effects on the state's fiscal condition, as they have impacts on both tax receipts and state expenditures. This chapter presents our economic and demographic projections for 2000 through 2006, which will affect California's fiscal condition during fiscal years 2000-01 through 2005-06.
Our forecast calls for continued healthy--though somewhat moderating--national- and state-level economic growth. This reflects such factors as: increases in technologically driven investments; large productivity gains; and high levels of wealth, consumer and business confidence, and income. Clearly, there are risks to the outlook, including further potential declines in the stock market, accelerating tensions in the Middle East, and the adverse effects of higher energy prices on overall inflation. However, none of these factors presently appears to be of sufficient magnitude to derail the current expansion. Our updated U.S. and California economic outlooks are summarized in Figure�1 (see page 8).
| Figure 1 | |||||||
| The LAO's Economic Forecast
2000 Through 2006 | |||||||
| Percent Change (Unless Otherwise Indicated) | |||||||
| 2000 | 2001 | 2002 | 2003 | 2004 | 2005 | 2006 | |
| United States | |||||||
| Real gross domestic product | 5.1% | 3.2% | 4.1% | 4.5% | 3.5% | 3.3% | 3.6% |
| Wage and salary jobs | 2.2 | 1.5 | 1.3 | 1.8 | 1.6 | 1.4 | 1.3 |
| Consumer Price Index (CPI) | 3.4 | 2.7 | 2.4 | 2.5 | 2.8 | 3.1 | 3.2 |
| Unemployment rate (%) | 4.0 | 4.3 | 4.4 | 4.3 | 4.3 | 4.3 | 4.2 |
| Housing starts (000) | 1,631 | 1,601 | 1,666 | 1,750 | 1,746 | 1,739 | 1,707 |
| California | |||||||
| Personal income | 11.5% | 6.6% | 6.5% | 6.8% | 6.8% | 6.8% | 6.7% |
| Wage and salary jobs | 3.6 | 2.6 | 2.4 | 2.3 | 2.3 | 2.2 | 2.1 |
| Taxable sales | 11.7 | 6.7 | 6.0 | 6.2 | 6.4 | 6.6 | 6.5 |
| Consumer Price Index (CCPI) | 3.7 | 3.4 | 2.9 | 3.0 | 3.2 | 3.3 | 3.5 |
| Unemployment rate (%) | 4.9 | 4.7 | 4.5 | 4.5 | 4.6 | 4.7 | 4.6 |
| New housing permits (000) | 145 | 150 | 158 | 165 | 165 | 170 | 165 |
U.S. Economy. The national economy once again is outperforming expectations in 2000. Real gross domestic product (GDP) is on track to increase by over 5�percent during the current year--a dramatic gain given that the economy is in its tenth year of expansion and is operating at full employment. The recent third-quarter report on GDP indicates that the economy is finally starting to slow some, and this is confirmed by recent monthly reports on retail sales and employment trends. This slowdown is being interpreted as a sign that the previous monetary tightening undertaken by the Federal Reserve is having the desired effect of moderating economic growth to a sustainable, noninflationary pace.
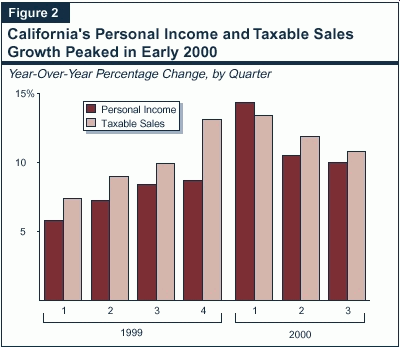
California Economy. California has been experiencing booming economic conditions in 2000. Employment in the state is up by over 3.5�percent this year, while personal income and taxable sales are up by over 11�percent. As with the nation, the state's peak growth rates appear to have occurred in the first half of the year (see Figure�2 page 8). However, monthly indicators such as state withholding and sales tax receipts suggest that California's expansion remains robust.
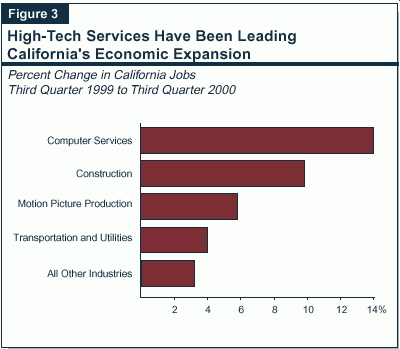
The state's expansion continues to be broad based, with large employment increases occurring in construction, professional services, transportation, tourism, and motion picture production. The fastest growing sector is computer-related services, which includes businesses involved in networking design and software development for the Internet and other integrated systems (see Figure 3). Overall, employment related to computer-related services is up 14�percent over the past year--despite the widely publicized shakeout among "dot-com" enterprises (that is, companies that sell products and services over the Internet).
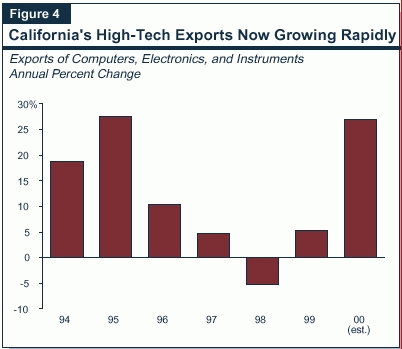
An especially positive factor in California's near-term outlook is the resumption of growth in high-tech exports to overseas markets. Primarily reflecting improved conditions in Asia, exports of computers, electronics, and instruments produced in California are up by 27�percent in 2000 (see Figure�4).
Near-Term Forecast (2000 Through 2002). Our forecast assumes that the current modest slowing in national economic growth will persist through mid-2001, as output is scaled back to bring production in line with the current moderation in sales. Following this minor inventory correction, we assume that economic growth will continue at a healthy rate during the balance of the near-term forecast period, with real GDP growth averaging 3.7�percent annually during 2001 and 2002. Although energy prices are expected to remain relatively high, continued strong worker productivity gains and somewhat slower economic growth should hold inflation in check during the next two years. The U.S. Consumer Price Index (CPI) is predicted to average about 2.6�percent during the same period.
Longer-Term Forecast (2003 Through 2006). Our long-term forecast assumes that sustained economic growth will continue through the forecast period, with real GDP expanding at a trend rate of 3.7�percent per year. The outlook for these years is tied to our assumptions of continued healthy worker productivity growth and high rates of technology-driven investment spending. We also assume that annual inflation, as measured by the CPI, will remain in the range of 2.5�percent to 3�percent during the forecast period.
Near-Term Forecast (2000 Through 2002). We expect economic growth in California to subside from its current dramatic pace, yet still remain stronger than the nation during the near-term forecast period. As shown in Figure�5, we project that personal income growth will subside from 11.5�percent this year to 6.6�percent in 2001, and further to 6.5�percent in 2002. During the same period, we expect a similar moderation in taxable sales growth.
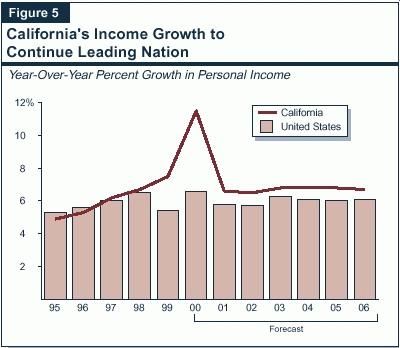
The marked expected slowdowns in personal income and taxable sales do not portend an underlying weakness in California's economy, however. Rather, they reflect the absence of special factors that contributed to this year's dramatic increases in these two measures. Specifically, personal income in 2000 was boosted by an extraordinary increase in stock options exercised during the year. Similarly, taxable sales have been boosted both by these income gains and by increased expenditures on gasoline, the latter attributable to higher oil prices.
Longer-Term Forecast (2003 Through 2006). Our longer-term forecast assumes that California's economy will continue to expand at a healthy pace through 2006, and that employment and income will again outpace the nation. Supporting this positive long-term outlook is California's dominant position in key "new economy" industries, including the production of computers, electronics, communications equipment, and software.
The main threats to the positive current national economic outlook stem from rising energy prices and potential further stock market volatility.
Energy Prices. Over the past year, major worldwide increases in crude oil and natural gas prices have led to corresponding increases in energy costs and higher prices for a variety of energy-related products. So far these increases have not materially "spilled over" into the prices for other goods and services in the U.S. economy--largely because significant worker productivity gains and stiff import competition have held most prices in check. However, if energy-related price increases were to lead to higher prices in other areas, the resulting acceleration of inflation would likely result in tighter monetary policies, higher interest rates, and a sharper slowdown in economic activity than assumed in our forecast.
Stock Market Volatility. As of late October, all major stock market indexes were down for the year, with the NASDAQ off by nearly 40�percent from its March 2000 peak. These lower market valuations have not had a material effect on overall economic activity so far. However, given the still-lofty values of many stocks relative to their current and expected earnings, many market analysts believe that the market remains extremely vulnerable to any bad news regarding such factors as higher inflation, rising interest rates, and profit slowdowns. Further stock market declines could exacerbate the effects of any negative economic developments through their impacts on wealth, confidence, and spending.
In addition to the above concerns, California faces numerous pressures related to its extraordinary growth in recent years. These growth pressures are evidenced in sharply rising home prices and rents, higher energy costs, and intense debates over proposed development projects. While growth-related strains have not yet proven to be a barrier to the state's economic expansion, they clearly will pose major challenges to policymakers in the years ahead.
California's population currently totals about 35�million, having increased by nearly five million during the 1990s. As Figure�6 indicates, we project that moderate population growth will continue over the next six years, with another three million people being added and the state's total reaching 38�million by 2006.
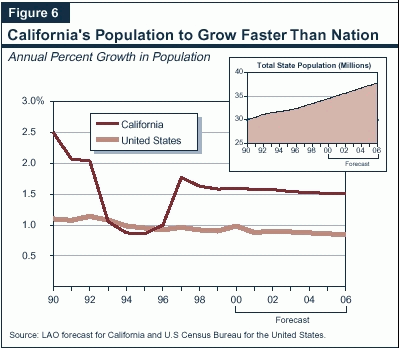
State to Outdistance Nation. Although we expect the state's population growth rate to slow somewhat during the next several years, it still will remain nearly twice what the U.S. Census Bureau projects for the nation as a whole.
California's population growth can be broken down into two major components--natural increase (the excess of births over deaths) and net in-migration (persons moving into California from other states and countries, minus people leaving the state for other destinations).
Natural Increase. The natural-increase component is projected to account for slightly over half of the state's total population growth, averaging about 280,000 persons annually. This amount is similar to recent years but significantly less than for the early 1990s, when the natural increase averaged nearly 400,000. The decline largely reflects the aging of the baby boomers past their years of peak fertility, as well as reduced birth rates within younger age groups--especially the 15-to-19 age range.
Net In-Migration. We project that net in-migration will be averaging about 270,000 annually during the forecast period, or slightly less than the natural-increase component. Nearly 90�percent of this net in-migration can be attributed to net foreign in-migration, which has remained fairly steady over the past decade and should continue to be so through 2006.
In contrast, net domestic in-migration has fluctuated widely over the past decade. During the late 1980s and into the early 1990s, net domestic in-migration remained high--over 100,000 people annually. However, California's recession in the early 1990s reversed this trend and negative net in-migration emerged, as more people left California for other states than came in. California's current booming economy has stimulated a return to positive net domestic in-migration, but the amount is projected to remain relatively modest over the next six years. This is due to such factors as the rising costs of housing in California and the improved health of economies in other states.
Figure�7 shows our population growth projections by broad age categories, both in numerical and percentage terms. In numerical terms, the 45-to-64 age group (baby boomers) easily dominates. In percentage terms, the 45-to-64 age group also is growing the fastest, followed by the 18-to-24 age group.
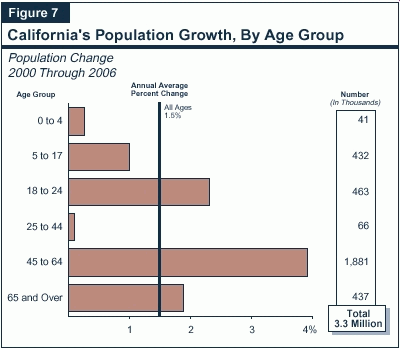
These various age-group demographic projections can have significant implications for the state's revenue and expenditure outlook. For example, strong growth of the 45-to-64 age group can result in higher tax revenues since this is the age category that routinely earns the highest wages and salaries. Likewise, above-average growth in the young adult population should stimulate college enrollments, while the slow growth in the 0-to-4 age group is an indication that K-12 enrollments will be slowing.