

Economic and demographic developments in California have important effects on the state's fiscal condition through their impacts on both tax receipts and state expenditures. This chapter presents our economic and demographic projections for 2001 through 2007, which will affect California's fiscal condition during fiscal years 2001-02 through 2006-07.
After nearly eight years of economic
expansion, California—along with the rest of the
nation—entered a recession in the second half of 2001. At
this time, we are projecting that the downturn will
be relatively modest in terms of employment losses—especially when compared to the prolonged
downturn of the early 1990s. However, the recession
will have a more pronounced adverse effect on
personal income and state revenues than on
employment, largely due to the impacts of recent stock
market declines on stock options and capital gains.
There also is considerable uncertainty surrounding the current outlook. This relates to such
factors as (1) the ongoing effects of the recent terrorist
attacks, (2) the dramatic decline this year in
stock market wealth, and (3) the uncertain timing of
any improvement in U.S. investment spending,
particularly on high-tech goods and services. These
factors could, individually or collectively, deepen and
prolong the recession.
Before September 11. Even before September 11, the U.S. economy was teetering on the brink of
recession. Business spending had been soft all year,
and consumer spending also was moderating. While
the consensus outlook in early September was that
the U.S. economy would narrowly avoid a full-blown recession, most projections put the risk of a
downturn at nearly 50 percent. Recent reports on the
condition of the U.S. economy immediately before
September 11 suggest the economy may have already been in decline.
After September 11. The terrorist attacks
pushed the U.S. economy "over the edge" into recession
by accelerating the slowdown noted above. Consumer and business spending collapsed in the weeks
immediately following September 11, and while
there are positive signs that consumer spending has
subsequently experienced a partial rebound, most
indicators of business confidence and spending
remain extremely weak. New orders for
manufacturing goods dropped 8.5 percent to a five-year low in
September, as businesses cancelled or postponed
commitments for aircraft, telecommunications equipment, computers, and other equipment. Layoffs
were announced by firms throughout the economy,
with particularly large job cuts instituted by
companies in the airline, travel, and aircraft manufacturing
sectors. Between September and October, the U.S. economy lost 415,000 jobs and the
unemployment rate jumped from 4.9 percent to 5.4 percent.
In response to the economy's weakness, the Federal Reserve moved aggressively to lower
interest rates, and the President and Congress are
considering tax and spending measures aimed at
stimulating future economic growth. The timing of any
economic rebound, however, remains uncertain.
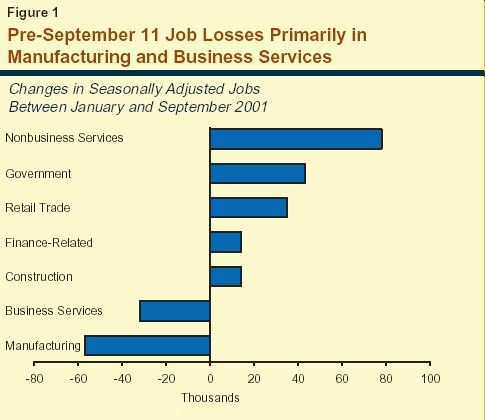
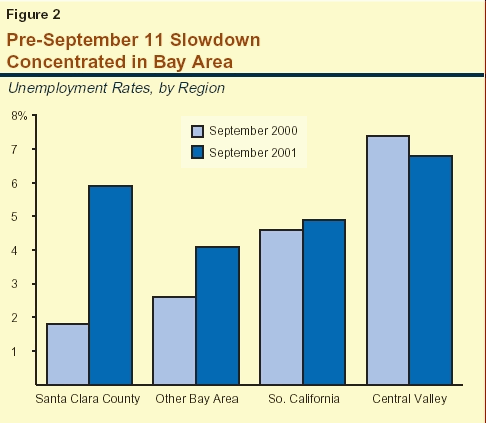
Before September 11. California's situation prior to September 11 was similar to the rest of the nation. While the state's economy held up well early in the year, private sector employment has been declining in recent months. Prior to September 11, however, the weakness was mainly concentrated in high-tech industries. For example:
The adverse effects of the state's economic slowdown on sales and income in the pre-September period were more pronounced than for unemployment, with both taxable sales and personal income slipping from their large increases in 2000 to near-zero growth in the first half of 2001. A key factor behind the slowdown in both of these measures was the dramatic decline in stock options-related earnings, which has significantly reduced wealth, income, and spending in the state's economy.
After September 11. As with the nation, the
economic slowdown in California appears to have broadened and deepened in the weeks following
the September 11 attacks. A recent survey by the
San Francisco Federal Reserve of economic
conditions in the western states indicates that all sectors in
the region slowed sharply immediately after
September 11, with the most severe declines
reported in the travel-related industries. While some
survey respondents reported that business activity
subsequently rebounded, many others indicated that
sales remained soft. Other signs of continuing
economic weakness include softness in withholding
payments, industry reports of extremely low hotel
occupancy rates, drops in help wanted advertising, and
sharp increases in new claims for unemployment.
Near-Term Forecast (2001 Through 2003). Our forecast, which is consistent with the consensus of most public and private economists as of late October, is that the U.S. economy will remain in recession through early 2002, but that a rebound will emerge beginning next spring. The main assumptions behind this forecast are that (1) the chilling effects of the September 11 attacks on consumer and business activity will slowly subside, (2) the stimulative effects of federal monetary and fiscal policies will bolster income and spending next year, and (3) businesses will step up spending in 2002 in the information technology (IT) area. As shown in Figure 3 (see page 10), we project that growth in real gross domestic product (GDP) will accelerate from a marginal 0.8 percent next year (reflecting sluggish conditions in the first half and improvement in the second half) to 4 percent in 2003. The unemployment rate, which stood at 5.4 percent in October, is expected to peak at about 6.5 percent in mid-2002, before dropping back to 5.3 percent by the end of 2003. Inflation is expected to subside over the next two years, reflecting the economy's current large amount of unused productive capacity, lessening wage pressures, and stable oil prices.
|
Figure 3 The LAO’s Economic
Forecast |
|||||||
|
Percent Change (Unless Otherwise Indicated) |
|||||||
|
|
2001 |
2002 |
2003 |
2004 |
2005 |
2006 |
2007 |
|
United States |
|
|
|
|
|
|
|
|
Real gross domestic product |
1.0% |
0.8% |
4.0% |
3.1% |
2.8% |
2.8% |
2.8% |
|
Wage and salary jobs |
0.5 |
0.1 |
1.5 |
1.6 |
1.6 |
1.4 |
1.4 |
|
Consumer Price Index |
3.1 |
2.0 |
2.4 |
2.6 |
2.7 |
2.8 |
2.9 |
|
Unemployment rate (%) |
4.7 |
5.9 |
5.4 |
5.1 |
5.0 |
5.0 |
5.0 |
|
Housing starts (000) |
1,570 |
1,480 |
1,520 |
1,550 |
1,590 |
1,580 |
1,570 |
|
California |
|
|
|
|
|
|
|
|
Personal income |
1.7% |
4.2% |
7.8% |
6.8% |
6.5% |
6.4% |
6.4% |
|
Wage and salary jobs |
1.8 |
0.4 |
2.4 |
2.8 |
2.5 |
2.4 |
2.3 |
|
Taxable sales |
-2.0 |
3.9 |
7.9 |
6.8 |
6.3 |
6.4 |
6.2 |
|
Consumer Price Index |
4.3 |
2.6 |
2.3 |
2.8 |
3.0 |
3.0 |
3.1 |
|
Unemployment rate (%) |
5.4 |
6.7 |
6.0 |
5.6 |
5.3 |
5.1 |
5.1 |
|
New housing permits (000) |
140 |
135 |
158 |
160 |
165 |
165 |
170 |
Longer-Term Forecast (2004 Through 2007). Our longer-term forecast assumes that real GDP will increase at a trend rate of just under 3 percent per year through the end of the forecast period. This average annual growth rate is about three-quarters of what our longer-term outlook assumed last November, reflecting recent downward revisions to productivity gains in the late 1990s. These revisions have in turn caused many economists to reassess downward the prospects for growth in potential output in future years. We also assume that inflation will remain subdued, with the Consumer Price Index increasing at an average annual rate of 2.7 percent in the latter four years of our forecast.
Near-Term Forecast
(2001 Through 2003). We expect that the economic downturn in
California will continue through early 2002, consistent with the
national economy's performance. Factors contributing to the slide
include ongoing weakness in high-tech spending, the adverse effects of
the September 11 attacks on the state's travel and
tourism-related industries, and the negative impact
of recent stock market declines on wealth, income,
and spending in the state.
Although both employment and income will experience declines, Figure 4 shows that income
will be the hardest hit:
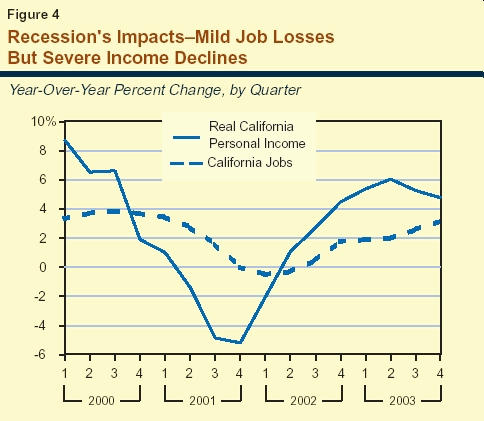
On a more positive note, we expect the job and income declines to be relatively brief, especially when compared to the early 1990s, when restructurings in the defense, banking, and telecommunications industries prolonged California's recession. We forecast that employment and income in California will rebound when the national upturn ensues during the spring of 2002. We project that personal income growth will accelerate from 1.7 percent in 2001, to 4.2 percent in 2002 as the recovery takes hold, and further to 7.8 percent in 2003.
Longer-Term Outlook (2004 to 2007). Our longer-term forecast assumes that after rebounding in 2002 and 2003, the California economy will expand at more moderate—but still healthy—rates in the subsequent three years. We expect that growth in jobs and income will outpace the nation during those years, reflecting California's favorable mix of fast-growing industries and above-average rate of population increases.
There always are a variety of uncertainties associated with making economic forecasts, including what future inflation will be, the likely course of interest rates, and how foreign economies will perform. However, the current forecast faces additional uncertainties that go well beyond those normally encountered. These are in three major areas:
The results of the 2000 Census indicate that California's population totaled around 34 million as the new millennium began. The state's population is projected to grow at an average rate of about 1.5 percent annually over the next six years. This growth is slightly slower than that experienced in the latter part of the 1990s, reflecting both the dampening effects of a slowing economy on net in-migration, as well as a continued decline in birth rates.
California's population growth can be
broken down into two major components—natural
increase (the excess of births over deaths) and
net in-migration (persons moving into California from
other states and countries, minus people leaving the
state for other destinations). As indicated by Figure 5,
the population growth associated with natural increase accounts
for roughly one-half of California's projected annual growth over
the forecast period, and is assumed to be fairly stable. Net
in-migration accounts for the other half of the growth over the period, but
varies with California's economic cycle.
Natural Increase. We project that the natural-increase
component will contribute around 270,000 new Californians
annually over the forecast period. This amount is slightly less than in
the late 1990s due to the ongoing decline of birth rates being
experienced by all ethnic groups. Despite declining birth rates, the
natural-increase component grows slightly due to significant growth in the female
population of child-bearing age groups in faster-growing
segments of the population, including Hispanic and Asian women.
Net In-Migration. We project that net
in-migration will average roughly 285,000 annually over
the next six years, which is just slightly more than
the natural-increase component. As indicated by
Figure 5, the population growth associated with net
in-migration is projected to decline in the near
term due to the slowing of the California economy.
However, a modest rebound is forecast in 2004
reflecting the state's projected economic recovery.
Nearly 85 percent of the net in-migration is
associated with foreign in-migration. Foreign
in-migration has remained relatively steady over the
past decade and we expect similar levels in the near
future, although some decline should result from
the economic slowdown.
Regarding net domestic in-migration, this
has historically fluctuated with California's
economy. For example, California's early 1990s' recession
resulted in negative net domestic in-migration, as more people were leaving the state than were
moving in from other states. Similarly, we project
that the current slowdown of the state's economy
again will result in a decline in net domestic
in-migration, especially in the very near term. However,
domestic migration should rebound somewhat in response to the
economy's recovery, before tapering off to its projected long-term level.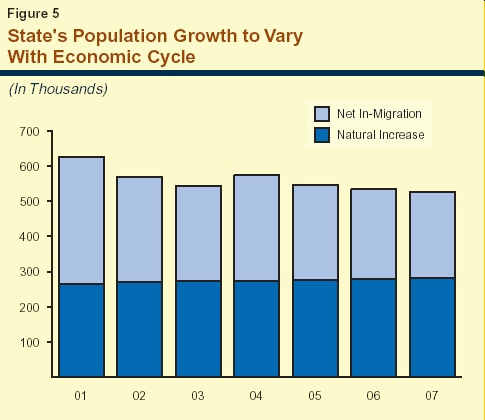
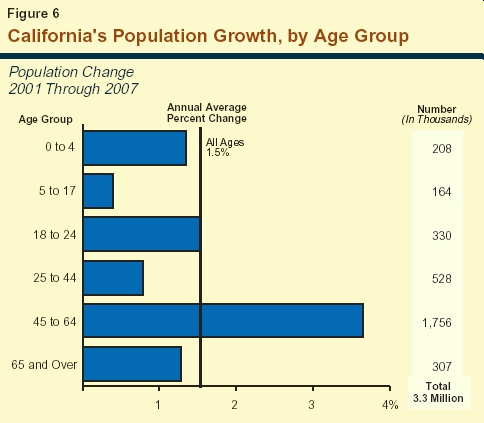
Figure 6 shows our
population growth projections by broad age categories, including both
numerical and percentage growth. The 45-to-64 age group (baby
boomers) continues to be the fastest growing segment of the population.
Nearly 1.8 million new people are expected to move into this age
category over the next six years.
These various age-group demographic projections can
have significant implications for the state's revenue and expenditure outlook. For
example, strong growth of the 45 to 64 age group
generally benefits tax revenues since this is the age
category that routinely earns the highest wages and
salaries. Likewise, the growth in the young adult
population affects college enrollments, while that for the
0-to-4 and 5-to-17 age groups drives K-12 enrollment growth over the forecast period.
Return to California's Fiscal Outlook Table of Contents