

In this chapter, we discuss our General Fund expenditure projections for 2001-02 through 2006-07. We first look at general budget trends during the forecast period. We then discuss in more detail our expenditure projections for each of the major program areas.
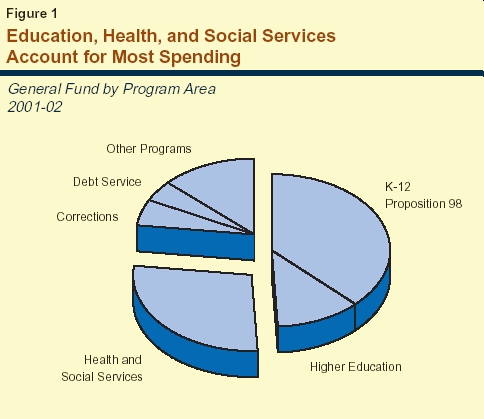
Figure 1 shows how
General Fund spending is distributed among major programs in
2001-02. Education programs dominate state spending,
accounting for just less than half of General Fund spending. Of this
total, 37 percent is for K-12 Proposition 98 funding and 11 percent is
for higher education (including community colleges' Proposition
98 funding). Just over one-fourth of the budget is for health and
social services and about 6 percent is for corrections. The remainder is for state
operations, debt service, various local subventions
(including the vehicle license fee [VLF] backfill), and
other purposes.
Total General Fund Spending. Figure 2 (see next page) presents our General Fund spending
forecast by major program area through 2006-07.
Total spending is estimated to decline from $80.1 billion
in 2000-01 to $78.7 billion in 2001-02. This decline is
the first year-over-year expenditure reduction since
1993-94. Over the entire period, General Fund
expenditures are forecast to increase at an average annual rate of Projections by Program Area. The overall 4.7
percent average annual increase in state spending
reflects moderating growth in most program areas.
As indicated in Figure 2:
Figure 2 Projected General Fund
Spending for Major Programsa (Dollars in Millions) Actual Estimated Projected Average 2000‑01 2001‑02 2002‑03 2003‑04 2004‑05 2005‑06 2006‑07 Education programs K-12—Proposition 98b $27,221 $28,751 $29,531 $31,094 $33,185 $34,707 $36,647 5.1% Community Colleges—Proposition 98 2,677 2,687 2,759 2,905 3,101 3,243 3,424 4.2 CSU 2,393 2,538 2,667 2,827 2,996 3,170 3,356 5.8 UC 3,090 3,258 3,349 3,538 3,733 3,929 4,149 5.0 Health and Social Services Medi-Cal benefits $8,442 $8,963 $9,640 $10,522 $11,321 $12,112 $12,962 7.4% CalWORKs 1,922 2,018 2,069 2,069 2,039 2,039 2,039 1.0 SSI/SSP 2,575 2,855 3,108 3,322 3,481 3,663 3,870 7.0 IHSS 724 915 1,059 1,226 1,418 1,583 1,773 16.1 Other major programs 5,224 6,297 6,819 7,469 8,123 8,532 9,219 9.9 Department of Corrections $4,240 4,411 4,483 4,687 4,889 5,115 5,360 4.0% Vehicle License Fee subventions $3,894 2,315 3,753 4,015 4,317 4,532 4,759 3.4% Debt servicec $2,822 3,333 3,417 3,623 3,756 3,851 3,804 5.1% Other programs/costs $14,916 10,384 9,947 12,164 12,709 13,629 14,132 -0.9% Totals $80,139 $78,725 $82,601 $89,461 $95,069 $100,105 $105,494 4.7% a
Detail may not total due to rounding. b
Projections for K-12 and community college Proposition 98
funding have been apportioned by the same percentages as actual funding
in the 2001‑02 Budget Act. c
Includes both general obligation and lease-payment bonds
for all departments.
4.7 percent, increasing to $105 billion by 2006-07.
Annual Growth
2000‑01
Through
2006‑07
State spending for K-14 education (K-12
schools and community colleges) is determined largely
by Proposition 98, passed by the voters in 1988.
Proposition 98 sets the minimum amount that the
state must provide for California's public K-12
education system and the California Community
Colleges (CCC). About 80 percent of operations funding
for these school programs is from the state General
Fund and local property taxes, pursuant to
Proposition 98. Public K-12 education is provided to about
6 million students—ranging from infants to
adults—through over 1,000 locally governed school
districts and county offices of education. The CCC
provide instruction to about 1.6 million adults at 107
colleges operated by 72 locally governed districts.
The Spending Forecast. We estimate that
annual growth in total Proposition 98 spending
(General Fund and local property taxes) for K-14
education will average over 5 percent for the 2001-02
through 2006-07 period. This is lower than the
7.8 percent increase in 2000-01 and the projected increase
of 5.9 percent for the current year.
Proposition 98 spending in these two years reflects
appropriations above the minimum guarantee ($415 million
in 2000-01 and nearly $4 billion in the current
year). Our forecast reflects our moderate revenue
forecast and future spending at the minimum guarantee
level. It also includes a slowing rate of growth in K-12
average daily attendance (ADA), a principal factor
in setting the minimum guarantee level.
We estimate that Proposition 98 will require
the Legislature to allocate approximately $1.5 billion,
or 3.2 percent, more to Proposition 98 programs
in 2002-03 than in 2001-02. Since we estimate that
almost $1 billion of additional property tax
revenue will be allocated to school and community
college districts in 2002-03, the General Fund increase
would be $500 million (a 1.6 percent increase).
Given the uncertainty surrounding the economy and per capita personal income in the coming
year, however, the increase in the Proposition 98
guarantee in the budget year could easily range
between $500 million and $2 billion. Assuming the
same growth in local property tax revenues, the
required appropriations from the General Fund in
2002-03 could range from a decrease of $500 million
from the current-year General Fund appropriations to
an increase of $1 billion.
"Freed-Up" Proposition 98
Funds. Within the amounts that we have forecast for Proposition 98
is a total of $600 million that will be available for
reallocation to other K-14 education purposes on
an ongoing basis beginning in 2002-03. This amount includes $350 million that is currently allocated
to a loan repayment relating to the CTA v.
Gould lawsuit. Another $250 million will become available
due to the sunset of the Schiff-Bustamante
Instructional Materials Program (Chapter 312, Statutes of
1998 [AB 2041, Bustamante]).
This $600 million of freed up funds
represents an additional potential resource for meeting
enrollment growth and COLA needs of existing K-14
education programs. We estimate that these
enrollment growth and COLA needs will total about
$1.5 billion in 2002-03. Our estimate of growth in the
total Proposition 98 guarantee ($1.5 billion) would
just meet these needs. However, if growth in the
minimum guarantee level for 2002-03 falls in the
low range of our estimates ($500 million) then even
the availability of the $600 million of freed up
funds would not permit the Legislature to fully meet
enrollment growth and COLA needs within the Proposition 98 guarantee.
Key Forecast Factors. General Fund
expenditures for Proposition 98 depend on the following
factors: state population, K-12 ADA, per capita personal
income, per capita General Fund revenues, and
local property taxes. Figure 3 summarizes our
assumptions for these factors and the annual changes in
the guarantee which result.
Figure 3 The LAO Proposition 98
Forecast 2001‑02 2002‑03 2003‑04 2004‑05 2005‑06 2006‑07 Proposition 98 (in billions)a K-12 $40.8 $42.2 $44.4 $47.3 $50.0 $52.6 Community
Colleges 4.6 4.7 5.0 5.3 5.6 5.9 Totals $45.4 $46.9 $49.4 $52.6 $55.6 $58.5 Proposition 98 “Test” 3 2b 2 2 2 2 Annual
Percentage Change
State
population
1.8% 1.6% 1.6% 1.6% 1.5% 1.4% K-12
average daily attendance 1.4 1.0 0.8 0.7 0.6 0.3 Per
capita personal income
7.8 -1.0 4.5 5.8 5.0 5.0 Total
guarantee 5.9 3.2b 5.3 6.5 5.6 5.3 General
Fund 5.0 1.6 5.3 6.7 4.6 5.6 Local
property taxes 8.1 7.1 5.4 6.1 6.1 6.4 a
Includes local property tax revenues. b
Includes restoration of $1.5 billion of "maintenance
factor."
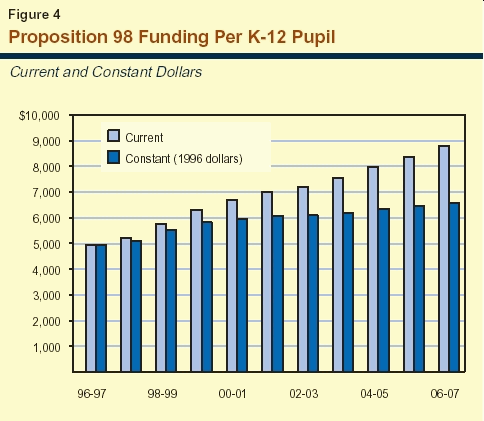
K-12 Funding Projections. We project that K-12
Proposition 98 funding after 2002-03 will increase by an average
of 5.7 percent per year over the forecast period. Figure 4
(see page 28) displays our projected K-12 per-pupil
spending from 2001-02 through 2006-07 (in both
"current" and inflation-adjusted dollars). These estimates,
which are derived from our Proposition 98 forecast, reflect
real (that is, inflation adjusted) per-pupil increases
averaging 1.6 percent each year from 2001-02 through
2006-07. These additional resources—averaging over
$800 million each year after 2002-03—would permit expansion of
existing programs and/or funding for some new programs.
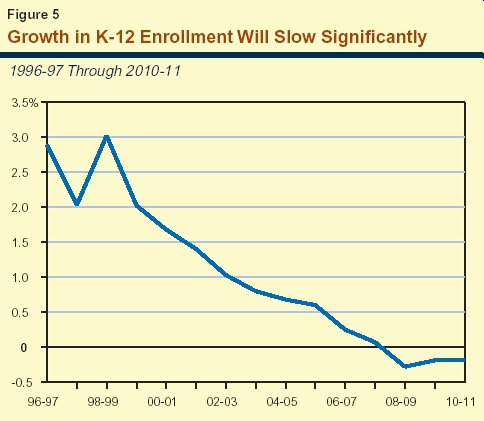
Slowing K-12 Enrollment Growth. K-12 ADA is projected
to increase by just over 1 percent in 2002-03, bringing total K-12
ADA to over 5.8 million students. As Figure 5 shows, over the next
seven years the rate of K-12 enrollment growth is expected to slow,
then actually turn negative by 2008-09. This period of slow growth
and eventual enrollment decline will ease somewhat the fiscal
challenges the Legislature faces in meeting overall state needs.
Community College Funding
Projections. Based on our Proposition 98 projections, we
estimate total CCC funding would increase by about 5 percent per year
over the forecast period. (This assumes no change in the proportion
of Proposition 98 funds going to the CCC.) These increases would
cover inflation and projected enrollment growth, with only a small
amount available for new programs or program augmentations.
In addition to community
colleges, the state's public higher education system includes the UC
and the CSU. The UC consists of eight general campuses, one health
science campus, numerous special research facilities, and a planned tenth campus
in Merced. The UC awards bachelor's, master's, and doctoral degrees, as well as various professional
degrees. The UC has primary jurisdiction over
research. The CSU consists of 22 campuses, several
off-campus centers, and a planned campus at Camarillo.
The CSU grants bachelor's and master's degrees and
may award doctoral degrees jointly with UC or a
private university.
The Spending Forecast. We estimate that
spending for UC and CSU (excluding funding for
capital outlay and debt service) will increase from
$5.8 billion in 2001-02 to $6 billion in 2002-03, or by
2.4 percent. By 2006-07, we estimate that spending for
UC and CSU will increase to $7.5 billion, reflecting
annual increases of about 5.4 percent.
Key Forecast Factors. For 2002-03 and
subsequent fiscal years, we assume that UC and CSU will
receive "base" budget increases equivalent to
the growth in inflation and enrollments. Over the
forecast period, inflation is projected to average
about 3.1 percent annually. With regard to
enrollment growth, CSU's will vary between 2.6 percent
and 3.1 percent over the period, with UC's growth
being somewhat less each year.
In his "partnership" with CSU and UC, the
Governor committed to annual General Fund base adjustments of 5 percent plus funding for
enrollment growth. The Legislature has not endorsed such
automatic funding increases. In fact, it is unclear
what exactly the partnership means at this time, as
the Governor proposed a 2 percent base increase
(rather than 5 percent) in his May Revision of the
2001-02 budget. Our projections for the CSU and UC
budgets are somewhat lower than would occur under the partnership.
Cal Grant Increases. Chapter 403, Statutes
of 2000 (SB 1644, Ortiz), made Cal Grant awards an entitlement for every qualified graduating
high school senior. There is much uncertainty as to
the fiscal impact of the new entitlement program.
This is because it is unclear how students and their
families will respond to the changes in Cal Grant
policies. Based on information from the Student
Aid Commission, however, we project that Cal Grant expenditures could approach $1 billion by 2006-07.
The Medi-Cal Program (the federal
Medicaid program in California) provides health care
services to recipients of CalWORKs or SSI/SSP grants,
and other low-income persons who meet the
program's eligibility criteria (primarily families with
children and the elderly, blind, or disabled). The state
and federal governments share most of the program
costs on a roughly equal basis.
The Spending Forecast. We estimate that the
General Fund spending for Medi-Cal benefits
(excluding administrative costs) will be nearly $9 billion
in 2001-02, essentially the same amount
appropriated in the budget act. We project that by the end of
the forecast period in 2006-07, General Fund
spending for Medi-Cal benefits will reach $13 billion, an
average annual increase of 8 percent over the
projection period.
Key Forecast Factors. Three factors play a
significant role in our forecast:
The Healthy Families Program implements
the federal State Children's Health Insurance
Program, enacted in 1997. Funding generally is on a
two-to-one federal/state matching basis. The program
offers health insurance to eligible children in
families with income below 250 percent of the federal
poverty level. Families pay a relatively low monthly
premium and are offered coverage similar to that
available to state employees.
The Secretary for the California Health and Human Services Agency has submitted a waiver
request to federal authorities to expand Healthy
Families coverage to eligible parents of children enrolled
in the Medi-Cal and Healthy Families Programs. At
the time these projections were prepared,
California's waiver request was pending with federal
authorities. The way the state pays for its share of the cost of
the Healthy Families Program has changed recently.
Previously all state costs were borne by the
General Fund. This year, however, the costs of the
proposed expansion of coverage to parents, as well as
recent expansions of coverage to certain groups of
children, have been shifted to a new special fund, the
Tobacco Settlement Fund (TSF), which we discuss later in
this section. The cost of coverage for most children
continues to be funded from the General Fund.
The Spending Forecast. We estimate that
overall state spending for the Healthy Families Program
will exceed $200 million in 2001-02, about
$37 million less than the amount of state funds appropriated
for the program in the budget act. We further
estimate that overall state spending for the program will
increase 90 percent during 2002-03 to about
$384 million, and that by 2006-07 the program will have
an annual state cost of more than $650 million.
As we noted earlier, part of the state cost discussed above will be supported from the TSF
and part from the General Fund. We estimate that
General Fund support for Healthy Families will be $134 million in 2001-02, or $24 million less
than appropriated in the 2000-01 Budget Act.
We estimate that General Fund spending for the program
will increase 30 percent in 2002-03 to $174 million,
and that by 2006-07 the program will have an
annual General Fund cost of about
$227 million.
Key Forecast Factors. General Fund spending
is expected to decrease in 2001-02 compared to the previous fiscal year because some program costs
that were previously supported by the General Fund
were shifted to the TSF. Subsequent increases in
General Fund spending are primarily the result of
medical inflation and demographic factors. Our
projection assumes that program enrollment will peak
at 80 percent and 88 percent, respectively, for
eligible children and adults in 2002-03.
Our projections assume that the enrollment of parents in the program, which has been delayed
beyond the October 2001 date assumed in the
budget, will actually commence in April 2002. Phasing-in
of the parent caseload accounts for a significant
part of the projected 90 percent increase in state
expenditures for the Healthy Families Program in
2002-03. Future enrollment growth and demographic factors are expected to increase the cost
of coverage for parents so that it accounts for
almost half the cost of the Healthy Families Program
by 2006-07.
The 2001-02 budget plan established a new
special fund, the TSF, which is made up of revenues
received by the state from the settlement of
tobacco-related litigation. State law specifies that
about $402 million be deposited in the TSF in 2001-02
for various health care programs, with the
remainder (approximately $73 million) deposited in the
General Fund. In 2002-03 and subsequent years all
settlement payments are to be deposited in the TSF
for various appropriations for health programs.
Our projections indicate that as much as
$56 million of the money allocated to the TSF for the However, our projections further indicate that
the combined cost of these programs would begin to substantially exceed the amount of funding
available from the TSF in 2003-04. By 2006-07, the
cost of these programs could exceed the amount
available from the TSF by more than $380 million,
with these costs being borne by the General Fund.
2001-02 fiscal year will probably go unspent, primarily because the planned expansion of the
Healthy Families coverage for parents is occurring
more slowly than anticipated. Assuming these
unspent funds were carried over into the next fiscal year,
it appears that a sufficient amount of
money—about $500 million—would be available to support
the programs now funded from the TSF in 2002-03.
In response to federal welfare reform
legislation, the Legislature created the CalWORKs program
in 1997. This program, which replaced the Aid to
Families with Dependent Children program, provides cash grants and welfare-to-work services to
families with children whose incomes are not adequate
to meet their basic needs.
The Spending Forecast. General Fund
spending in 2001-02 for the CalWORKs program is
estimated to be $2 billion, an increase of 5 percent over
the prior year. In 2002-03, spending is projected to
increase by 2.5 percent, to $2.1 billion. Through
the remainder of the forecast period, spending is
projected to remain essentially stable, decreasing
1 percent by 2006-07.
Key Forecast Factors. Our CalWORKs
spending projection is primarily based on assumptions
about the federal maintenance-of-effort (MOE)
requirement and the Temporary Assistance for Needy
Families (TANF) block grant reauthorization. Our
spending forecast assumes that the TANF block grant
will be reauthorized at its current $3.7 billion annual
level for California, resulting in essentially stable
total program funding throughout the forecast period.
In order to receive the TANF block grant, California must meet a $2.7 billion annual MOE
requirement, approximately $2 billion of which is
satisfied with spending on the CalWORKs program. The
remaining $700 million is spent on other
MOE-eligible programs. Since CalWORKs was enacted,
the Legislature has taken steps to maintain General
Fund spending at the MOE floor. Our spending
projection assumes this practice will continue.
The combination of statutory COLAs and projected caseload increases (discussed below) will
result in greater cost pressures in the CalWORKs
program during the projection period. These
pressures, will be partially offset by some savings due to
adult recipients reaching their statutory five-year
time limit on cash assistance. Given that grants are
entitlements and that child care has essentially
been treated as such, these cost pressures may result
in potential underfunding of employment services compared to current levels. This shortfall would
be compounded once the federal Welfare-to-Work funds, which have been a separate source
of CalWORKs employment services funding, have been fully expended, most likely by the end of 2002-03.
Counties may use their performance incentive funds to address the potential employment
services shortfall. As of July, counties had spent
approximately 13 percent of the $1.1 billion in awarded
incentives. Thus, depending on what service level counties elect to provide, as well as the extent
to which they have already obligated their
performance incentives, in aggregate counties could maintain
the present level of employment services in the
budget year and perhaps into later years. This may not
be the case in certain counties that have already
expended substantial sums of their incentive funds.
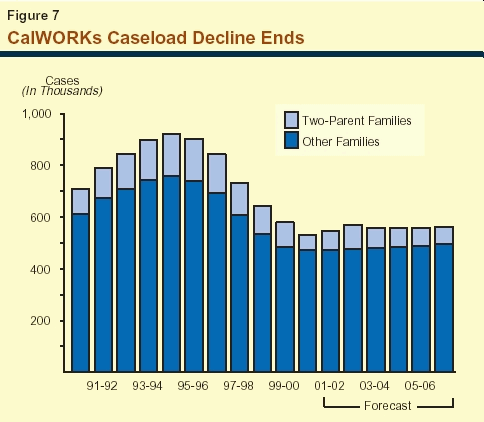
Caseload Trends and Projections. Following
a rapid increase in the early 1990s, the caseload
peaked at 921,000 in 1994-95, and then declined by
42 percent through 2000-01. The budget act forecast
assumed an end to the decline in 2001-02, with modest caseload growth beginning midyear. We
believe caseloads will be higher-than-budgeted due to
the recent economic downturn, increasing by
3 percent in 2001-02, and by 4 percent in 2002-03.
Following an economic recovery, we project a
2 percent caseload decline in 2003-04. We then project
the caseload to remain essentially stable through
2006-07, as shown in Figure 7. Our projections are based on a trend analysis of caseloads, birth
rates, grant levels, and unemployment rates, and our
best judgment about the impact of a mild recession
on single parent cases.
The SSI/SSP provides cash assistance to
eligible, aged, blind, and disabled persons. The SSI
component is federally funded and the SSP component
is state funded.
The Spending Forecast. General Fund
spending for the SSP is projected to be about $2.9 billion
in 2001-02, an increase of 11 percent over the prior
year. For 2002-03, we project an increase of
8.9 percent, raising total expenditures to $3.1 billion. We
project that from 2003-04 through the end of the
forecast period, spending for the SSP will increase by an
average of 5.6 percent per year, eventually reaching
a total of $3.9 billion.
Key Forecast Factors. The two main
components of projected cost increases in SSI/SSP are (1)
caseload growth and (2) providing the statutory COLA.
As discussed below, the caseload is expected to
increase at an average annual rate of about 2.2 percent during the forecast
period. In 2002-03, spending is projected to increase by
about $250 million. This increase is primarily due to the statutory
COLA ($175million) and caseload growth ($63 million). From
2003-04 through 2006-07, these factors together will result in annual
spending increases of about $200 million.
Caseload Trends and Projections. During the late 1980s
and early 1990s the caseload grew rapidly, with most of the growth in
the disabled component of the caseload. In the mid-to-late
1990s, the caseload leveled off and actually declined in 1997-98, in
part because of federal policy changes which restricted eligibility.
Since March 1998, the caseload has been growing. In
the future, we expect the aged component of the caseload to mirror the growth of the overall
population over age 65. For the disabled, we
anticipate caseload growth will be similar to the past year.
In total, we project that caseload growth will be
about 2.2 percent each year
The IHSS program provides various services
to eligible aged, blind, and disabled persons who
are unable to remain safely in their own homes
without such assistance.
The Spending Forecast. General Fund
spending for IHSS is projected to be $915 million in
2001-02, an increase of 26 percent over the prior year.
For 2002-03, we project that costs will increase by
an additional 16 percent. This rate of spending
growth is expected to continue for the next two fiscal
years then fall to about 12 percent in the final two
years of our forecast, resulting in total expenditures
of $1.8 billion in 2006-07.
Key Forecast Factors. Our forecast assumes
that costs will increase 7 percent each year due to
caseload growth and increases in the hours of service
provided to recipients. Further, recent legislation
authorizing state participation in health benefits and
wage increases for certain IHSS workers will increase
costs by about an additional 7 percent each year
through 2004-05.
The major state judiciary and criminal justice programs include support for four departments in the executive branch—the California Department of Corrections (CDC), Department of the Youth Authority, the Department of Justice, and the Office of Criminal Justice Planning—as well as expenditures for local trial courts and state appellate courts. The largest expenditure program—the CDC—is discussed in more detail below.
The CDC is responsible for the
incarceration, training, education, and care of adult felons
and nonfelon narcotics addicts at 33 state prisons.
The CDC also supervises and provides services to
parolees released to the community.
The Spending Forecast. General Fund support
for CDC is forecast to grow by about $157 million
from 2000-01 to 2002-03, reaching about $4.4 billion
at the end of that period. Expenditures for CDC
are forecast at about $5.4 billion by 2006-07. (This
includes adjustments for employee compensation increases,
but does not include General Fund support for capital
outlay and debt service, which are accounted for
elsewhere in our projections.)
The projected growth in adult correctional expenditures continues a trend of steadily
increasing CDC budgets that has existed since the early
1980s. However, in a change from past growth trends,
the CDC budget now appears likely to grow
significantly more slowly. Under our new projections, the
CDC budget would grow at an average annual rate of about 4 percent through 2006-07, compared
with substantially higher prior annual growth rates
that sometimes exceeded 10 percent. Throughout
the projection period, the CDC General Fund
support budget is forecast to be about 5 percent of total
General Fund expenditures.
The department's General Fund costs will be partially offset by $158 million in annual
reimbursements from the federal government for a portion
of the state's costs of housing undocumented immigrants convicted of felonies in California. We
assume that Congress will continue to provide the
federal fiscal year 2002 level in the future.
Key Forecast Factors. The projected increases
in General Fund support for CDC reflect the continued growth in the prison inmate population that
is expected during the forecast period. The inmate population is projected to exceed 164,000 by
June 2007. That represents an increase of about 8,200
inmates, or about 1 percent, over the six-year
projection period. As Figure 8 shows, the inmate
population will decrease by 4,100 by the end of
2001-02, which is the largest population decrease since
1991-92. The inmate population will continue to stabilize at this lower level through 2002-03.
Beginning in 2003-04, the population will increase at
an average annual rate of about 2 percent, reaching
a slightly higher level than the 2000-01 population
by June 2007.
The projected 2001-02 population decrease is
due primarily to Proposition 36—the Substance
Abuse and Crime Prevention Act—which went into
effect on July 1, 2001. This law requires that persons
convicted of nonviolent drug possession offenses
be placed on probation and receive drug treatment, rather than be incarcerated in state prison.
Similarly, the measure will redirect parole violators who
commit nonviolent drug possession offenses into
treatment rather than returning them to prison. This
initiative is expected to reduce the prison
population by about 7,700 inmates by 2006-07.
The projected 2 percent annual increase in
the population, beginning in 2003-04, is due
primarily to existing inmates serving longer sentences and
new inmates being sentenced under two
voter-approved initiatives. Specifically, the "Three Strikes and
You're Out" law, enacted in 1994 in Proposition 184, is
expected to increase the population because of the
significantly longer prison sentences imposed upon offenders with prior serious felony offenses. In
addition, Proposition 21—the Gang Violence and
Juvenile Crime Prevention Act—which was passed
by the voters on March 7, 2000, is expected to
increase the population by expanding the definition of
serious or violent offenses, potentially resulting in
more "strikes" and increasing penalties under the
Three Strikes law. Currently, about 57,000 inmates
have been sentenced under these laws. During the
projection period, the increases attributable to the
sentencing laws are projected to fully offset the decrease
resulting from the implementation of Proposition 36.
The projected increase in the CDC General Fund support
budget also reflects increases in prison health care expenditures.
Increases in the overall cost of providing health care have caused health
care expenditures to increase at a higher rate than other prison
support costs. In addition, during the last decade, class action
lawsuits brought by inmates against the state have resulted in
settlement agreements mandating major prison health care reforms that have
increased health care expenditures.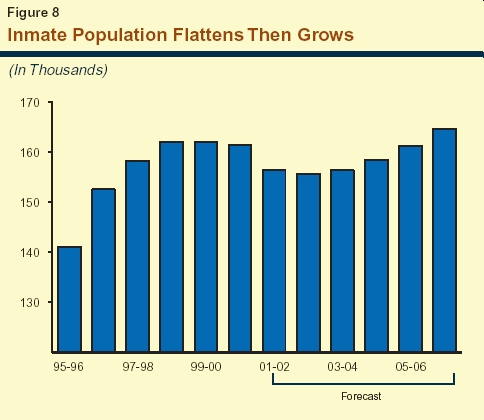
The VLF is an annual fee on the ownership of registered vehicles in California. It is levied in place of taxing vehicles as personal property, and the revenues are distributed to cities and counties. The Legislature reduced the fee—which was set at 2 percent of the depreciated value of a vehicle—by 25 percent in calendar year 1999, 35 percent in 2000, and 67.5 percent in 2001 and thereafter. Under the provisions of these reductions, cities and counties continue to receive the same amount of revenues as under prior law, with the reduced VLF amounts replaced by General Fund spending. In the current year, local governments will receive about $3.5 billion from the General Fund backfill. Of this amount, $1.2 billion was appropriated in the prior year. For 2002-03, General Fund expenditures for the backfill will total $3.8 billion. We project that expenditures will grow to $4.8 billion by 2006-07, primarily due to increases in new car sales and car prices.