
|
|
2001‑02 |
2002‑03 |
2003‑04 |
2004‑05 |
|
One-time Costs |
|
|
|
|
|
Revenue
limit and categorical deferrals |
$931 |
$2,158 |
$1,097 |
$1,083 |
|
Community
college deferral |
116 |
� |
200 |
200 |
|
Cumulative
mandate deferrals |
656 |
958 |
1,266 |
1,524 |
|
Ongoing Costs |
|
|
|
|
|
Revenue
limit deficit factor |
� |
� |
$883 |
$643 |
|
Totals |
$1,703 |
$3,116 |
$3,446 |
$3,450 |
|
|
||||
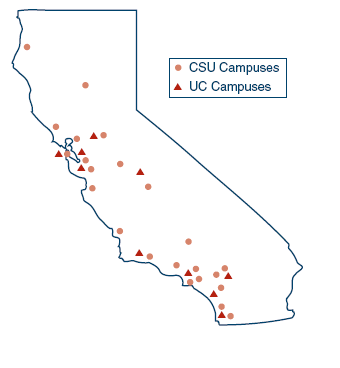
| CSU | University of California | |||
| Bakersfield | 6,621 | Berkeley | 33,191 | |
| Channel Islands | 1,583 | Davis | 29,280 | |
| Chico | 14,134 | Irvine | 23,389 | |
| Dominguez Hills | 9,488 | Los Angeles | 37,260 | |
| Fresno | 17,443 | Merced | —a | |
| Fullerton | 24,910 | Riverside | 15,457 | |
| Hayward | 12,001 | San Diego | 23,622 | |
| Humboldt | 7,329 | San Francisco | 3,989 | |
| Long Beach | 27,411 | Santa Barbara | 21,279 | |
| Los Angeles | 17,016 | Santa Cruz | 14,429 | |
| Maritime Academy | 868 | Total UC | 201,896 | |
| Monterey Bay | 3,570 | aCampus scheduled to open in fall 2005. | ||
| Northridge | 24,232 | |||
| Pomona | 17,644 | |||
| Sacramento | 22,457 | |||
| San Bernardino | 13,731 | |||
| San Diego | 27,459 | |||
| San Francisco | 23,576 | |||
| San Jose | 21,968 | |||
| San Luis Obispo | 17,169 | |||
| San Marcos | 6,139 | |||
| Sonoma | 6,997 | |||
| Stanislaus | 6,527 | |||
| Total CSU | 330,276 |
| Acknowledgments
The Legislative Analyst's Office (LAO) is a nonpartisan office which provides fiscal and policy information and advice to the Legislature. |
LAO Publications
To request publications call (916) 445-4656. This report and others, as well as an E-mail subscription service, are available on the LAO's Internet site at www.lao.ca.gov. The LAO is located at 925 L Street, Suite 1000, Sacramento, CA 95814. |