Foreword
This report provides our projections of General Fund revenues and expenditures for 2005-06 through 2010-11. It includes our independent assessment of the outlook for California’s economy, demographics, revenues, and expenditures.
Chapter 1 contains our principal findings and conclusions. Chapter 2 presents our economic and demographic projections, Chapter 3 our revenue forecasts, and Chapter 4 our expenditure projections.
Our fiscal projections primarily reflect current-law spending requirements and tax provisions. They are not predictions of future policy decisions by the Legislature, nor are they our recommendations as to what spending and revenue levels should be.
This report, in its eleventh year of publication, reflects the historical mission of the Legislative Analyst’s Office to assist the Legislature with its fiscal planning by assessing the revenues and expenditures of the state.
The Budget Outlook
Summary
Budgetary Outlook Has Improved . . .
The budget outlook for 2006-07 and beyond has improved considerably over the past year. In last year’s California’s Fiscal Outlook, we projected that the state faced ongoing structural shortfalls peaking at nearly $10 billion in 2006-07. Since that time, California’s budget outlook has benefited from both a major increase in revenues and a significant amount of savings adopted in the 2005-06 spending plan. As a result of these developments, our current forecast indicates that:
The current year will end with a reserve of about $5.2 billion, up by nearly $4 billion from the 2005-06 Budget Act estimate.
This large carryover reserve will be more than sufficient to keep the state’s budget in balance in 2006-07 without any new program reductions or added revenues-even though current-law projected expenditures exceed projected revenues by $4 billion during that year.
. . .But State Still Not Out of the Woods
While the improved fiscal outlook is clearly very good news, the state still faces major challenges in achieving an ongoing balance between revenues and expenditures and getting its fiscal house in order. Even assuming continued steady economic growth, we project that multibillion-dollar operating deficits (that is, annual shortfalls between revenues and expenditures) will persist throughout most of the forecast period. Eliminating these shortfalls will require significant actions. Beyond this, an economic downturn or even sharp slowdown sometime in the next several years would add several billions of dollars to the projected shortfalls, and while this is not our baseline forecast, it could always occur. For these reasons, it will be important for the Legislature to continue to take actions to minimize operating shortfalls, match any new or increased program funding with offsetting savings or revenues, avoid using the remaining deficit-financing bonds in 2006-07, and build up budgetary reserves.
Update on the 2005-06 Budget
The Budget as Adopted
The 2005-06 budget adopted last July included two key features which significantly improved the state’s longer-term fiscal picture. First, it contained well over $2 billion in ongoing budgetary savings, mainly in the areas of Proposition 98 and social services. Second, lawmakers allocated most of the unexpectedly strong revenues received last spring to prepay outstanding loans from local governments and eliminate the planned sale of additional deficit-financing bonds.
Under the signed budget, the state was expected to close 2005-06 with a reserve of $1.3 billion. We also projected that-as a result of improving revenues and actions taken in the 2005-06 spending plan-the operating shortfall in 2006-07 would be reduced to $6 billion, absent further corrective actions.
What Has Happened Since July?
Key changes in our fiscal estimates since the 2005-06 Budget Act was adopted are shown in Figure 1. These changes include the following:
Revenues Up Sharply. We estimate that General Fund revenues exceeded the budget estimate by over $1 billion in 2004-05 and prior years combined, and will exceed the budget estimate by $2.8 billion in 2005-06. This combined $3.9 billion increase is primarily related to the personal income tax, but also reflects a significant gain in the corporation tax (CT) and a modest increase in the sales and use tax.
Expenditures Down Modestly. We also estimate that net General Fund expenditures for 2004-05 and 2005-06 will fall below the 2005-06 Budget Act estimate by $80 million. The largest changes consist of lower spending for Proposition 98 education partly offset by increases in state retirement costs (stemming from an assumed one-year delay in the sale of pension obligation bonds).
Result-Major Increase in Year-End Reserve. Taking into account both the sharply higher revenues and slightly lower net costs, we estimate that the 2005-06 year-end reserve will increase from the $1.3 billion assumed in the 2005-06 Budget Act to our revised estimate of $5.2 billion. As noted below, much of this reserve will be needed to maintain a balanced budget in 2006-07.
|
Figure 1 Effect of Recent
Developments |
||
|
(In Millions) |
||
|
|
|
|
|
2005‑06 Budget Year-End Reserve (July 2005) |
— |
$1,302 |
|
Revenue Increases |
|
|
|
2004‑05 and prior years |
$1,046 |
— |
|
2005‑06 |
2,808 |
— |
|
Subtotal (increase to reserve) |
— |
$3,853 |
|
Expenditure Changes (2004‑05 and 2005‑06 |
|
|
|
Proposition 98 |
-$416 |
— |
|
Medi-Cal |
-197 |
— |
|
Corrections |
112 |
— |
|
Pension obligation bonds delayed one year |
308 |
— |
|
Other (net) |
113 |
— |
|
Subtotal (increase to reserve) |
— |
$80 |
|
LAO Revised Estimate (November 2005) |
— |
$5,236 |
|
Basis for Our Estimates Our revenue and expenditure forecasts are based primarily on the requirements of current law, including constitutional requirements (such as Proposition 98) and statutory requirements (such as for program qualifications and cost-of-living adjustments [COLAs]). They take into account 2005-06 budget actions on out-year funding-including the suspension of state COLAs for California Work Opportunity and Responsibility to Kids and Supplemental Security Income/State Supplementary Program for two years. In other cases, the estimates incorporate effects of projected changes in caseloads, prices, federal requirements, and other factors affecting program costs. We have not included funding to cover the Governor’s “compact” with higher education, as the Legislature has taken no statutory action to implement such an agreement through its multiyear period. Rather, our estimates for higher education are based on projected enrollment and inflation-related increases. Fully funding the compact would require added annual expenditures beyond those we are projecting, reaching over $700 million by the final year of the forecast period. Projections, Not Predictions. Our estimates are not predictions of what the Legislature and Governor will adopt as policies and funding levels in future budgets. Rather, our estimates are intended to be a reasonable “baseline” projection of what would happen if current-law policies were allowed to operate in the future. In this regard, we believe that our forecast provides a meaningful starting point for legislative deliberations involving the state’s budget so that corrective actions can be taken to ensure that the state’s fiscal house is in order. |
2006-07 Outlook
Budget Projected to Balance. Figure 2 shows our updated projection of the General Fund condition through 2006-07, using the assumptions outlined in the nearby box. We forecast that revenues will climb to $91.1 billion and that expenditures will total $95.1 billion, resulting in a $4 billion operating shortfall. After taking into account the $5.2 billion reserve available carried into 2006-07 from 2005-06, the $4 billion operating shortfall in 2006-07 would leave the state with a year-end General Fund reserve of just over $1.2 billion.
|
Figure 2 LAO Projections of General Fund Condition |
|||
|
2004‑05 Through 2006‑07 |
|||
|
|
2004‑05 |
2005‑06 |
2006‑07 |
|
Prior-year fund balance |
$7,301 |
$8,760 |
$5,877 |
|
Revenues and transfers |
80,959 |
87,279 |
91,076 |
|
Deficit financing bond |
2,012 |
— |
— |
|
Total resources available |
$90,272 |
$96,039 |
$96,953 |
|
Expenditures |
81,512 |
90,161 |
95,111 |
|
Ending fund balance |
$8,760 |
$5,877 |
$1,842 |
|
Encumbrances |
641 |
641 |
641 |
|
Reserve |
$8,118 |
$5,236 |
$1,201 |
The large operating deficit in 2006-07 reflects factors affecting both the revenue and expenditure sides of the budget. Specifically:
On the revenue side, collections are forecast to grow by just 4.4 percent, due to (1) a large transfer of sales taxes on gasoline from the General Fund to transportation special funds (so-called “spillover funds”), (2) a resumption of the teachers’ tax credit, and (3) slow growth in CT revenues, partly related to amnesty-related refunds expected to go out in the budget year.
On the expenditure side, General Fund spending on Proposition 98 will increase due to (1) the end of the two-year diversion of property taxes from local governments to schools and (2) the triggering of additional spending on after school programs required by Proposition 49. Other factors include an increase in California Work Opportunity and Responsibility to Kids costs related to a court ruling affecting grant levels, and the payment of past non-education mandate claims.
What if Higher Proposition 98 Appropriations Occurred? Our estimates assume that Proposition 98 is funded at the minimum guarantee in 2006-07 (including the added spending required by Proposition 49) and all subsequent years. While over the long term the guarantee grows significantly faster than enrollment and inflation, this is not the case in 2006-07. This is because of an unusually small increase in the “Test 2” growth factor for the guarantee and an unusually large increase in the statutory cost-of-living adjustment (COLA) for K-12 apportionments. As a result of these factors, the minimum guarantee will rise by $731 million less than the amount needed to fully fund enrollment and COLAs for K-14 education programs in 2006-07.
In Chapter 4, we discuss several options for covering this shortfall in order to maintain the current-services level of funding. One of these options would be to appropriate above the guarantee. If the Legislature were to choose this option, total Proposition 98 spending in 2006-07 would be $731 million higher than otherwise, and the resulting year-end General Fund budgetary reserve would be reduced by a like amount, to $470 million.
Longer-Term Forecast
Our longer-term revenue and expenditure forecasts through 2010-11 are detailed in Chapters 3 and 4, respectively. Figure 3 shows the effects of these projections on the state’s operating balance-that is, annual revenues minus annual expenditures.
Operating Shortfalls to Persist but Shrink Over Time
The figure shows that the state would continue to face significant operating shortfalls over the forecast period, peaking at $4.3 billion in 2007-08, before declining to $3 billion in 2008-09, $1.7 billion by 2009-10, and $600 million in 2010-11. The operating shortfalls in 2007-08 and 2008-09 each include well over $1 billion in scheduled repayments of loans from transportation and other special funds. Thus, by the end of the forecast period the state would have just about grown its way out of its structural shortfalls. In the meantime, however, the state would have to take corrective actions to address its yearly shortfalls.
BSA Transfers Not Included in Our Estimates. In March 2004, the voters approved Proposition 58, which among other things requires annual transfers of revenues to a newly created reserve fund called the Budget Stabilization Account (BSA). These transfers are equal to 1 percent of General Fund revenues in 2006-07 ($910 million), 2 percent of revenues in 2007-08 ($1.9 billion), and 3 percent of revenues in 2008-09 ($2.9 billion) and annually thereafter until the balance of the BSA reaches $8 billion or 5 percent, whichever is greater. The Governor may suspend the transfers to this fund through executive order.
We have not included these transfers in calculating our estimates of operating balances. Inclusion of these transfers would add to the operating deficits we are projecting for the out years of our forecast period.
Implications of Our Projections for The Legislature
While the improved near-term and long-term outlooks are clearly positive news, the state is still not out of the woods with respect to its longer-term structural budget problem. Consequently, in approaching the upcoming budget, it will be important for the Legislature to get a head start on addressing its out-year shortfalls by achieving as large a reserve as possible by the close of 2006-07. It will also be important to match any significant new commitments with offsetting revenues or budgetary savings. Finally, we believe that the state should avoid using the remaining $3.7 billion in authorized deficit-financing bonds at this time. Along with reserves, these bonds would be valuable to keep available as an option for helping the state deal with the still large budgetary shortfalls projected for 2007-08 and 2008-09, and to provide a cushion against a steeper-than-projected slowdown in economic activity sometime within the next two years, should one materialize.
Economic and Demographic Projections
Economic and demographic developments are important determinants of California’s fiscal condition, mainly because of their impacts on state revenues and expenditures in such areas as education, health, social services, and transportation. This chapter presents our economic and demographic projections for calendar years 2005 through 2011, which will affect California’s budgetary condition during fiscal years 2005-06 through 2010-11.
The Economic Outlook
Overview of the Economic Forecast
Recent Growth Has Been Good. The U.S. economy has grown at a solid pace over the past year, despite facing soaring energy costs, rising interest rates, and three major hurricanes in the Gulf region of the country. Real gross domestic product (GDP) for the U.S. increased at an average annual rate of over 3.5 percent during the first three quarters of 2005, representing only a slight deceleration from the healthy pace experienced in 2004. The nation’s positive trends are clearly evident in California, which has experienced solid growth in employment, personal income, and housing-related activity for most of this year.
Some Near-Term Slowing Expected. Although the economic expansion has shown surprising resilience so far, we expect growth to moderate in late 2005 and early 2006, as the higher energy and interest costs being experienced take their toll on consumer confidence and discretionary incomes. An added concern in California is the state’s housing market, which-after several years of record sales and soaring prices-is vulnerable to adverse changes in interest rates or the strength of the economy.
Growth to Remain Moderate. After a period of slowing in 2006, our outlook calls for moderate economic expansion at both the national and state levels. Figure 1 summarizes the details of our economic forecasts for the nation and state. In the subsequent sections, we discuss in more detail the major factors underlying our forecasts.
|
Figure 1 The LAO’s Economic Forecast |
|||||||
|
Percentage Change (Unless Otherwise Indicated) |
|||||||
|
|
2005 |
2006 |
2007 |
2008 |
2009 |
2010 |
2011 |
|
United States |
|
|
|
|
|
|
|
|
Real gross domestic |
3.7% |
3.3% |
3.0% |
3.4% |
3.0% |
2.8% |
2.9% |
|
Personal income |
5.8 |
6.3 |
5.5 |
5.8 |
5.5 |
5.3 |
5.4 |
|
Wage and salary jobs |
1.6 |
1.4 |
1.3 |
1.4 |
1.1 |
0.9 |
0.8 |
|
Consumer Price Index |
3.5 |
2.6 |
2.2 |
2.3 |
2.5 |
2.5 |
2.4 |
|
Unemployment rate (%) |
5.1 |
5.0 |
5.2 |
5.0 |
5.0 |
5.1 |
5.1 |
|
Housing starts (000) |
2,028 |
1,768 |
1,727 |
1,738 |
1,676 |
1,655 |
1,662 |
|
California |
|
|
|
|
|
|
|
|
Personal income |
6.3% |
5.7% |
5.5% |
6.0% |
6.1% |
6.3% |
6.0% |
|
Wage and salary jobs |
1.4 |
1.3 |
1.4 |
1.5 |
1.4 |
1.4 |
1.4 |
|
Taxable sales |
6.1 |
5.2 |
5.6 |
6.1 |
5.6 |
6.1 |
5.9 |
|
Consumer Price Index |
4.4 |
3.5 |
2.5 |
2.6 |
2.7 |
2.7 |
2.6 |
|
Unemployment rate (%) |
5.5 |
5.6 |
5.4 |
5.4 |
5.3 |
5.3 |
5.3 |
|
Housing starts (000) |
214 |
185 |
183 |
175 |
172 |
170 |
175 |
U.S. Economy
First Three Quarters of 2005 Were Better Than Expected
The national economy has defied expectations by continuing to grow at a healthy pace through the first three quarters of 2005. The preliminary estimate for the third quarter’s GDP was a real (that is, adjusting for the effects of inflation) annual rate of growth of 3.8 percent. This healthy increase occurred despite the negative impacts of major hurricanes, rising interest rates, and over $3 per gallon gasoline prices. The overall increase in economic output was well-balanced, with consumer spending, housing, business investment, and exports all expanding at healthy rates during the quarter.
Profits Have Been Particularly Strong. Business earnings have continued to grow rapidly in 2005, despite higher energy and health insurance costs during the year. As shown in Figure 2, U.S. after-tax profits increased by 12 percent in 2004, and are expected to grow by another 30-plus percent in 2005. A significant portion of the recent gains in profits is due to dramatic increases in the profits of oil-related companies. The recent change in the tax treatment of foreign earnings of multinational companies that are being transferred (or repatriated) back to the U.S., may also be contributing to the healthy earnings growth this year. Beyond these special factors, however, profit growth appears to be widespread, occurring in most industry sectors.
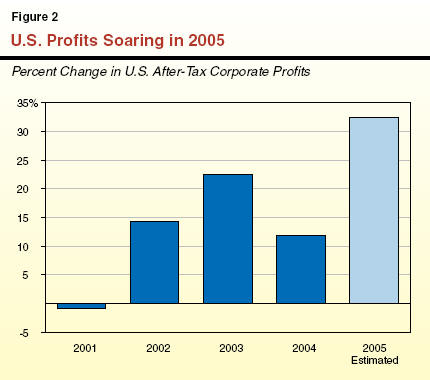
These healthy gains in profits are very important in the context of our fiscal outlook. This is because they are boosting taxable earnings subject to either the state’s personal or corporate income taxes. These earnings are also providing companies with large amounts of cash to invest in new facilities and equipment, which we believe will be the leading source of economic growth next year. The large profit margins are also enabling businesses to absorb rising energy costs, rather than passing them along in the form of higher product prices to consumers that would otherwise reduce demand and hurt the economy.
Inflation and Interest Rates Climbing
After several years of price stability, inflation accelerated significantly in 2005, with consumer prices increasing at an annual rate of 5 percent and producer prices jumping by 8 percent in the third quarter of the year. The majority of the acceleration is related to higher gasoline prices, but costs for a variety of other subcomponents of spending (such as for food, rents, and medical services) are also increasing significantly.
Partly in response to the higher inflation, the Federal Reserve has consistently increased interest rates in 2005. The federal funds rate (that is, the rate that banks charge on overnight loans to one another) has increased from 1.4 percent in the summer of 2004 to 4 percent as of late October 2005. We expect that short-term interest rates will continue to rise until the inflation subsides and economic growth slows.
Fourth Quarter Set to Slow
Although economic growth so far has outpaced expectations, there are signs that the pace of the expansion will slow late this year. For example, recent surveys of consumer confidence have shown major declines. These surveys, which are often harbingers of future consumer spending, suggest that retail spending during the holiday shopping season will be less robust than in recent years. Other signs of slowing growth include sharp declines in payroll employment in September (only part of which is attributable to the hurricanes), slowing growth in real disposable incomes (which are being eroded by sharply rising inflation), and the recent softening in monthly car sales-particularly of low gas mileage sport utility vehicles and light trucks.
The Nation’s Outlook-Slower but Still Moderate Growth in 2006
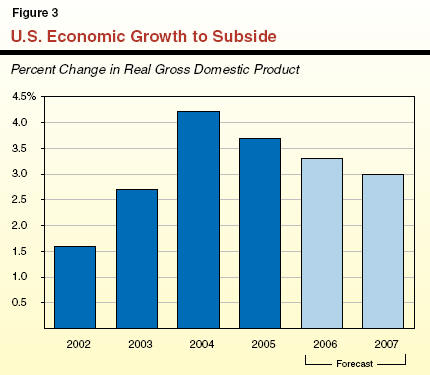
Our forecast assumes that U.S. economic growth will slow some over the next year. The anticipated slowdown is primarily due to a softening in consumer spending and home construction, which will be only partly offset by improvements in business spending and foreign exports. As indicated in Figure 3, we project that annual real GDP growth will subside from 3.7 percent in 2005, to 3.3 percent in 2006, and further to 3 percent in 2007.
Our national outlook also assumes that:
Consumer spending growth will slow from 3.4 percent in 2005 to 2.8 percent in 2006, before partially rebounding to an average annual pace of around 3 percent during the balance of the forecast period.
Business investment will accelerate from 8.5 percent growth in 2005 to over 11 percent in 2006, before moderating to about 5 percent in subsequent years of the forecast. These relatively healthy increases are related to continued strong growth in business spending on computer equipment and software. The continued strength in this type of spending is positive for California, which has a large number of firms which design and produce computer and software products.
Gasoline prices will fall slowly from current levels, reflecting an easing of U.S. demand in response to higher prices, as well as improving supply conditions occurring as refineries damaged by the hurricanes come back on line. (See box below regarding recent gas price developments.) However, continued strong worldwide gasoline demand and the lack of new U.S. refinery capacity are expected to keep prices from falling dramatically in the next several years. We specifically forecast that U.S. average gasoline prices will retreat to below $2.40 by the end of 2005, but remain above $2.00 through the end of the forecast period.
Inflation will remain high through the first quarter of 2006 (reflecting rising heating costs) but then subside beginning next spring. On an annual average basis, we forecast that the U.S. Consumer Price Index (CPI) will increase by 3.5 percent in 2005 and 2.6 percent in 2006. Factors leading to this anticipated slowing of inflation include the projected declines in energy prices, intense worldwide competition for a variety of products and services, and ongoing worker productivity gains. Over the longer term, inflation is expected to remain moderate, with the CPI averaging a projected 2.3 percent yearly increase between 2007 and 2011.
Interest rates will continue to rise through early 2006, but then stabilize as a result of slowing U.S. economic growth and lower inflation. The average interest yield on one-year Treasury Bills is projected to increase from 4.3 percent in the fourth quarter of 2005 to 4.8 percent by the fourth quarter of 2006.
Productivity growth will average around 2.5 percent annually through the forecast period. While this is down from the over 3.7 percent rate for the 2002-through-2004 period, it is still well above the rates historically achieved, particularly after the initial stages of economic expansions.
|
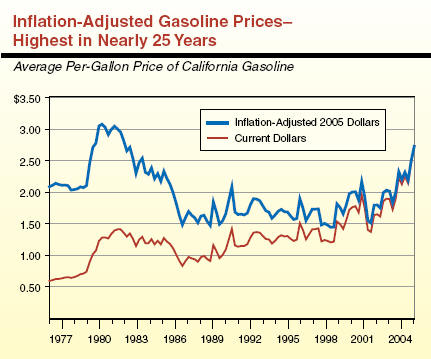
Update on Energy Prices Soaring energy prices, their impacts, and their likely future course have been a central focus of national and state economic forecasts for much of the past two years. Over the past year, crude oil prices have more than doubled, jumping from $30 per barrel in September 2004 to a peak of $68 per barrel in September 2005, before retreating somewhat to below $60 per barrel by early November. Gasoline and diesel fuel prices have correspondingly jumped by roughly proportional amounts. For example, the per-gallon price of gasoline increased from $1.40 per gallon in late summer 2003 to over $3.00 per gallon by late summer 2005, before falling back to roughly $2.60 per gallon. Diesel prices likewise jumped from about $1.60 per gallon in late summer 2003 to $3.15 per gallon in late summer 2005, where they remained as of late October. Gasoline Prices-Highest in Nearly 25 Years In current-dollar terms, gasoline prices are, by far, at their highest levels in history. Although in inflation-adjusted terms gasoline prices today are still lower than the all-time peaks reached in the early 1980s, they nevertheless are at their highest level in nearly 25 years and up dramatically over the past several years. The accompanying figure shows gasoline prices from the mid-1970s through the third quarter of 2005. It indicates that the average price for the third quarter of this year reached $2.73 per gallon, by far the highest current-dollar price. After adjusting for inflation, it was still 13 percent below the peak reached in 1980 (which in “today’s dollars” was $3.08 per gallon), but was up more than 50 percent from 2002. Natural Gas Prices Also Soaring While most of the attention so far has been concentrated on gasoline prices, hurricane-related damage to natural gas rigs in the Gulf of Mexico have resulted in a doubling in natural gas prices relative to last year. These increases will have a dramatic effect on home heating bills this winter. Economic Impacts The recent increases in gasoline prices and projected increases in natural gas bills will clearly have negative impacts on overall economic growth during the next year, by depressing the discretionary incomes of households and earnings of businesses. While these anticipated effects are significant, energy costs do represent a much smaller share of the overall economy today than in the 1970s and early 1980s, when the jump in energy prices induced two major recessions. This is largely due to increased efficiencies and expansion of low-energy use sectors. Thus, although these adverse energy-related developments have negative impacts, they are not expected to derail the economy.
|
California’s Economy
In many respects, California’s economic performance has mirrored the rest of the nation during the past year. During this period, the state has experienced healthy growth in output, sales, home construction, personal income, and corporate profits-despite historically high energy prices and rising interest rates. Looking ahead, we expect that California will continue to grow roughly in line with the U.S. economy, with slowdowns in consumer spending and housing activity being partly offset by healthy gains in investment spending and exports.
Housing Set to Ease
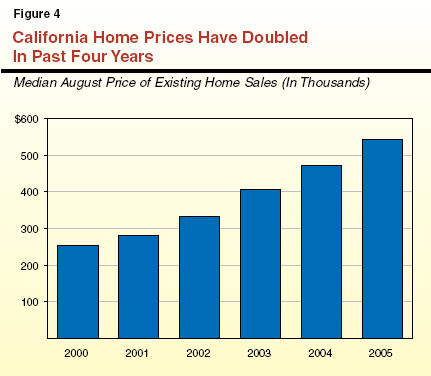
Home sales and prices have soared in California over the past several years. The volume of sales reached an all-time high in 2004, and will remain near record levels this year. As shown in Figure 4, the median price of existing home sales has jumped by over 100 percent in the past four years, and now stands at about $550,000. This is more than double the national median of $220,000.
These extraordinary developments have contributed to major increases in sales and income in the state’s real estate and financial sectors. The “wealth effect” associated with rising home values has also contributed to retail spending in the state.
However, after several years of sustained increases, home prices are now at all-time records, making California’s housing market vulnerable to setbacks related to rising interest rates or slowing economic growth. Under our baseline forecast, which anticipates modest increases in interest rates, we expect home prices to fall modestly, and that sales volumes, new construction, and mortgage refinancings will ease in 2006.
Larger increases in interest rates would result in correspondingly larger declines in real estate and mortgage refinancing activity. They would also result in rising mortgage costs for many recent home buyers who have financed expensive home purchases with variable rate mortgages and other loans that must be refinanced after a specified time period. These higher housing-related costs could further squeeze household discretionary incomes, and further depress consumer spending in this state.
High Tech on Rebound
After several soft years, California’s high-tech industries are expanding once again. The increases being experienced are partly due to the national increases in business spending on high-tech goods discussed above. They also reflect a major new cycle of product innovations in the areas of Internet sales and applications. These improvements are resulting in large increases in sales and earnings of major California high-tech firms such as Apple, EBay, Yahoo, and Google. They are also resulting in significant increases in new hiring for the first time since 2000.
The Outlook-Slowing but Still Solid Growth
We project that California’s economy will grow by slightly less than the nation in 2006 and early 2007, before accelerating to a pace which is slightly higher than the national average in 2008 and beyond. Part of the reason for California’s slightly below-average growth rate next year is that post-hurricane rebuilding-which will boost U.S. economic growth by roughly 0.3 percent in 2006-will be concentrated in the southern region of the nation. Specifically, we forecast that:
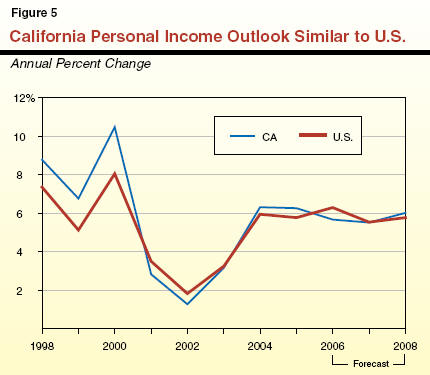
Personal income growth will slow from 6.3 percent in 2005 to 5.7 percent in 2006, and further to 5.5 percent in 2007, before rebounding to roughly 6 percent per year during the balance of the forecast period (see Figure 5). Most of the anticipated modest slowdown in income growth during the next two years is related to tapering activity in the construction and finance-related sectors.
Wage and salary employment growth will slow slightly from 1.4 percent in 2005 to 1.3 percent in 2006, before returning to 1.4 percent in 2007 and remaining in that general range through the forecast period.
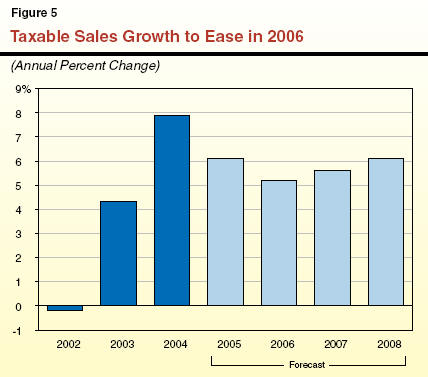
Taxable sales growth will slow from 6.1 percent in 2005 to 5.2 percent in 2006, before partly rebounding to 5.6 percent in 2007. The 2006 slowdown reflects easing of gasoline prices, more modest gains in consumer spending, and declines in residential construction activity (which will adversely affect the taxable sales of building materials).
Permits for new construction are projected to decline from 214,000 this year to 185,000 in 2006, and further to 175,000 by 2008. This slowing is expected to be primarily concentrated in the single-family segment, and is due to the negative impact of projected rising interest rates on home affordability.
Key Risk-Still Higher Energy Costs
The main risk to the U.S. and California economic forecasts continues to be energy prices. Renewed growth in crude and refined energy costs would put more upward pressures on output prices and interest rates, and would further dampen consumer confidence and spending in the months ahead. Such a development would lead to slower near-term growth, particularly in interest-sensitive sectors such as housing. The effects would be especially acute in California, where high housing costs make this state’s real estate and construction industries particularly vulnerable.
The Demographic Outlook
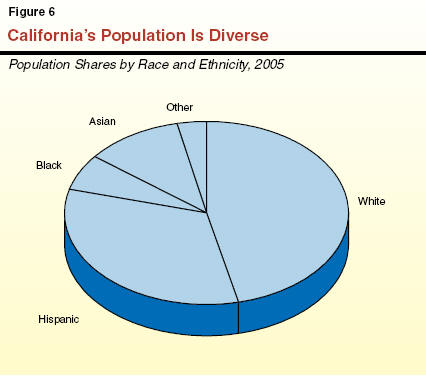
California’s population currently totals over 37 million persons and reflects a diverse ethnic and racial mix (see Figure 6). Figure 7 shows that the state’s population growth is projected to average about 1.4 percent annually over the forecast period. In terms of numbers of people, this annual growth translates into over one-half million people and is roughly equivalent to adding a new city close to the size of Long Beach to California each year. As a result, California will add more than 3.2 million people over the forecast interval and reach over 40 million by 2011.
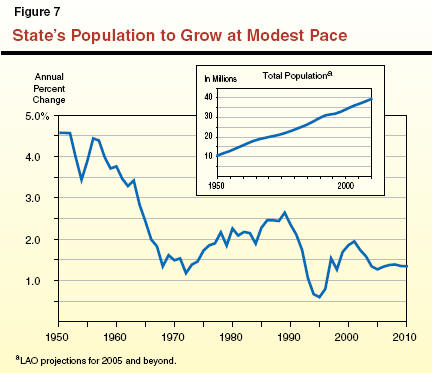
The population growth rate we are projecting is somewhat slower than that experienced in the late 1990s and early 2000s, when growth was averaging about 1.7 percent. This reflects both the dampening effects of the slower economy of recent years on in-migration, plus a continuing downward trend in birth rates.
Population Growth Components
California’s population growth can be broken down into two major components-natural increase (the excess of births over deaths) and net in-migration (persons moving into California from other states and countries, minus those leaving California for out-of-state destinations). On average, these two components have tended in the past to contribute about equally to the state’s population growth. However, their relative shares can vary significantly from one year to the next depending largely on the strength of the net in-migration component-by far the most volatile element.
Natural Increase. We project that the natural-increase component will average over 315,000 new Californians annually over the forecast period. This net natural gain reflects an annual average of around 570,000 births partially offset by about 255,000 deaths.
Our forecast incorporates the well-documented trend of declining birth rates that has been occurring for essentially all ethnic groups in recent years in California. Despite these declining birth rates, however, the number of new births in our forecast actually trends up a bit through 2011. This is due to significant growth in the female population of child-bearing age groups in the faster-growing segments of California’s population, including Hispanic and Asian women. As a result, even after accounting for growth in the number of deaths occurring annually in California, we project that the yearly natural-increase component will grow slightly during the forecast period.
Net In-Migration. We project that combined domestic and foreign net in-migration will average a bit over 220,000 annually over the next six years. This is weaker than during the end of the 1990s and early 2000s when annual net in-migration averaged about 260,000. It also is considerably less than the projected average 315,000 natural-increase component noted above. Regarding this in-migration:
Foreign In-Migration. Most of the net in-migration we are projecting reflects foreign net in-migration from other nations. This component has been relatively stable over the past decade and has proved to be less sensitive to the economy than domestic population flows between states. We forecast that net foreign in-migration will be fairly constant through 2011, averaging about 210,000 annually.
Domestic In-Migration. Regarding domestic net in-migration, preliminary data suggest that this has been modestly negative in 2005 (that is, about 20,000 more people are leaving California this year for other states than flowed in from them). In large part, this is attributable to the lingering impacts of California’s recent recession and such factors as its continued modest job market strength and high housing prices. Given our outlook for moderate expansion of California’s economy, we do not foresee a return to net positive interstate population in-flows until 2007. At that time, net domestic in-flows should total several thousand and rise modestly thereafter, reaching the general range of 20,000 annually by the end of the forecast period.
Growth to Vary Significantly By Age Group
Figure 8 shows our population growth projections by broad age categories, including both numerical and percentage growth. Of special note are the following:
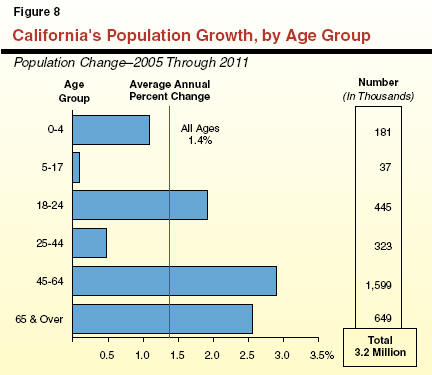
Baby Boomers Swelling. The 45-64 age group (largely, the so-called “baby boomers”) continues to be the fastest growing single segment of the population, both in percentage and numerical terms. This group is projected to expand by nearly 1.6 million people over the forecast period, or an average rate of 2.9 percent annually.
Negligible Growth for School-Age Children. Towards the other extreme, slow growth is anticipated for the K-12 school-age population. This reflects a variety of factors, including the lower rates of recent net domestic in-migration of families with school-age children, reduced birth rates during the late 1990s and early 2000s, and the increasing movement of baby boomers’ children into the college-age category.
Above-Average Growth for the Elderly and College-Age Individuals. Reflecting both the aging of the older baby boomers themselves and the maturing of baby boomers’ children, both of these segments are expected to grow at a faster-than-average pace-2.6 percent and 1.9 percent, respectively.
These various age-group demographic projections can have significant implications for the state’s fiscal outlook, due to their impacts in such areas as school enrollments, health care needs, and the size and characteristics of the labor force.
Revenue Projections
The revenues that finance California’s state General Fund budget come from numerous sources, including taxes, fees, licenses, interest earnings, loans, and transfers. However, over 90 percent of the total is attributable to the state’s “big three” taxes-the personal income tax (PIT), the sales and use tax (SUT), and the corporation tax (CT). In this chapter, we summarize our updated General Fund revenue projections and provide detail behind our key revenue-related assumptions.
Current Revenue Situation
Revenue collections in early 2005-06 are significantly outperforming the estimates contained in the 2005-06 Budget Act. Total General Fund cash receipts through the first four months of this fiscal year are up by over $1.5 billion (6 percent), due to particularly large increases in PIT and CT receipts. We believe that this solid performance will continue through the balance of 2005-06 and into the budget year.
Recent Revenue Trends Strong
In Chapter 2, we indicated that the U.S. and California economies have experienced healthy and broad-based growth in 2005, characterized by robust gains in business earnings. The effects of these developments are evident in the state’s recent revenue trends. Specifically, General Fund cash receipts from each of the major taxes are up significantly from the prior year. The largest increases are related to quarterly estimated payments made by taxpayers filing under the CT and the PIT.
Corporate Estimated Payments-Doing Extremely Well. As indicated in Figure 1, quarterly estimated tax payments made by companies filing under the CT were up by nearly 30 percent from one year earlier in the third quarter of this year. These payments are attributable to companies in a wide variety of industries, but they particularly involve oil refining, utilities, telecommunications, financial services, and manufacturing.
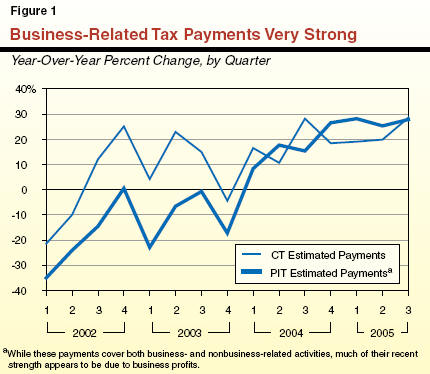
PIT Estimated Payments-Also Strong. The growth in PIT quarterly payments was up a similar amount during the most recent quarter. While we do not have any detailed payment information for these PIT receipts, we believe that much of the growth in this source is also due to robust gains in business earnings subject to the PIT. This includes the profits of business entities that themselves are directly taxed under the PIT (such as partnerships, sole proprietorships, and certain limited liability companies). It also includes the profits from corporations that are taxed directly under the CT but that also flow through to be taxed under the PIT, such as distributions to shareholders and the pass-through income of Subchapter S corporations.
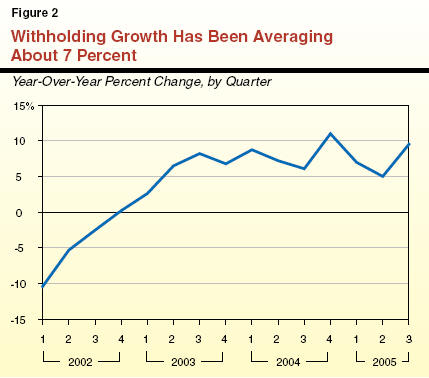
Other Tax Payments-Healthy Too. Tax receipts other than PIT and CT estimated payments are growing at a more moderate, but still healthy, rate in 2005. As indicated in Figure 2, withholding payments, which are related to the wages, bonuses, and stock options received by individuals, have experienced fluctuating growth rates in recent quarters, but nevertheless are growing in the general range of 7 percent in 2005. Likewise, SUT receipts have been growing in the range of 6 percent to 7 percent during the same period.
The LAO Revenue Forecast
Figure 3 and Figure 4 present our updated revenue projections for the period 2004-05 through 2010-11. Figure 3 shows our revenue estimates for the prior year (2004-05) and current year (2005-06), and compares them to the projections assumed when the 2005-06 budget was adopted this past summer. Figure 4 shows our revenue projections for the entire forecast period, ending in 2010-11.
|
Figure 3 Revised LAO Revenues
for 2004‑05 and 2005‑06 |
|||||||
|
(In Millions) |
|||||||
|
|
2004‑05 |
|
2005‑06 |
||||
|
Revenue Source |
Budget |
LAO |
Difference |
|
Budget |
LAO |
Difference |
|
Major Taxes: |
|
|
|
|
|
|
|
|
Personal Income Tax |
$42,032 |
$42,856 |
$824 |
|
$43,230 |
$45,300 |
$2,070 |
|
Sales and Use Tax |
25,233 |
25,495 |
262 |
|
26,951 |
27,140 |
189 |
|
Corporation Tax |
7,674 |
7,539 |
-135 |
|
8,821 |
9,400 |
579 |
|
Insurance Tax |
2,212 |
2,232 |
20 |
|
2,300 |
2,340 |
40 |
|
Other major taxes |
673 |
706 |
33 |
|
456 |
451 |
-5 |
|
Subtotals, major taxes |
($77,824) |
($78,829) |
($1,005) |
|
($81,758) |
($84,632) |
($2,874) |
|
Other Sources: |
|
|
|
|
|
|
|
|
Interest income |
$203 |
$232 |
$29 |
|
$357 |
$450 |
$93 |
|
Minor revenues |
1,669 |
1,660 |
-10 |
|
2,147 |
2,244 |
97 |
|
Transfers/loans |
239 |
239 |
— |
|
209 |
-47 |
-256 |
|
Total Revenues and Transfers |
$79,935 |
$80,959 |
$1,024 |
|
$84,471 |
$87,279 |
$2,808 |
|
Figure 4 The LAO’s General Fund Revenue Forecast |
|||||||
|
(Dollars in Millions) |
|||||||
|
Revenue Source |
2004‑05 |
2005‑06 |
2006‑07 |
2007‑08 |
2008‑09 |
2009‑10 |
2010‑11 |
|
Personal Income Tax |
$42,856 |
$45,300 |
$48,000 |
$51,370 |
$54,820 |
$58,730 |
$62,740 |
|
Sales and Use Tax |
25,495 |
27,140 |
28,288 |
30,073 |
31,898 |
33,893 |
35,963 |
|
Corporation Tax |
7,539 |
9,400 |
9,650 |
10,270 |
11,020 |
11,810 |
12,560 |
|
Other revenues and transfers |
5,069 |
5,438 |
5,138 |
4,888 |
5,118 |
4,962 |
5,515 |
|
Total Revenues and Transfers |
$80,959 |
$87,279 |
$91,076 |
$96,601 |
$102,856 |
$109,395 |
$116,778 |
|
(Percentage Change) |
8.2% |
7.8% |
4.4% |
6.1% |
6.5% |
6.4% |
6.7% |
Prior-Year Revenues-Up $1 Billion. Based on preliminary agency revenue reports for 2004-05, we estimate that revenues and transfers totaled $81 billion during the year. As Figure 3 shows, this is up $1 billion from the estimate assumed in the 2005-06 Budget Act. Of this gain, PIT revenues were up $824 million, SUT was up $262 million, and all other sources combined were down $63 million. The large increase in prior-year receipts reflects a variety of factors, including the accrual of stronger-than-expected cash payments received early this fiscal year back to 2004-05. A second factor is an upward adjustment to the expected amount of audit collections during the 2005-06 fiscal year, which under California’s accounting system, will be accrued back to 2004-05.
2005-06 Revenues-Up $2.8 Billion. We project that revenues and transfers will total $87.3 billion in 2005-06, a 7.8 percent increase from
2004-05. Our revised estimate is up $2.8 billion from the estimate contained in the 2005-06 Budget Act. As Figure 3 shows, this difference consists of a $2.1 billion increase in the PIT, a slightly under $600 million increase in CT, a nearly $200 million increase in SUT, and more modest upward adjustments to interest earnings and other sources. A partially offsetting factor in 2005-06 concerns the sale assumed in the budget of pension obligation bonds. Specifically, due to legal delays, we have assumed the sale is delayed by one year. This shift will result in a $252 million reduction in revenues in 2005-06 and a corresponding increase in
2006-07 revenues.
2006-07 Revenues-Modest Growth. As shown in Figure 4, we forecast that total revenues and transfers will be $91.1 billion in 2006-07, a 4.4 percent increase from the current year. This relatively modest growth rate reflects the projected economic slowdown in 2006 as well as several other factors. For example, our estimate assumes a resumption in certain sales tax transfers (so-called “spillover payments”) from the General Fund to the Public Transportation Account (PTA). This transfer was suspended in the current year but a portion will again occur in 2006-07 and reduce General Fund SUT revenues by slightly over $300 million in that year. Other factors include: (1) the resumption of the teachers’ tax credit, which will lower PITs by about $200 million, and (2) a drop in nontax-related revenues of $500 million. The decline in such nontax revenues is partly due to a one-time increase of $525 million in 2005-06 related to the refinancing of tobacco bonds. Absent these special factors, “underlying” revenues are expected to increase by a moderately stronger rate of 5.7 percent.
2007-08 Through 2010-11. We project that total revenues will increase at an average annual rate of 6.4 percent over this four-year span, or slightly faster than the 6 percent average growth in personal income during the period. For this interval, we are projecting that PIT revenues will grow moderately faster than the overall economy, reflecting the interaction of rising real incomes with California’s progressive PIT rate structure. The remaining revenue sources are forecast to grow slightly more slowly than statewide personal income.
The annual revenue increases throughout the forecast period are being affected by several factors apart from the state’s underlying economy. These include ongoing refunds of protective claims payments associated with the recent tax amnesty program (see below), repayments of outstanding loans from special funds, and diminishing amounts of spillover transfers of sales taxes from the General Fund to the PTA (which are expected to occur as gas prices subside).
|
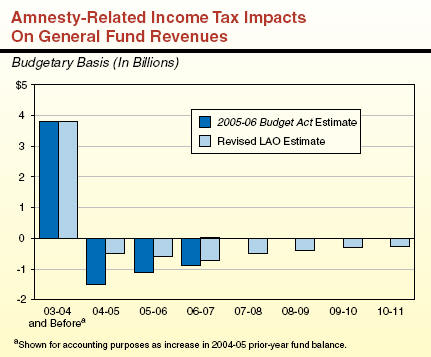
Tax Amnesty Program The recent tax amnesty program had a major impact on the pattern of revenue collections for the state’s PIT and CT. (For a more detailed discussion of the amnesty program, which ran from February 1, 2005 to March 31, 2005 and covered tax years preceding 2003, see our report entitled California Spending Plan 2005-06.) The amnesty program resulted in an increase in General Fund receipts totaling $3.8 billion in 2004-05. Under California’s system of accrual accounting, these receipts were reflected as a $3.8 billion upward adjustment to the state’s carry-in balance for the 2004-05 fiscal year. What Did the Payments Represent? About one-fifth of the payments received related to amnesty was attributable to the program’s voluntary participants, while the remaining four-fifths was attributable to companies that chose not to participate in the amnesty program but still chose to file so-called “protective claim” payments. The latter are payments made by these taxpayers to avoid the possibility of being charged high post-amnesty penalties if their outstanding tax challenges are not ultimately upheld, or if they receive future audit assessments related to past tax years. Most of the Receipts Will Be “Given Back” The great majority of the payments received were expected to be offset by lower net collections in the future. For example, based partly on estimates the Franchise Tax Board (FTB) made last May, it was assumed that all but $380 million of the $3.8 billion gain represents either tax payments that will eventually be refunded (which will occur in those cases where the taxpayers prevail in their audit disputes), or accelerations of collections that would have otherwise been received in future years through the normal audit process. It was specifically assumed that these refunds and accelerations would reduce net personal income tax and corporation tax collections by $1.5 billion in 2005-06, $1 billion in 2006-07, and $900 million in 2007-08. Under the state’s accrual accounting system, these annual reductions would be accrued back to the respective preceding years. As a result, the accompanying figure shows that it was assumed that amnesty-related revenue reductions would occur in the 2004-05 through 2006-07 fiscal years. Net Gain Assumed From Amnesty-Still $380 Million Based on recent monthly payment and refund data, as well as conversations with FTB staff, we are currently assuming that the offsetting amnesty-related reductions assumed in the 2005-06 Budget Act will take longer to occur than we earlier thought. Specifically, we now estimate that the annual reductions will climb from $500 million in 2004-05 to a peak of $750 million in 2006-07, before subsiding over the following four years. However, we have not materially changed our view about how much of the amnesty-related gain will ultimately prove to be permanent-roughly $380 million. All of these amnesty-related estimates remain subject to future revision as the FTB closes out more cases involving protective claims payments.
|
Detail On Individual Revenue Sources
Personal Income Tax
The PIT collections will finally surpass their 2000-01 peak in 2005-06, reaching $45.3 billion during the year. The current estimate for 2005-06 represents a 5.7 percent increase from 2004-05, and is nearly $2.1 billion above the 2005-06 Budget Act estimate. We project that PIT revenues will grow further to $48 billion in 2006-07, representing a 6 percent increase from the current year, and at an average annual rate of 6.9 percent during the balance of the forecast period.
Key Forecast Factors. As indicated above, the main factor responsible for our upward revision of General Fund revenues is ongoing strength in business-related income, which is currently boosting quarterly estimated PIT payments. We expect that, while future growth in business earnings will slow, the higher payment trend will persist through at least 2005-06 and somewhat beyond.
In contrast to the two previous years, we do not expect capital gains and stock options to be a major source of PIT revenue growth in 2005-06. This is because the stock market has been relatively flat this year-in stark contrast to 2003 and 2004, when market values were up substantially. Capital gains associated with real estate sales will experience much stronger growth. However, since less than one quarter of total capital gains is related to real estate activity, growth in total capital gains will remain relatively modest.
Overall, we project that capital gains income will be up around 7 percent in 2005-06, with most of the increase due to real estate activity. By comparison, stock option income is projected to remain flat during the year.
In subsequent years, we project that income from combined capital gains and stock options will grow at a moderate annual pace of 6 percent to 7 percent per year, reflecting strong growth in the real estate segment and moderate growth in stock values.
Sales and Use Taxes
We estimate that SUT receipts will total $27.1 billion in 2005-06, a 6.5 percent increase from 2004-05. Our current forecast is up by $189 million from the 2005-06 Budget Act. We project that SUT receipts will grow further to $28.3 billion in 2006-07, and at an average annual rate of 6.2 percent during the balance of the forecast period.
Key Forecast Factors. The main determinant of SUT receipts is taxable sales. About two-thirds of these sales are related to retail spending by consumers, while the remainder is related both to building materials that go into new construction and to business-to-business transactions.
We estimate that taxable sales grew by slightly more than 6 percent during the first three quarters of calendar-year 2004, based on the most recent taxable sales data available. While this represented a modest slowdown from the 7.9 percent rate for all of 2003, the over 6 percent increase still represents a reasonably healthy rate. We do not yet have any detail on the composition of taxable sales for 2005. However, various indicators suggest that the increases reflect a variety of factors. These include the extraordinary increases in gasoline and diesel fuel prices, as well as ongoing strength in the home construction, business investment, and consumer spending sectors in this state.
As indicated in Chapter 2, we expect gasoline prices to fall from current levels, and that consumer spending and residential building activity will slow beginning in 2006. Although this slowing will be partly offset by healthy gains in business investment, we expect taxable sales growth to still slow to about 5.2 percent in 2006 and 5.6 percent in 2007 (see Figure 5). In subsequent years, we forecast that taxable sales growth will partly rebound to a trend rate of around 6 percent for the balance of the forecast period.
Corporation Taxes
We estimate that CT receipts will increase from roughly $7.5 billion in 2004-05 to $9.4 billion in 2005-06. Following this, we forecast that CT receipts will grow only modestly in 2006-07, but then will increase at an average annual rate of 6.8 percent during the remaining four years of the forecast.
Key Forecast Factors. Two categories of factors are of special importance in our updated forecast of CT receipts:
Corporate Profits. The single most important factor underlying CT receipts is California taxable corporate profits. After jumping 20 percent in 2004, strong estimated CT payments that have been received this year suggest that business earnings are up another 23 percent in 2005. These large increases reflect major gains in a variety of industries, including utilities, oil refining, finance, and construction. Recent gains may also be partly due to the repatriation of foreign earnings made by companies in response to recent federal law changes. These changes provide for taxing repatriated earnings (that is, earnings from foreign operations which are brought into the U.S.) at a special reduced federal rate of 5.25 percent (instead of the normal rate of 25 percent on repatriated earnings). For 2006 through the remainder of the forecast period, we project that profits will grow at a much-less-robust average rate of 6 percent per year. Ongoing productivity growth and expanding markets both in the U.S. and abroad are positive factors in the longer-term outlook. However, we expect some of the cyclical sources of recent earnings growth, such as extraordinary profits from oil production and refining, and strong financial earnings from the robust sales and financing of homes, to subside in the years ahead.
Tax Amnesty. The second major factor is the effect of the recent tax amnesty program. This program resulted in a major increase in tax payments in 2004-05 that were accrued back to 2003-04, but is expected to result in decreases in net collections in subsequent years. (See the accompanying box for additional discussion of the amnesty program.)
Other Revenues, Transfers, and Loans
This category encompasses all remaining General Fund revenue sources. It includes taxes on insurance premiums, alcoholic beverages, estates, and cigarette distributions. It also includes various fees, interest on investments, asset sales, pension bond proceeds, as well as loans and transfers from special funds.
Revenues from this category are expected to vary within a range of $4.9 billion to $5.5 billion over the forecast period. Their underlying growth rate is assumed to be roughly 2 percent per year, reflecting a mixture of moderate gains and reductions in various tax sources. Special factors in the outlook include the one-time refinancing of tobacco bonds in 2005-06, a one-time sale of pension bonds in 2006-07, and scheduled repayments of outstanding loans from special funds in various years.
Expenditure Projections
In this chapter, we discuss our General Fund expenditure estimates for 2004-05 and 2005-06, as well as our projections for 2006-07 through 2010-11. Figure 1 shows our forecast for major General Fund spending categories. We first look at general budgetary trends and then discuss in more detail our expenditure projections for individual major program areas.
|
Figure 1 Projected General Fund Spending for Major Programs |
|||||||||
|
(Dollars in Millions) |
|||||||||
|
|
Estimated |
|
Forecast |
Average Annual Growth From 2005‑06 |
|||||
|
|
2004‑05 |
2005‑06 |
|
2006‑07 |
2007‑08 |
2008‑09 |
2009‑10 |
2010‑11 |
|
|
Education programs |
|
|
|
|
|
|
|
|
|
|
K-14—Proposition 98 |
$33,971 |
$36,213 |
|
$38,216 |
$39,627 |
$42,056 |
$44,898 |
$47,797 |
5.7% |
|
CSU |
2,419 |
2,553 |
|
2,659 |
2,765 |
2,877 |
2,989 |
3,097 |
3.9 |
|
UC |
2,583 |
2,700 |
|
2,803 |
2,905 |
3,013 |
3,119 |
3,214 |
3.5 |
|
Health and Social Services |
|
|
|
|
|
|
|
|
|
|
Medi-Cal |
11,533 |
12,956 |
|
14,078 |
14,977 |
15,633 |
16,351 |
17,206 |
5.8 |
|
CalWORKs |
2,095 |
1,985 |
|
2,621 |
2,461 |
2,587 |
2,719 |
2,852 |
7.5 |
|
SSI/SSP |
3,417 |
3,564 |
|
3,685 |
3,930 |
4,207 |
4,489 |
4,796 |
6.1 |
|
IHSS |
1,174 |
1,232 |
|
1,337 |
1,448 |
1,565 |
1,688 |
1,817 |
8.1 |
|
Developmental Services |
2,122 |
2,273 |
|
2,476 |
2,669 |
2,921 |
3,195 |
3,513 |
9.1 |
|
Other major programs |
4,356 |
4,727 |
|
4,878 |
5,035 |
5,082 |
5,473 |
5,700 |
3.8 |
|
Corrections and |
6,467 |
6,991 |
|
7,355 |
7,622 |
7,876 |
8,129 |
8,382 |
3.7 |
|
VLF-related payments |
— |
1,187 |
|
— |
— |
— |
— |
— |
— |
|
Proposition 42-related |
— |
1,316 |
|
1,385 |
2,765 |
2,464 |
1,639 |
1,675 |
4.9 |
|
Debt service on bonds |
3,565 |
3,926 |
|
4,331 |
4,846 |
5,295 |
5,713 |
6,061 |
9.1 |
|
Other programs/costs |
7,810 |
8,537 |
|
9,286 |
9,868 |
10,307 |
10,713 |
11,269 |
5.7 |
|
Totals |
$81,512 |
$90,161 |
|
$95,111 |
$100,917 |
$105,883 |
$111,114 |
$117,380 |
5.4% |
|
(percentage change) |
6.8% |
10.6% |
|
5.5% |
6.1% |
4.9% |
4.9% |
5.6% |
— |
|
|
|
|
|
|
|
|
|
|
|
|
|
|||||||||
|
a Includes employee compensation costs. |
|||||||||
General Fund Budget Trends
2006-07 Outlook
We forecast that General Fund expenditures will grow from $90.2 billion in 2005-06 to $95.1 billion in 2006-07, an increase of 5.5 percent. Among major programs, we expect above-average growth rates in various health and social services areas, and below-average increases in higher education and the Supplemental Security Income/State Supplementary Program. General Fund spending on Proposition 98 is expected to increase at the same pace as overall growth. The Proposition 98 increase is partly due to the end of the two-year diversion of property taxes from local governments to schools (which results in a $1.3 billion increase in General Fund Proposition 98 spending) and additional spending for Proposition 49 after-school programs.
Expenditure Growth During Forecast Period
Moderate Total Growth Projected. The right-hand column of Figure 1 shows our projected average annual growth rates for major programs from 2005-06 through 2010-11. We forecast that total spending will increase by an average annual rate of 5.4 percent over the period, or slightly less than statewide personal income growth. This average growth rate, however, masks divergent trends among the different individual program areas that make up the total. Annual spending totals within the final four years of the forecast period are affected by loan repayments to transportation special funds, making year-to-year comparisons difficult.
Highlights for Individual Program Areas. With regard to some of the major individual program areas in the budget, the figure shows that:
K-14 Proposition 98 (General Fund) spending is projected to increase steadily at an average annual rate of 5.7 percent throughout the forecast period. For the latter three years of our forecast, slowing K-12 school enrollments and healthy growth in local property taxes trigger a Proposition 98 formula (“Test 1”) that requires a fixed percentage of General Fund revenues be spent on K-14 education. This leads to average annual increases of 6.4 percent in General Fund K-14 spending levels in those years.
University of California (UC) and California State University (CSU) are forecast to grow at an average annual rate of 3.7 percent (combined), reflecting full funding of projected enrollment and inflation.
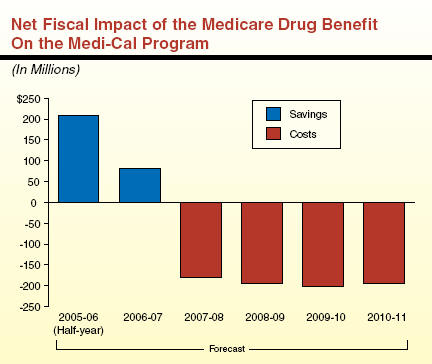
Medi-Cal local assistance is are projected to grow at an average annual rate of 5.8 percent. This reflects continued increases in caseload costs and utilization of medical services, as well as various one-time changes in program costs. Our estimates also take into account the fiscal effects of the new Medicare prescription drug benefit, which initially results in significant net savings but generates net costs later in the forecast period.
California Work Opportunity and Responsibility to Kids (CalWORKs) spending is projected to increase by an average of 7.5 percent over the forecast period. This significant increase reflects the combined effects of COLA costs (including retroactive payments for the October 2003 cost-of-living adjustment (COLA) stemming from the Guillen court case), inflationary adjustments for county administrative allocations, and the exhaustion of federal carry-over funds to support program spending.
Supplemental Security Income/State Supplementary Program (SSI/SSP) spending is projected to increase at an average annual rate of 6.1 percent, reflecting statutory COLAs and moderate growth in caseloads during the forecast period.
In-Home Supportive Services (IHSS) spending is projected to increase at an average annual rate of 8.1 percent. This rapid growth reflects both increases in caseloads and service hours, as well as wage increases for IHSS workers.
Department of Developmental Services (DDS) is projected to increase at an average annual rate of 9.1 percent over the period, reflecting continued increases in caseloads and the cost-per-client served by the state’s 21 Regional Centers.
Department of Corrections spending is forecast to increase at an average annual rate of 3.7 percent over the forecast period. The growth during this period takes into account the final year of pay increases related to the Unit 6 bargaining agreement approved in 2001, health care costs, as well as modest growth in the prison inmate population.
Debt-service expenses for general obligation and lease-revenue bonds are projected to increase at an average annual rate of 9.1 percent, primarily reflecting annual sales of somewhat over $6 billion in currently authorized General Fund-supported debt for capital outlay purposes.
In the sections that follow, we provide a more detailed discussion of the expenditure outlook for these and other individual major program areas.
Proposition 98-K-14 Education
State spending for K-14 education (K-12 schools and community colleges) is governed largely by Proposition 98, passed by the voters in 1988. Proposition 98 is funded from the state General Fund and local property taxes, and accounts for about three-fourths of total support for K-14 education. The remainder is from a variety of sources including non-Proposition 98 General Fund, federal funds, lottery revenue, community college fee revenues, and other local revenues. Generally, the Proposition 98 guarantee is increased annually by the growth in K-12 pupil attendance and the growth in the economy.
California’s public K-12 education system consists of more than 1,000 locally governed school districts and county offices of education serving about 6.3 million K-12 students. In addition, these entities serve infants and preschool students receiving child care and individuals in adult education programs. The California Community Colleges (CCC) provides instruction to about 1.1 million full-time equivalent students at 109 colleges operated by 72 locally governed districts.
The Spending Forecast
Figure 2 displays our projections of the Proposition 98 minimum guarantee-as well as its General Fund and local property tax funding components-throughout the forecast period. The forecast shows steady increases in the minimum guarantee-between $2.2 billion and $4.2 billion in annual growth. In 2006-07, most of the increase in K-14 costs will be funded with General Fund revenues, due to the end of a two-year shift of property taxes from local governments to schools (see nearby box). Starting in 2008-09, Proposition 98 spending grows more rapidly. This additional growth is related to the transition of the Proposition 98 formulas from its historic driver-per capita personal income growth (Test 2)-to using a formula which guarantees a fixed portion of General Fund revenues (Test 1). Under Test 2, the General Fund costs of Proposition 98 are offset by growth in local property tax revenue, creating savings for the state. Under Test 1, K-14 spending remains a fixed percentage of General Fund revenues regardless of property tax levels. So, once Test 1 becomes operative, schools benefit from strong property tax growth as well as their share of General Fund revenues.
|
Figure 2 The LAO Proposition 98 Forecast |
|||||||
|
(In Billions) |
|||||||
|
|
2005-06 |
|
|
|
|
|
|
|
|
Budget Act |
Revised |
2006-07 |
2007-08 |
2008-09 |
2009-10 |
2010-11 |
|
Proposition 98 |
|
|
|
|
|
|
|
|
General Fund |
$36.6 |
$36.2 |
$38.2 |
$39.6 |
$42.1 |
$44.9 |
$47.8 |
|
Local property tax |
13.4 |
13.6 |
13.8b |
15.0 |
16.2 |
17.5 |
18.8 |
|
Totals |
$50.0 |
$49.8a |
$52.0c |
$54.6 |
$58.3 |
$62.4 |
$66.6 |
|
Growth |
— |
— |
$2.2 |
$2.6 |
$3.6 |
$4.1 |
$4.2 |
|
|
|||||||
|
a Reduced slightly due to lower-than-anticipated attendance. |
|||||||
|
b The two-year diversion of local property tax revenues from local governments to schools ends after 2005-06, reducing growth in property tax revenues. |
|||||||
|
c This estimate
includes the Proposition 98 minimum guarantee, plus an appropriation
of $428 million to fund Proposition 49. As shown in |
|||||||
|
Impact of the 2004-05 Property Tax Shifts On Proposition 98 As part of the 2004-05 budget package and the implementation of Proposition 57’s deficit financing bonds, the state authorized several transfers of local property tax revenues between schools (K-12 school districts and community colleges) and local governments (cities, counties, redevelopment agencies, and special districts). The figure below shows that starting in 2004-05 the state transferred a net of $3.9 billion in local property tax revenues from schools to local governments. These transfers will increase to $6.8 billion in 2006-07, and then grow steadily thereafter. These local property tax transfers are backfilled by the state providing additional General Fund revenues to schools to meet the Proposition 98 spending levels for those years.
|
|||||||||||||||||||||||||||||||||||||||||||||||||||||||||||||||||
Forecast for the Prior Year. While the state received approximately $1 billion more in General Fund revenues in 2004-05 than was assumed in the 2005-06 budget package, the state has no additional Proposition 98 obligations for that year because the Proposition 98 minimum guarantee was suspended for 2004-05. In fact, because of slightly lower-than-expected K-12 attendance, we estimate that Proposition 98 spending for 2004-05 decreased by around $35 million.
Forecast for the Current Year. We estimate that Proposition 98 spending will be approximately $150 million less in 2005-06 compared to the 2005-06 budget package due to lower-than-expected K-12 attendance. Specifically, we estimate that there are around 40,000 less students than what was estimated when the 2005-06 budget package was adopted (decreasing the year-to-year growth rate from 0.7 percent to 0.2 percent). This will automatically reduce K-12 revenue limit spending for 2005-06 by about $150 million, lowering the Proposition 98 minimum guarantee by an equivalent amount. The costs of many K-12 categorical programs will be similarly reduced, but in order to realize these savings, the Legislature would need to take action to reduce the categorical appropriations. The $150 million in savings from lower K-12 attendance, coupled with higher-than-expected local property taxes ($225 million), result in a reduction of $375 million in the General Fund costs of meeting the Proposition 98 spending level in 2005-06. The increase in local property tax revenues is the result of higher-than-expected underlying growth in assessed property values, and technical adjustments made in transfers to local governments.
When the Legislature adopted the 2005-06 budget, K-14 spending was $741 million above the Proposition 98 minimum guarantee. We now estimate that General Fund revenues have increased around $1 billion in 2004-05 and $2.8 billion in 2005-06. While this results in a higher minimum guarantee for 2005-06, estimated 2005-06 spending is still $65 million above this revised guarantee amount. Our forecast assumes that the Legislature will continue the higher spending level. The Legislature, however, could act to reduce appropriations in the current year, especially for categorical programs that have experienced reduced costs because of the lower K-12 and CCC attendance for 2005-06. This would generate additional General Fund savings for 2005-06.
Forecast for the Budget Year. We project that the Proposition 98 minimum guarantee will grow by $1.8 billion in 2006-07. This year-to-year change is less than that experienced in 2005-06 because of moderate revenue and economic growth, combined with little to no growth in K-12 attendance. In addition, Proposition 49, the After School and Safe Neighborhood program, requires the state to add $428 million to the minimum guarantee (see box below). That additional funding must be spent on before and after school programs. Meeting the Proposition 49 obligation results in a total increase in required K-14 funding of $2.2 billion (4.5 percent) in 2006-07. Almost all of this increase will be supported by increased General Fund revenues. Below, we discuss the difficulty the state will face in the 2006-07 budget because the growth in the minimum guarantee is not sufficient to meet the attendance growth and COLA obligations for K-14 education.
|
Proposition 49 Likely to Trigger in 2006-07 Approved by voters in 2002, Proposition 49 requires that the state appropriate additional funding for after school programs if certain conditions are met. Specifically, the state must appropriate an additional $428 million for after school programs if state spending reaches a specified threshold, or “trigger.” This funding must be appropriated above the Proposition 98 minimum guarantee. Based on our revenue and expenditure forecast, the state will likely be required to provide this additional funding for after school programs in 2006-07. The additional costs of funding Proposition 49 are factored into the Proposition 98 growth estimates in Figure 2 starting in 2006-07. The Proposition 49 trigger funding level is determined by (1) establishing a base year between 2000-01 and 2003-04 in which the “nonguaranteed General Fund appropriation” level was the highest and (2) adding $1.5 billion to that base year funding level. Based on our estimates, the trigger appropriation amount is $54.6 billion. Ultimately, whether Proposition 49 triggers in the budget year will depend on the actual level of nonguaranteed General Fund appropriations the Legislature makes in the 2006-07 Budget Act. Under our estimates, however, we believe it is likely that Proposition 49 will trigger in 2006-07. For instance, if the state increased General Fund spending by just 2.5 percent in the budget year, the trigger would be pulled. (By comparison, the average annual growth in General Fund spending over the past two years has been over three times that rate.) In the Analysis of the 2005-06 Budget Bill, we recommended repealing Proposition 49 because it (1) triggers autopilot augmentations even though the state is facing a significant budget problem, (2) the additional resources targeted for after school programs could be better spent protecting districts’ base education programs, and (3) existing state and federal after school funds are going unused. We continue to have these concerns. Given that the 2006-07 growth in the Proposition 98 minimum guarantee is not sufficient to meet growth and cost-of-living adjustment of the base program, we suggest the Legislature consider repealing the measure, delaying its implementation or staging the added Proposition 49 augmentations over a multiyear period. (These changes would have to be approved by the Legislature and Governor in time to be placed before the voters at the June 2006 primary election.) The Legislature may also want to carefully review the current after school program to evaluate whether the program can be improved prior to expansion. |
Out-Years’ Forecast. For the remainder of the forecast period, we estimate that annual growth in total Proposition 98 spending will average $3.6 billion (6.4 percent). Strong property tax growth will help reduce the impact on the state budget in 2007-08. However, because of the switch to Test 1 starting in 2008-09, Proposition 98 General Fund spending grows proportionately with General Fund revenues thereafter at a rate of 5.8 percent annually.
Why Is the State Headed Toward Test 1 Years in the Near Future? To date, the Test 1 factor, where Proposition 98 receives a fixed percentage of General Fund revenues, has been operative only in 1988-89, the first year after Proposition 98 was passed by the voters. Test 2 funding quickly moved Proposition 98 General Fund spending above the Test 1 funding level in the early 1990s because of (1) the recession’s impact on General Fund revenues and (2) strong K-12 attendance growth (averaging 2.3 percent annually during the 1990s). Proposition 98 spending has remained well above the Test 1 requirement since that time.
There are three main factors that contribute to Test 1 becoming operative again in the forecast period:
Slow-to-No K-12 Attendance Growth. The K-12 attendance growth has slowed in recent years (averaging 1.2 percent over the last five years) and will remain relatively flat in the near future. This has had the effect of lowering the General Fund’s Proposition 98 obligation under Test 2 relative to Test 1.
Strong Local Property Tax Growth. We project local property tax revenue growth between 7.4 percent and 11 percent annually over the forecast period. Since additional property tax revenues reduce the amount of General Fund monies spent on Proposition 98 under Test 2, this closes the gap between the two tests.
The Impact of the 2004-05 Suspension. The suspension of Proposition 98 in 2004-05, had the effect of lowering the state’s Test 2 General Fund obligation by about $4 billion annually. This had a significant role in bringing Test 1 “back into play.”
In combination, these three factors have reduced the K-14 share of the General Fund under Test 2, thereby triggering Test 1. After Test 1 becomes operative, it is likely to remain the operative test for the near future.
Risks in the Fiscal Forecast. There are two important uncertainties that could significantly change the outcomes of our Proposition 98 forecast:
Adjustments to General Fund Revenue Growth. A key factor in determining the state’s Proposition 98 obligations is year-to-year growth in General Fund revenues. This factor is subject to change, due both to (1) the inherent volatility of the state’s main revenue sources and (2) special factors (such as unanticipated receipts and refunds stemming from the recent tax amnesty program). If, for example, $200 million in revenues we forecast will be received in 2004-05 is instead scored in 2005-06, the state would face a large Proposition 98 settle-up obligation in the current year and added base spending for future years.
Rebenching Test 1 for Property Tax Transfers. There is no statutory guidance on how to rebench the Test 1 requirement for changes in local government property tax transfers. (See earlier box for the net amount of these transfers for each year of the forecast period.) The method used to make this calculation is important because each 0.1 percent difference in the rate translates into roughly a $100 million difference in the minimum guarantee.
Key Forecast Factors. General Fund expenditures for Proposition 98 depend on a variety of factors-including K-12 average daily attendance (ADA), per capita personal income, per capita General Fund revenues, and local property taxes. Figure 3 summarizes our assumptions for these factors and the K-12 COLA rate.
|
Figure 3 The LAO Proposition 98 Forecast Factors |
||||||
|
|
2005‑06 |
2006‑07 |
2007‑08 |
2008‑09 |
2009‑10 |
2010‑11 |
|
Proposition 98 "Test" |
2 |
2 |
2 |
1 |
1 |
1 |
|
Share of General Fund Revenues |
|
|
|
|
|
|
|
Projected |
42.6% |
42.8% |
41.7% |
41.6% |
41.6% |
41.6% |
|
Test 1a |
40.1 |
41.6 |
41.6 |
41.6 |
41.6 |
41.6 |
|
Annual Percent Change |
|
|
|
|
|
|
|
K-12 average daily attendance |
0.2% |
-0.1% |
— |
— |
— |
0.1% |
|
Per capita personal income (Test 2) |
5.3 |
3.6 |
4.0% |
4.5% |
4.6% |
4.6 |
|
Per capita General Fund |
5.9 |
3.5 |
5.1 |
5.0 |
5.3 |
5.0 |
|
State population |
1.5 |
1.4 |
1.4 |
1.4 |
1.4 |
1.4 |
|
Local property taxesb |
11.0 |
10.5 |
8.4 |
7.9 |
7.4 |
7.4 |
|
K-12 COLA |
4.2 |
5.2 |
3.2 |
2.8 |
2.7 |
2.7 |
|
|
||||||
|
a LAO estimates for Test 1 factor, as adjusted due to transfers of local property tax revenues between schools and local governments. |
||||||
|
b Growth rates reflect the underlying growth in school districts and community colleges property tax revenues. Due to shifts discussed in the nearby box, growth in the amount of property tax revenues schools will actually receive is significantly less in 2005‑06 (5.2%) and 2006‑07 (1.6%). |
||||||
For our forecast:
The minimum share of the General Fund that is guaranteed to K-14 education (Test 1) is adjusted upward in 2005-06 and 2006-07 to account for the additional transfers in local property tax revenues from schools to local government. This adjustment is important because Test 1 becomes operative starting in 2008-09 under our forecast.
We assume that K-12 ADA will remain relatively flat for the next several years (see Figure 4).
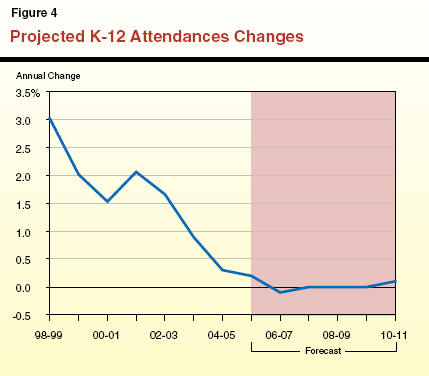
We forecast California per capita personal income growth will be 3.6 percent in 2006-07, and average 4.4 percent annually thereafter. Similarly, we project per capita General Fund revenue growth of 3.5 percent in 2006-07 accelerating to average 5.1 percent for the remainder of the forecast.
Underlying local property tax revenue growth will be 10.5 percent in 2006-07. However, K-14 education will only experience a 1.6 percent increase in these revenues because of transfers in property tax revenues from schools to local government. In the remainder of the forecast period, property tax revenue growth will remain strong, averaging 7.8 percent annually.
The K-12 statutory COLA for 2006-07 is projected to be 5.2 percent. This COLA is based on the federally calculated state and local price deflator. This index has shown large price increases in the fall of 2005 largely related to the rise in energy costs and other impacts resulting from the recent hurricanes. While schools may have experienced some increase in energy costs-natural gas for heating and fuel for transportation-the size of the statutory COLA may overstate the actual cost increases that K-14 schools will face. For the remainder of the forecast period, the K-12 COLA will average 2.8 percent annually.
Proposition 98 Cost Pressures
2006-07 Required Increase Would Not Fund Growth and COLA. Figure 5 shows the growth in the minimum guarantee (including funding of Proposition 49) throughout the forecast period and spending increases required each year to maintain the K-14 base program. The figure shows that for 2007-08 through 2010-11, schools would have funds far in excess of the amounts needed to maintain the base program. These funds could be used to pay off current obligations to schools (such as deferrals and mandate costs) and still allow for significant program expansions. The figure also shows however, that the increase in Proposition 98 resources in 2006-07 will not be sufficient to maintain the base K-14 education program. Given the costs of providing growth and COLA ($2.5 billion) and funding Proposition 49 ($428 million), the state would need to provide a $3 billion increase in Proposition 98 funding to meet K-14 obligations. As shown in Figure 5, this would require an appropriation of $731 million above the minimum guarantee. The box on page 34 provides options the Legislature may want to consider to meet these K-14 obligations in the budget year.
|
Figure 5 Proposition 98 Funding Available After Maintaining Base Program |
|||||
|
(In Millions) |
|||||
|
|
2006‑07 |
2007‑08 |
2008‑09 |
2009‑10 |
2010‑11 |
|
Resources |
|
|
|
|
|
|
Increase in Proposition 98 fundinga |
$2,221 |
$2,604 |
$3,649 |
$4,063 |
$4,218 |
|
Base Program Needs |
|
|
|
|
|
|
Growth and COLA |
$2,525 |
$1,737 |
$1,560 |
$1,539 |
$1,559 |
|
Proposition 49 |
428 |
—b |
— |
— |
— |
|
Funds available for other purposesc |
-$731 |
$867 |
$2,088 |
$2,524 |
$2,659 |
|
|
|||||
|
a Out-year estimates assume the state does not overappropriate the Proposition 98 guarantee in 2006‑07. |
|||||
|
b Proposition 49 funded as part of base program beginning this year. |
|||||
|
c Such as program expansions or payments to retire existing K-14 obligations. |
|||||
|
Options for Meeting K-14 Cost Pressures in 2006-07 The Legislature will face a difficult decision in determining how to fund the base K-14 education program in 2006-07. The spending obligations to fund the base program adjusted for growth, and cost-of-living adjustment (COLA) and Proposition 49 requirements are $731 million above our projected Proposition 98 minimum guarantee level. Below are some options the Legislature could consider to address the 2006-07 cost pressures.
|
Higher Education
In addition to community colleges (which are discussed above as part of the Proposition 98 forecast), the state’s public higher education segments include UC and CSU. The UC consists of nine general campuses (including a new campus at Merced, which opened in fall 2005), one health sciences campus, and numerous special research facilities. The UC awards bachelors, masters, and doctoral degrees, as well as various professional degrees. Of the segments, UC has almost exclusive jurisdiction over public university research. The CSU consists of 23 campuses and several off-campus centers. The CSU grants bachelors and masters degrees and a doctorate in education, and may award joint doctoral degrees with UC under specified circumstances. Overall, state policy for higher education is laid out in its Master Plan for Higher Education, which was originally adopted in 1960.
The Spending Forecast. Our forecast assumes cost increases which fully fund the projected impacts of inflation and enrollment growth. As a result, the segments’ budgets grow by an average annual rate of slightly less than 4 percent over the forecast period. We project that General Fund spending on the two university systems will increase from $5.3 billion in 2005-06 to $6.3 billion in 2010-11.
Key Forecast Factors. Our forecast is largely based on three key factors.
Inflation. We assume that base funding will increase annually to compensate for inflation. Neither the Master Plan nor statute provides any explicit guidance about inflationary adjustments. Over the forecast period, we project inflation to average about 2.7 percent annually.
Enrollment. Forecasting enrollment growth is more difficult. Enrollment growth depends primarily on population growth and participation rates. Participation rates respond to a range of factors, including state policies in areas such as outreach and financial aid, and actions by the segments in areas such as admissions policies and class scheduling. California’s college participation rates, currently among the highest in the nation, have been relatively flat over recent years. Given this, and lacking any evidence to assume otherwise, we have assumed participation rates at UC and CSU will remain constant throughout the forecast period. Our enrollment projections are therefore driven by projected population growth. We calculated the ethnic, gender, and age makeup of each segment’s student population, and projected separate growth rates for each group based on statewide demographic data. For example, we project that the population of Latino females ages 17 through 19 will grow by about 16 percent statewide over the forecast period, and therefore the number of students in that category will grow by the same percentage. When all student groups’ projected growth is aggregated together, we project that demographic-driven enrollment at the two segments will grow at an average annual rate of 1.5 percent over the forecast period.
Fees. The state has no expressed policy for annual fee adjustments at UC and CSU. In the absence of such a policy, we assume that enrollment fees will increase annually at the rate of inflation, thus maintaining their current purchasing power.
Governor’s Compacts. In spring 2004 the Governor developed “compacts” with UC and CSU in which he commits to seek specified funding increases for the segments in his future budget proposals through 2010-2011. Because these compacts are neither in statute nor formally endorsed by the Legislature for this period, we have not reflected them in our projections for spending at UC and CSU. We estimate the General Fund cost of implementing the compact would be about $35 million above our projection for 2006-07, rising to about $700 million above our projection for 2010-11.
Cal Grant Costs Likely to Increase Moderately. In place since 2001-02, the Cal Grant entitlement program guarantees financial aid to recent high school graduates and community college transfer students under 24 years of age. We estimate that General Fund spending for financial aid programs administered by the Student Aid Commission will increase from $752 million in 2005-06 to approximately $1 billion in 2010-11. The bulk of the expected increase is attributable to growth in the Cal Grant entitlement program, as well as our assumption that the use of the Student Loan Operating Fund (SLOF) to cover a portion of Cal Grant costs will end after this current year. (In 2005-06, $51 million of Cal Grant costs are being covered by surplus revenue available from the SLOF.)
Health
Medi-Cal
The Medi-Cal Program (the federal Medicaid Program in California) provides health care services to recipients of CalWORKs or SSI/SSP grants, and other low-income persons who meet the program’s eligibility criteria (primarily families with children and the elderly, blind, or disabled). The state and federal governments share most of the program costs on a roughly equal basis.
The Spending Forecast. We estimate that General Fund spending for Medi-Cal local assistance (including benefits, county administration of eligibility, and other costs) will reach nearly $13 billion in the current year, approximately the amount appropriated in the 2005-06 Budget Act.
We project that General Fund support would grow to $14 billion in 2006-07, an 8.7 percent increase from current-year expenditures. This is largely due to costs the Medi-Cal Program will incur as a result of increases in caseload, costs and utilization of medical services, as well various other one-time changes in program costs. By the end of the forecast period in 2010-11, we estimate that General Fund spending for Medi-Cal will reach $17 billion, an average annual increase of 5.8 percent over the forecast period.
Key Forecast Factors. Several factors play a significant role in our forecast:
Health Care Costs. The most significant factor in our forecast is the assumption that the cost of most health care services provided to aged, blind, and disabled Medi-Cal enrollees will increase at an annual rate of between 5 percent and 7 percent from 2006-07 through 2010-11 because of increased utilization and costs. In contrast, our projection assumes that the average cost of health care services for most families and children would generally grow more slowly (up to 3.1 percent during the same period). (One exception is the cost of Early and Periodic Screening, Diagnosis and Testing specialty mental health services, which we estimate will grow at a more significant rate.) As shown in Figure 6, the average cost per person enrolled in Medi-Cal is projected to grow from about $3,400 to $4,100 during the forecast period. Our health care cost assumptions are subject to considerable uncertainty and small changes in the actual rate of growth in medical costs could have significant fiscal effects on our forecast.
Medi-Cal Caseload Trends. As shown in Figure 6, the overall Medi-Cal caseload growth appears to be moderating. Our forecast assumes continued caseload growth commensurate with increases in the state population.
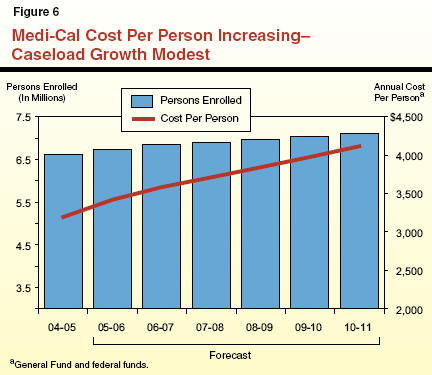
Impact of One-Time Changes in Costs. The 2003-04 budget plan had assumed that the state would temporarily achieve savings in the Medi-Cal Program by reducing by 5 percent the rates paid to certain providers. A legal challenge to this action blocked the rate reductions from taking effect for certain providers. A recent court ruling cleared the way for these reductions to take effect although recent legislation would limit their application. All of the rate reductions sunset in January 2007. As a result, increased costs of about $90 million annually will phase in by 2007-08. In addition, General Fund support for Medi-Cal will increase by $100 million in 2006-07 because of changes in the level of federal funding the state will receive to offset the cost for prenatal care services for Medi-Cal beneficiaries. This is mainly because the state will receive about $200 million in federal funds to offset these costs in 2005-06 (as reimbursement for prenatal services provided during 2004-05 and 2005-06), but will receive about $100 million in ongoing support for this purpose beginning in 2006-07. Thus, General Fund spending for Medi-Cal will increase in 2006-07 to make up for the reduced level of federal funds in that year.
Further Savings in 2006-07 and Beyond. Our forecast assumes that the state will achieve an increased level of savings beginning in 2006-07 from the implementation of various cost reduction strategies begun in 2005-06. These include activities to ensure that the Medi-Cal Program avoids costs and recovers certain payments for Medi-Cal services as allowed under state and federal law. This includes ensuring that persons who are eligible for the federal Medicare program are enrolled, thereby avoiding state costs. Savings are also anticipated from the expansion of Medi-Cal managed care into 13 additional counties by April 2008.
New Federal Drug Benefit. As discussed in more detail in the box below, a new drug benefit beginning January 2006 for persons enrolled in the federal Medicare program has significant fiscal effects on Medi-Cal and our fiscal forecast.
|
Medicare Drug Benefit Will Have Beginning January 2006, the federal government will provide outpatient prescription drug coverage, known as “Part D,” to Medicare beneficiaries. (Medicare is a federal program that provides health insurance coverage to eligible individuals at 100 percent federal expense.) Individuals who are both Medicare and Medi-Cal recipients are commonly referred to as “dual eligibles.” Once Part D is implemented, dual eligibles will receive most of their prescription drugs under Medicare instead of Medi-Cal. This change will affect state Medi-Cal expenditures for prescription drugs, resulting in a significant net state savings initially and significant net costs in subsequent years, as shown in the figure below. The shift in drug coverage for dual eligibles to Medicare will reduce state Medi-Cal costs. But federal requirements that California (and other states) make so-called “clawback payments” to reimburse the federal government will increase state costs. Also, the state will lose a substantial part of the revenues it now receives in rebates from drug manufacturers because Medi-Cal will no longer be providing drugs for dual eligibles. Initially, the state will achieve net savings as drug coverage for dual eligibles begins to shift to Medicare. However, once the loss of rebates is fully realized in 2007-08, the state will have a net increase in Medi-Cal costs of about $200 million per year that will continue through the remainder of our forecast period. We note that our drug cost assumptions are subject to considerable uncertainty and small changes in the actual rate of growth of these costs could have significant fiscal effects on our forecast. For more information on the Medicare prescription drug benefit, and its effects on Medi-Cal, see page C-105 of the Analysis of the 2005-06 Budget Bill.
|
Healthy Families Program
The Healthy Families Program (HFP) implements the federal State Children’s Health Insurance Program (SCHIP), enacted in 1997. Funding generally is on a two-to-one federal/state matching basis. The program generally offers health insurance to eligible children in families with incomes below 250 percent of the federal poverty level (FPL). The federal government has also authorized the use of federal funds to cover children up to age two in families with incomes below 300 percent of FPL who have transferred to HFP from the state’s Access for Infants and Mothers program. To participate in HFP, all participating families pay a relatively low monthly premium and are offered coverage similar to that available to state employees.
The Spending Forecast. We estimate that overall General Fund spending for HFP local assistance will be about $349 million in 2005-06, about the same amount of funding that was provided in the 2005-06 Budget Act. We further estimate that overall General Fund spending for the program will increase to about $353 million by 2006-07 and that by 2010-11 the program will have an annual General Fund cost of about $591 million. The average annual growth in expenditures over the forecast period is projected to be about 12.5 percent.
Key Forecast Factors. Several factors play a role in our forecast:
Exhaustion of SCHIP Fund Balance. States must spend their federal SCHIP allocations within a set period of time (generally three years) or risk the reversion of these funds to the federal government. The state expanded its use of SCHIP funds for health coverage programs beginning in 2003-04 to prevent SCHIP funds from being reverted and lost to the state. As a result, the current level of SCHIP funds being spent each year now exceeds the SCHIP funds allocated each year to California, with the result that the balance of unspent SCHIP funds has been gradually declining. Our HFP projection assumes that the state will exhaust its balance of unspent SCHIP funds in 2009-10, and that General Fund support will increase to maintain state health coverage programs with the current eligibility and benefits.
SCHIP Reauthorization. The SCHIP funding has been authorized by Congress only through the 2007 federal fiscal year. Our forecast assumes that Congress will reauthorize SCHIP funding beyond 2007 and at the same level as authorized for 2007. If Congress did not reauthorize funding for the program, or provided less funding for SCHIP, state costs for HFP would be significantly greater than we have projected during the forecast period.
Premium Increase. Our projection takes into account a policy change adopted as part of the 2004-05 budget plan that partially offsets the growth in program spending. Specifically, beginning in 2005-06, the premiums for children paid by families with incomes between 201 percent and 250 percent of FPL will have generally increased from $9 per child to $15. Our projection takes into account both revenues resulting from the premium increase and the effect of the increase on program caseloads.
Developmental Services
The state provides a variety of services and supports to individuals with developmental disabilities, including mental retardation, cerebral palsy, epilepsy, autism, or other similar disabling conditions. The DDS, which oversees the programs, operates five Developmental Centers (DCs) and two smaller facilities which provide 24-hour institutional care, and contracts with 21 nonprofit regional centers (RCs) to coordinate and deliver community-based services.
The Spending Forecast. We estimate that General Fund spending for developmental services in 2005-06 will total $2.3 billion, the same amount of funding appropriated in the 2005-06 Budget Act. Of that total, about $1.9 billion will be spent by RCs for community-based services and about $369 million, excluding Proposition 98 funds, will be spent for operating the DCs.
We further estimate that General Fund spending for developmental services will grow by about 9 percent in 2006-07 to approximately $2.5 billion.
Between now and the end of the forecast period, we estimate that General Fund spending for the developmental services program will grow by $1.2 billion and reach a total of $3.5 billion by 2010-11. This expenditure growth is due mainly to increased spending by RCs on community-based services. We estimate that there will be various one-time administrative and programmatic costs in 2005-06 and 2006-07 as a result of the closure of Agnews DC followed by an ongoing reduction in DC operating costs. Spending for DCs is projected to remain relatively flat over the rest of the forecast period.
Key Forecast Factors. Our forecast of significant growth in RC spending reflects historical increases both in caseload and in the average cost of serving each RC client. Specifically, our forecast assumes that RC caseloads will grow at an average annual rate of 4 percent, and that costs will grow at an annual average rate of 7.3 percent.
Social Services
CalWORKs
The CalWORKs program provides cash grants and welfare-to-work services to families with children whose incomes are not adequate to meet their basic needs. The CalWORKs program is primarily funded by state General Fund and federal funds that the state receives as part of its Temporary Assistance for Needy Families (TANF) block grant. In order to receive these federal funds, the state must meet a maintenance-of-effort (MOE) requirement, which is largely satisfied through state and county spending on CalWORKs. Federal TANF funds are used both to support the CalWORKs program and for transfers to offset General Fund costs in other related programs.
The Spending Forecast. General Fund spending for the CalWORKs program is estimated to be $2 billion in 2005-06, a $110 million decrease from the prior year. We project spending to increase by $636 million in 2006-07. Following a modest decrease ($160 million) in 2007-08, we project that spending will increase by an average of about 5 percent each year, reaching a total of nearly $2.9 billion in 2010-11.
Key Forecast Factors. A little more than half of the increase in 2006-07 ($362 million of $636 million) is the one-time costs for retroactive payment of the October 2003 COLA for 2003-04 through 2005-06. A superior court has ruled in the Guillen court case that the October COLA is required by current law. Our projections include an ongoing cost of $134 million for the October 2003 COLA beginning in 2006-07. We note that the administration has appealed the court decision and a ruling on this matter is expected in spring of 2006.
Pursuant to current law, the 2005-06 and 2006-07 COLA for the CalWORKs grants is suspended. Beyond 2006-07, program costs increase primarily due to grant COLAs; inflation increases for employment services, child care and administration; and reductions in available federal TANF carry-in balances.
Given the projected program spending, the level of transfers outside of CalWORKs, and the reduction in available carry-in funds, we assume California would spend hundreds of millions of dollars above the General Fund federal MOE requirement ($2 billion in the Department of Social Services) beginning in 2006-07 to fund current services levels. We also assume federal reauthorization of the $3.7 billion TANF block grant.
Caseload Trends and Projections. From 1994-95 through 2003-04, the CalWORKs caseload declined by 48 percent. This decline in caseload is attributable to a number of factors including the strong economy of the late 1990s, annual reductions in the teen birth rate, and CalWORKs program changes, which emphasized welfare-to-work services. Since October 2002, the caseload has remained relatively flat on a quarterly basis, with a quarterly average of about 490,000 cases. The most recent caseload figures (through July 2005) have shown a slight decrease in caseload beginning in January 2005. However, given the long period of relatively flat caseload, our projection assumes that caseload in the out years would remain relatively stable, decreasing only slightly (on average, about 1 percent annually).
SSI/SSP
The SSI/SSP provides cash assistance to eligible aged, blind, and disabled persons. The SSI component is federally funded and the SSP component is state funded.
The Spending Forecast. General Fund spending for SSI/SSP is estimated to be $3.6 billion in 2005-06, an increase of 4.3 percent compared to the prior year. For 2006-07, we project a 3.4 percent increase, raising total expenditures to $3.7 billion. From 2006-07 through 2010-11, spending for SSI/SSP will increase by an annual average rate of 6.8 percent, eventually reaching a total of nearly $4.8 billion.
Key Forecast Factors. The two primary cost drivers for SSI/SSP are caseload growth of about 2.6 percent and the cost of providing the statutory COLA beginning in 2007-08. For 2005-06 and 2006-07, the state COLA was suspended. In addition, budget legislation delayed the January 2006 and January 2007 federal COLAs for three months, resulting in one-time savings of $76 million and $48 million, respectively. The state COLA resumes in January 2008, resulting in six-month cost of $78 million in 2007-08. For the remainder of the forecast, the annual COLA will add costs of about $125 million each fiscal year. Finally, we note that beginning in 2006-07, the cost of providing state-only SSI/SSP benefits to noncitizens who immigrated to the United States after August 1996 substantially increases. This is because their sponsors’ incomes will no longer be counted as an offset to the grant amount.
Caseload Trends and Projections. During the late 1980s and early 1990s, the caseload grew rapidly, with most of the growth in the disabled component of the caseload. Subsequently, the caseload leveled off and actually declined in 1997-98, in part due to federal policy changes which restricted eligibility. From 1998 through 2003, the caseload grew at a steady rate of just over 2 percent per year. However, in the past year, caseload growth has begun to edge up past 2.5 percent. Given this recent modest up-tick in caseload growth and anticipated growth in the aged population, we project caseload growth to approach 3 percent by the end of the forecast period.
IHSS
The In-Home Supportive Services (IHSS) program provides various services to eligible aged, blind, and disabled persons who are unable to remain safely in their homes without such assistance. Program costs are shared 50 percent federal, 32 percent state, and 18 percent county.
The Spending Forecast. General Fund spending for IHSS is expected to be $1.2 billion in 2005-06, an increase of almost 5 percent over the prior year. For 2006-07, we project that costs will increase by about 8.5 percent to a total of $1.3 billion. For the remainder of the forecast, we expect costs to increase an average of 8 percent each year, resulting in General Fund expenditures of $1.8 billion in 2010-11.
Key Forecast Factors. In the budget year and beyond, the primary cost drivers for IHSS are caseload growth of about 5.3 percent per year and increases in provider wages. For this forecast, we have assumed annual increases in state costs of $40 million per year as counties gradually increase wages paid to IHSS providers.
Figure 7 shows IHSS costs per person. From 1998-99 through 2004-05, the cost per case increased rapidly, primarily due to increases in provider wages and the hours of services provided to recipients. These trends moderated somewhat in 2005-06 and we anticipate more modest increases in the cost per case during the projection period. Some of the recent moderation in program cost growth is attributable to a 2004-05 legislative initiative which included (1) establishing quality assurance functions in each county and (2) providing standardized assessment training for IHSS social workers.
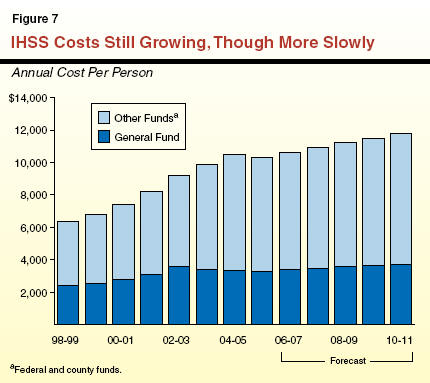
Judiciary and Criminal Justice
The major state judiciary and criminal justice programs include support for two departments in the executive branch-the California Department of Corrections and Rehabilitation (CDCR) and the Department of Justice-as well as expenditures for local trial courts and appellate courts. The two largest expenditure programs-CDCR and Trial Court Funding-are discussed in more detail below.
California Department of Corrections and Rehabilitation
Effective July 1, 2005, the various corrections departments were consolidated into a single department pursuant to Chapter 10, Statutes of 2005 (SB 737, Romero), and the Governor’s Reorganization Plan No. 1. The new CDCR is now responsible for the incarceration and care of adult felons and nonfelon narcotics addicts at 33 state prisons, as well as the rehabilitation of youthful offenders at eight youth correctional facilities. The CDCR also supervises and provides services to parolees released to the community.
The Spending Forecast. General Fund CDCR expenditures for 2005-06 are estimated to be about $112 million more than appropriated in the budget due primarily to an unanticipated increase in the inmate population, and higher than budgeted local jail costs to house state parolees.
Spending is projected to increase by 5.2 percent above the revised 2005-06 level to approximately $7.4 billion in 2006-07, and by 3.6 percent to $7.6 billion in 2007-08. For the remainder of the forecast period, General Fund spending is projected to increase by an average of 3.2 percent each year, reaching nearly $8.4 billion in 2010-11. This is a slower growth rate than in recent years when General Fund spending for all of the departments within the former Youth and Adult Correctional Agency grew by an average of about 7.7 percent per year. During the forecast period, this slower growth partially reflects the expiration of the Unit 6 collective bargaining agreement. (Our estimates for the forecast period include adjustments for employee compensation increases, but do not include General Fund support for capital outlay and debt-service, which are accounted for elsewhere in our projections.)
During the forecast period, the state’s General Fund costs are assumed to be partially offset by $79 million in annual reimbursements from the federal government for a portion of the state’s costs of housing undocumented immigrants convicted of felonies in California.
Key Forecast Factors. The projected increases in General Fund support for CDCR are driven by a combination of factors, including salary increases, inflation on operating expenses and equipment, and growth in the prison population. During the forecast period, salaries are projected to increase by nearly $830 million, which represents about 60 percent of the total growth in General Fund spending for the department between 2005-06 and 2010-11. Price adjustments for operating expenses and growth in inmate health care costs are projected to account for about 21 percent of the total increase. The remainder (19 percent) consists of population growth, and the continued implementation of previously approved projects and court orders. This growth in spending is partially offset by the expiration of one-time costs. We note that our forecast does not include the fiscal impact of a number of factors that may increase net costs-potentially significantly-during the forecast period, including any costs associated with federal receivership of the prison health care system and pending litigation relating to dental care.
As Figure 8 shows, the prison population is projected to increase by approximately 12,000 inmates during the forecast period, reaching 179,000 by the end of fiscal year 2010-11. This growth reflects a recent trend of increasing court commitments. In contrast, the incarcerated juvenile offender population (not shown in the figure) is projected to decrease to approximately 2,400 youth during the forecast period, a drop of about 550 youthful offenders. This reflects a continued trend of declining court commitments to state youth correctional facilities.
Trial Court Funding
The Trial Court Funding program provides funds for support of the state’s trial courts. California has 58 trial courts, one in each county. Chapter 850, Statutes of 1997 (AB 233, Escutia and Pringle), shifted fiscal responsibility for the trial courts from the counties to the state.
The Spending Forecast. General Fund spending is projected to increase by 7.4 percent to about $1.5 billion in 2006-07. For the remainder of the period, General Fund spending is projected to increase by an average of about 7.7 percent each year, reaching $2.1 billion in 2010-11. This is a faster growth rate than in the past five years during which General Fund spending increased an average of 6.2 percent each year.
Key Forecast Factors. Current law requires that most of the trial court budget be adjusted by the annual change in the state appropriations limit. This requirement accounts for approximately 91 percent of the projected growth in funding for the trial courts. The remainder (9 percent) reflects increases in judicial officer salaries and court security costs. Our projection also reflects a partial offset due to increased revenues from court fees and surcharges over the period.
Other
Local Government Finance
The 2004-05 budget package included a two-year shift of $1.3 billion of city, county, special district, and redevelopment agency property taxes to schools and community colleges. Our property tax revenue forecast for Proposition 98 reflects the end of this $1.3 billion tax shift. The 2005-06 budget package eliminated funding for the Property Tax Administration Grant Program in 2005-06 and 2006-07. Because authorization for this program sunsets after 2006-07, we do not assume funding for this program during the forecast period.
Noneducation Mandates
Requirements of the Constitution and Other State Statutes. For decades state statutes have provided that local governments may submit mandate claims-and be reimbursed for their expenses-in the year in which the local government carried out the mandated activity. In times of state fiscal difficulty, however, state appropriations frequently were insufficient to pay all claims, resulting in a mandate claim backlog totaling over $1.1 billion. In 2004, the state’s voters approved Proposition 1A, amending the California Constitution to (1) generally require the Legislature to appropriate funding in the annual state budget to fully pay local governments for their prior-year mandate costs and (2) pay outstanding claims incurred before 2004-05 within a time period prescribed by law (15 years). In 2005-06, seeking to comply with the new constitutional requirements and long-standing state statutes, the Legislature provided funding in the budget to pay mandate claims for the 2004-05 and 2005-06 years.
The Spending Forecast. Based on claims submitted to date, we estimate that additional one-time funding, probably in excess of $100 million, is needed to pay all 2004-05 and 2005-06 mandate claims. After accounting for this one-time cost in 2006-07, we estimate the annual costs for ongoing mandates will exceed $200 million and the cost to repay the mandate backlog over fifteen years will be about $100 million annually.
Unallocated Reductions
The 2005-06 budget plan assumes $100 million General Fund savings in both the current and budget years from authority given to the administration to reduce departmental appropriations. Given the difficulties in achieving these types of savings in past years, we assume that this authority will instead result in annual savings of $25 million.
Employee Compensation
Departments’ budgets include the current costs of compensating state employees. Each year, the budget includes a lump sum for additional compensation and benefits that will take effect in the budget year. The 2005-06 Budget Act and later legislation appropriate $167 million for this purpose. The largest component of these costs is for Unit 6 correctional officers and their supervisors and managers.
The Spending Forecast. We estimate that expenditures to augment current employee pay and benefits will increase from $167 million in 2005-06 to $1.3 billion in 2010-11. This reflects estimated costs associated with four agreements extending into the early part of 2006-07, two agreements that expire later, as well as projected inflation increases.
Key Forecast Factors. Unit 6 correctional officers and their supervisors and managers represent 40 percent of the General Fund’s salary costs. This group is expected to receive a pay raise of about 5 percent on July 1, 2006. We also estimate that planned overtime compensation for Unit 8 will increase Department of Forestry and Fire Protection costs significantly. We assume that after contracts expire for bargaining units, expenses will increase at the same rate as inflation.
Retirement
The 2005-06 Budget Act anticipates issuance of pension obligation bonds to achieve $525 million in General Fund savings for the Public Employees’ Retirement System (PERS). Other retirement-related expenses include health and dental insurance premiums for retired state employees and contributions to the State Teachers’ Retirement System (STRS) and the Judges’ Retirement System.
The Spending Forecast. We estimate that retirement-related General Fund expenditures will grow from $3.5 billion in 2005-06 to $4.6 billion in 2010-11 (including PERS contributions already included in departmental budgets). This projection reflects the continued growth of costs over the forecast period, particularly for retiree health benefits and increased contributions to STRS.
Key Forecast Factors. Earlier this year, PERS adopted new actuarial methods. These methods reduce the likelihood that stock market fluctuations will result in sudden, sharp changes in the required rate of state contributions. We project fairly stable PERS contribution rates through 2010-11 and modest growth in General Fund contributions consistent with a growing payroll. The forecast assumes that the pension bonds will now be sold in 2006-07 due to legal delays. Should the bond sale be further postponed or invalidated, the General Fund’s condition would worsen by $525 million in 2006-07.
State law establishes state contributions to STRS as a percentage of teacher payroll. We assume STRS contributions will grow at about the same rate as Proposition 98 expenditures. In 2003-04, the state reduced the appropriation to STRS by $500 million on a one-time basis to be restored if needed. If judicial or legislative action requires restoration of the $500 million during the forecast period, STRS contributions would likely increase above our estimates.
We project that costs to pay health premiums for retired state employees and their dependents will continue to increase significantly due to rising medical costs and growth in the number of retirees. We also assume that the state will receive employer subsidies of roughly $40 million under Medicare Part D beginning in 2006-07 for providing prescription drug coverage to its retirees-offsetting a portion of the state’s retiree health costs. These assumptions result in net annuitant health care expenditures growing from $895 million in 2005-06 to $1.5 billion in 2010-11.
Debt Service on Bonds
The General Fund incurs debt-service costs for principal and interest payments on two basic types of bonds-voter-approved general obligation bonds and lease-revenue bonds. (The latter are authorized by the Legislature and have commonly been used to finance correctional and higher education facilities among others.)
The Spending Forecast. General Fund spending for debt service on bonds used to fund infrastructure is estimated to be $3.6 billion in 2004-05, $3.9 billion in 2005-06, and $4.3 billion in 2006-07. Thereafter, it is projected to grow at an average pace of about 8.8 percent annually.
Key Forecast Factors. Projections of debt-service costs depend primarily on the volume of past and future bond sales, their interest rates, and their maturity structures. Our estimates assume that the volumes and maturity structures of future annual bond sales are similar to recent experience, and that bond interest rates will track our economic forecast. Under our projections, the debt-service ratio (DSR) for infrastructure bonds-that is, annual debt-service costs as a percent of annual General Fund revenues-would rise to a peak of slightly over 5.2 percent in 2009-10 and decline slowly thereafter as outstanding bonds are retired and new sales occur. If the state’s deficit-financing bonds (Proposition 57) that were previously sold to help deal with the state’s budget shortfalls are included in the DSR, it would peak at slightly over 6.8 percent in 2009-10. (For more information on payments of the deficit-financing bonds, please see the shaded box on page 28.) Although this DSR is higher than in many past years, it still is within the general range that many bond market participants would consider acceptable.
The Legislative Analyst's Office (LAO) is a nonpartisan office
which provides fiscal and policy information and advice to the
Legislature. To request publications call (916) 445-4656. This report and others, as well as an E-mail
subscription service, are available on the LAO's Internet site at
www.lao.ca.gov. The LAO is located at 925 L Street, Suite 1000,
Sacramento, CA 95814.
Acknowledgments
LAO Publications
Return to LAO Home Page