
June 2005
California has one of the world’s largest systems of public higher education, enrolling more than two million students each year. This system currently receives more than $30 billion annually in support of its activities.
Where does this funding come from? How are costs divided among various groups (such as undergraduate and graduate students)? What role do student fees play? How is financial aid funded? How does the state decide how many students to fund in a given year? The purpose of this primer is to address these and other questions related to the funding of higher education in California, so as to aid policymakers and other interested parties in their deliberations and decision making.
This primer is organized into the following sections: (1) overview of California’s higher education system, (2) enrollment, (3) student fees, (4) financial aid, (5) other budget considerations, and (6) accountability. At the end of each section, we identify several policy questions that we believe warrant the Legislature’s attention. We follow these with a concluding section that includes our recommendations for legislative action on higher education funding issues in the near term. Also included at the end of the primer is a glossary of common terms related to higher education funding and a listing of selected LAO publications related to higher education.
Overview of California’s Higher Education System
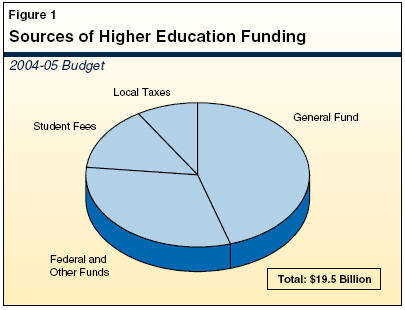
California’s public higher education system enrolls over two million students annually. It also conducts basic and applied research in numerous fields, and performs public service to the state and local communities in various ways. For 2004-05, the state provided about $9 billion in General Fund support for higher education. Despite significant variation in the state’s fiscal health over the past decade, higher education’s share of total General Fund spending has remained at around 12 percent throughout that period. As shown in Figure 1, student fees, local property taxes, and federal/other funds also contribute toward total funding for the system’s operations. Figure 1 does not include an additional $13 billion in federal and other funds that supports noncore activities such as managing the federal Department of Energy labs and providing medical services.
The state’s system of public higher education involves three “segments”: The University of California (UC), the California State University (CSU), and California Community Colleges (CCC). It also includes Hastings College of the Law, the California Student Aid Commission (SAC), and the California Postsecondary Education Commission (CPEC). The state’s Master Plan for Higher Education, originally adopted in 1960, ascribes distinct missions to each of the segments and expresses a set of general policies for higher education in the state. However, while the Master Plan describes a general vision for higher education, it provides little guidance as to how the system should be funded. Instead, the Legislature, Governor, and the segments themselves have developed a number of policies that guide higher education finance. In addition, numerous funding decisions are made annually as part of the budget process.
Budgeting for Higher Education
As part of his annual budget proposal to the Legislature, the Governor proposes funding for the various components of the higher education system. In recent years, the Governor’s annual budget proposal has in part been influenced by multi-year funding plans developed between the administration and the public universities. The latest such agreement, referred to as the higher education “compact,” was developed in the spring of 2004 and establishes annual funding targets through 2010-11. While the Governor has committed to pursue these targets in his budget proposals, the Legislature is not a party to the compacts and is not bound by them. Instead, as part of the annual budget process, the Legislature considers the Governor’s budget proposal in light of available resources, legislative priorities, programmatic effectiveness, and other factors. The Legislature typically deals with about a half-dozen cost factors that drive the overall budget. We discuss each of these cost factors below.
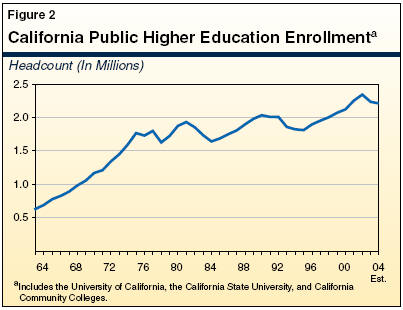
One of the principal factors influencing the state’s higher education costs is the number of students enrolled at the three public higher education segments. In fall 2003, approximately 2.2 million students were enrolled either full-time or part-time at CCC, UC, and CSU. (We describe the differences between this headcount measure and the alternative full-time equivalent [FTE] measure in the text box on the next page.) Figure 2 summarizes actual headcount enrollment for the state’s public colleges and universities for the past 40 years. The figure shows that enrollment grew rapidly through 1975 and then fluctuated over the next two decades. Since 1995, enrollment grew steadily until a slight decline in 2003. This decline was largely made up of part-time community college students who were taking relatively few courses. Despite this drop in headcount, there was a much smaller decline in community college FTE enrollment from 2002 to 2003.
|
FTE Versus Headcount Enrollment In this report, we generally refer to full-time-equivalent (FTE) students, rather than headcount enrollments. Headcount refers to the number of individual students attending college, whether they attend on a part-time or full-time basis. In contrast, the FTE measure converts part-time student attendance into the equivalent full-time basis. For example, two half-time students would be represented as one FTE student. In 2003-04, the ratio of FTE to headcount enrollment was 0.88 at the University of California, 0.75 at the California State University, and 0.68 at California Community Colleges. Headcount measures are useful for indicating how many individuals are participating in higher education at a given point in time. On the other hand, FTE measures better reflect the costs of serving students (that is, the number of course units taken) and is the preferred measure used for state budgeting purposes. |
Eligibility
The Master Plan is the state’s major policy statement on ensuring access to higher education. It established admission guidelines that remain the state’s official policy today. The plan calls for:
The community colleges to accept all applicants who are high school graduates, as well as any other adults who can benefit from attendance.
The California State University to accept applicants from the top one-third (33.3 percent) of public high school graduates, as well as all qualified community college transfer students.
The University of California to accept applicants from the top one-eighth (12.5 percent) of public high school graduates and all qualified community college transfer students.
By establishing these tiered eligibility targets, the Master Plan seeks to balance the twin goals of access for all and quality instruction for a variety of skill levels. (The box on the next page provides more information on eligibility for first-time freshmen.)
|
First-Time Freshman Eligibility In order to achieve their Master Plan targets, the University of California (UC) and the California State University (CSU) have adopted their own specific admissions criteria-such as minimum grade point average and SAT scores-for first-time freshmen. Students meeting these requirements are identified by the segments as being “eligible” for admission. Eligibility applies to each segment as a whole, and does not guarantee admission to any particular campus. This is because some campuses do not have the capacity and resources to admit all eligible applicants who desire to enroll there. As a result, some campuses use additional admissions criteria (which are stricter than systemwide eligibility criteria) to select new students from among eligible applicants. Eligible students who cannot be accommodated at the campus of their first choice typically are offered a space at a different campus in the system. For the most part, it has been the responsibility of the segments to periodically adjust their admissions criteria to ensure they continue to draw their students from the target populations called for in the Master Plan. In order to gauge how well the segments are doing this, existing law requires the California Postsecondary Education Commission (CPEC) to periodically estimate the percentages of California public high school graduates who are eligible under the segments’ admission criteria. The most recent CPEC eligibility study was based on 2003 public high school graduates. In this study, CPEC found that CSU was drawing from the top 28.8 percent of public high school graduates, which is below its Master Plan target of 33.3 percent. On the other hand, CPEC reported that UC was selecting from the top 14.4 percent of public high school graduates, which is above its Master Plan target of 12.5 percent. The CPEC also found that about 6 percent of graduates met UC’s course, grade, and SAT I requirements, but did not take the SAT II (which is not required by most colleges). When these students are included, UC is drawing from about the top 20 percent of high school graduates. |
Enrollment Growth
As part of the annual budget process, the Legislature typically augments each segment’s budget to accommodate growth in enrollment. Determining the amount of enrollment growth to fund can be difficult, however. Unlike enrollment in compulsory programs such as elementary and secondary education, which increases and decreases in almost exact proportion to the school-age population, enrollment in higher education responds to a variety of factors. Some of these factors are beyond the control of the state, such as population growth, but others stem directly from state policy choices, such as higher education funding levels and fees. Moreover, with the exception of population growth, it is often difficult to accurately predict factors that affect the level of demand for higher education. As a result, most enrollment projections have had limited success as predictors of actual enrollment demand. (See box on page 15 discussing current enrollment projections.)
In general, the two main factors influencing enrollment growth are (1) growth in the underlying population, and (2) changes in participation rates.
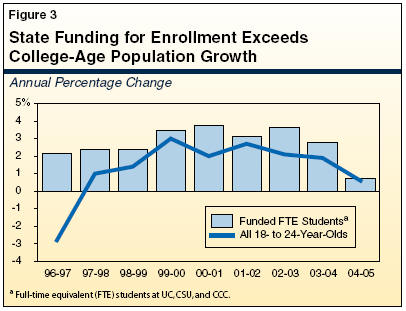
Population Growth. Other things being equal, an increase in the state’s college-age population (primarily 18- to 24-year-olds) causes a proportionate increase in those who are eligible to attend each segment. Population growth therefore is a major factor behind increases in college enrollment. Most enrollment growth projections begin with estimates of the growth in this population cohort, which for the rest of this decade is expected to range between 1 percent and 2.5 percent annually. As shown in Figure 3, in recent years the state has provided funding for enrollment growth that far exceeded changes in the college-age population. This reflects deliberate legislative policies to increase college participation, as discussed below.
Participation Rates. For any subgroup of the general population, the percentage of individuals who enroll in college is that subgroup’s college participation rate. California’s participation rates are well above the national average. The state currently ranks fourth (tied with four other states) in college enrollment among 18- to 24-year-olds and first among 25- to 49-year-olds.
Future changes to participation rates are difficult to predict because eligible students’ interest in attending college (that is, enrollment “demand”) is influenced by a number factors. These include student fee levels, the availability of financial aid, the prestige of the degree, the availability and attractiveness of other options (such as entering the workforce), and other factors that change over time in response to economic conditions and state policy.
Enrollment Funding Rates
In addition to deciding the amount of additional enrollment to fund in the annual budget, the Legislature must determine the appropriate amount of funding to be provided for each additional student. The state currently provides different funding rates for enrollment growth at each segment of higher education. Specifically, the state provides the lowest rate to community colleges, a somewhat higher rate to CSU, and the highest rate to UC. As discussed below, the methodology used to calculate these rates differs between the universities and the community colleges.
|
Current Enrollment Trends Higher education enrollment projections for the period of the late 1990s through about 2012 generally anticipate an increase in the traditional college-age population, caused largely by the children of the post-World War II “Baby Boomers” reaching college age. Although the size of the “baby boom echo” is considerably smaller than its predecessor, the effect on higher education enrollment is sometimes referred to as “Tidal Wave II.” Most projections of annual changes in the college-age population anticipate fairly modest increases, ranging between 1 percent to 3 percent for the rest of the decade. After that time, the state’s college-age population is expected to decline as the baby boom echo ages. However, projections of college enrollment are more varied, due primarily to different assumptions about changes to college participation rates. For example, enrollment projections by the California Postsecondary Education Commission and the California Department of Finance assume that college participation rates will increase for certain groups in the short term. This results in larger enrollment growth than would be projected with an assumption of constant participation rates. |
Growth Funded at Marginal Cost. The UC and CSU annually estimate the amount of funding they will require for each additional FTE student enrolling in the coming year. These amounts reflect the costs of additional faculty, teaching assistants, and various support services. However, they do not include fixed costs (such as facilities and utilities) that typically do not change with a small percentage increase or decrease in the number of students.
After calculating these “marginal cost” rates, the students’ share of these costs (in the form of fees) is subtracted to derive the amount of state General Fund support required to pay for each additional FTE student. Based on these calculations, the state provides funding for enrollment growth in the annual budget. (Please see nearby box for a further description of the existing marginal cost methodology.)
|
Existing Funding Methodology Includes Eight Cost Factors In the mid-1990s, as a result of a reporting requirement, the University of California (UC), the California State University (CSU), the Department of Finance, and the Legislative Analyst’s Office formed a working group to improve the method used to fund enrollment. The result was a marginal cost methodology that estimated the amount of funding needed to support each additional full-time equivalent student at UC and CSU. Today, the state continues to use virtually the same marginal cost formula. This formula accounts for eight cost factors (listed in the accompanying figure). Each factor is itself associated with a specific method for determining related per student costs. The figure displays a simplified version of the marginal cost calculations used to derive per student funding rates for UC and CSU in 2003-04.
|
|||||||||||||||||||||||||||||||||||||||||||||||||||
CCC Growth Funded Differently. The state does not employ an explicit marginal cost formula to fund enrollment growth at the community colleges. Instead, the state funds enrollment growth for the CCC system by increasing the prior year’s total enrollment funding by a specific percentage. For example, the state would fund a 3 percent increase in enrollment by increasing the prior year’s base apportionment funding by 3 percent. Actual allocation of this enrollment growth funding to individual districts follows a somewhat complicated formula that takes into account the size, growth patterns, and relative funding of the various districts.
When this growth funding is allocated to individual CCC districts, different amounts are provided for students enrolled in credit and noncredit courses. Credit courses generally offer collegiate-level instruction whereas noncredit courses provide precollegiate instruction such as basic skills and English as a Second Language. Students taking noncredit courses do not earn college credit and do not pay education fees. The per-student funding rate for CCC noncredit courses is about one-half the credit rate.
Issues for Legislative Consideration
The Legislature’s annual enrollment funding decisions involve both estimates of demographic change and policy choices. Enrollment-related policy questions include:
Marginal Cost. How suitable is the existing marginal cost methodology? Could greater efficiency and accountability be gained by instituting more differentiated funding that provides different rates for different types of courses? Should more expensive courses (such as lab courses or graduate seminars) receive a higher funding rate than less expensive courses (such as undergraduate lecture courses)?
Funding Methodology Differences. What are the advantages of employing different methodologies to fund enrollment growth at the different segments? Could greater efficiency and accountability be gained by standardizing the funding methodology for all three segments? Should similar types of services (such as remedial services) receive similar amounts of funding irrespective of the segment offering the services?
Enrollment Planning. How should the segments plan for fall enrollment prior to the adoption of the budget in the summer? Should the state adopt a long-term enrollment policy to guide both its enrollment funding decisions and the segments’ admissions decisions?
At the state’s public colleges and universities, students who are California residents pay education fees that cover a portion of their total educational costs. (Nonresident students pay higher charges that are intended to cover their full education costs.) Current resident fee charges for the three segments are shown in Figure 4. Fees provide an important source of funding for the state’s public higher education system, accounting for almost $3 billion of total funding in 2004-05. This revenue is available for the same general purposes as General Fund revenue. From a policy perspective, student fees also can promote educational accountability. When students and their families have a direct financial stake in their education, they are more inclined to hold their schools accountable for providing high-quality educational services.
|
Figure 4 2004‑05 Student Fees |
|||
|
(Systemwide Fees for Full-Time Students) |
|||
|
|
UC |
CSU |
CCC |
|
Resident Fees |
|
|
|
|
Undergraduate |
$5,684 |
$2,334 |
$780a |
|
Graduateb |
6,269 |
2,820 |
— |
|
Nonresident Fees |
|
|
|
|
Undergraduate |
$22,640 |
$12,504 |
$4,470a |
|
Graduate |
21,208 |
12,990 |
— |
|
|
|||
|
a The CCC charges residents $26 per credit unit and nonresidents $149 per unit. |
|||
|
b The UC charges higher systemwide fees for certain professional school programs. In 2004‑05, these fees ranged from $8,389 for the nursing program to $19,324 for the business program. The CSU charges lower graduate systemwide fees ($2,706) for its teacher education program. |
|||
Who Determines Fee Levels?
The UC Board of Regents and CSU Board of Trustees have statutory authority to set fee levels for their respective segments, whereas the state has direct authority to set fee levels for CCC. Notwithstanding this statutory distinction, the state has considerable influence over fee levels at UC and CSU. This is because the level of General Fund support provided in the annual state budget assumes that particular levels of fee revenue will be received by each of the segments. Thus, UC and CSU could experience a budget shortfall if they charge fees that are less than is assumed in the state budget. Conversely, if UC or CSU charge fees above the level the Legislature thinks appropriate, the Legislature could reduce that segment’s General Fund appropriation in order to deny it any financial benefit from the fee increase.
What Factors Guide Fee Decisions?
State Had a Fee Policy From Mid-1980s Through Mid-1990s. The state had an explicit fee policy in effect from 1986 through 1996. Chapter 1523, Statutes of 1985 (SB 195, Maddy), established three main policy principles:
State and Students to Share Costs. The state should bear primary responsibility for the cost of postsecondary education, but students should be responsible for a portion of their total education costs.
Fee Increases to Be Gradual, Moderate, and Predictable. Fee changes should be determined at least ten months in advance of taking effect, and increases should not exceed 10 percent in any year.
Aid to Offset Fee Increases for Needy Students. The state should provide sufficient financial aid to offset fee increases for financially needy students.
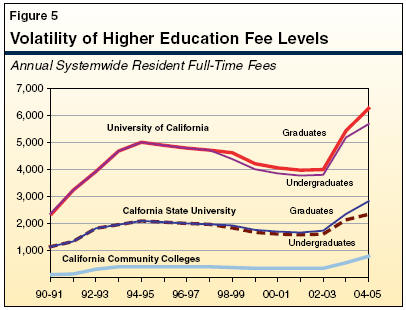
State Currently Lacks Explicit Fee Policy. Since 1996, the state has had no guiding fee policy. Instead, fee decisions have been made largely in response to the state’s fiscal condition. During the mid- and late 1990s, when the state’s economy was strong and General Fund support for higher education increased, fees remained flat or declined. Since 2002-03, however, fees have increased annually in response to the state’s fiscal downturn. Figure 5 shows the volatility of resident undergraduate and graduate fees during this period.
Recent Legislation on Fee Policy Vetoed by Governor. In the 2003-04 legislative session, the Legislature attempted to reestablish a state fee policy. Assembly Bill 2710 (Liu), would have reaffirmed the central provisions of the 1985 fee policy, but it would have moved beyond that earlier legislation by linking fees to a specified share of education costs at the state’s four-year universities. Specifically, AB 2710 capped fees for UC and CSU undergraduates at 40 percent and 30 percent, respectively, of education costs. Although AB 2710 was passed by the Legislature, the Governor vetoed the bill, leaving California without an explicit fee policy.
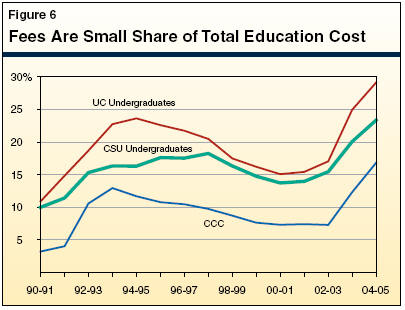
How Does Volatility in Fees Affect Students’ Share of Education Costs?
Fluctuations in fees have resulted in students bearing a greater share of total education costs in bad economic times and a smaller share of costs in good economic times. (“Education costs” include costs such as instruction, academic support, and student services. Books, transportation, food, rent, and other ancillary costs are excluded.) Figure 6 shows how fees as a share of total education costs have varied over time and across the segments. As the figure shows, over the last 15 years, nonneedy students have paid as little as 3 percent and as much as 29 percent of their education costs. (Most financially needy students pay no education costs-receiving grants or waivers that cover these expenses.) Despite the recent increase in students’ cost burden, nonneedy students continue to pay a relatively small share of their total education costs. For example, in 2004-05, nonneedy undergraduates at UC, CSU, and CCC are paying 29 percent, 23 percent, and 17 percent, respectively, of their education costs. (Although not shown in the figure, in the current year, nonneedy graduate students are paying even a smaller share of costs-21 percent and 18 percent for UC and CSU, respectively.
How Do Fees in California Compare to Other States?
Despite recent increases, fees at all three public segments remain low by national standards.
UC and CSU Student Fees Remain Low Relative to Comparison Institutions. To help assess various operational aspects of California’s public universities, UC and CSU are commonly compared to a set of other universities. The UC has eight of these “comparison institutions” (four public and four private), whereas CSU has 20 comparison institutions (15 public and 5 private). As shown in Figure 7, UC fees are below the average of its public comparison institutions, whereas CSU fees are substantially beneath the average of its public comparison institutions. In all but one case (UC undergraduate fees, which rank second to lowest), UC and CSU have lower fees than all of their comparison institutions. At both UC and CSU, graduate fees trail those of the comparison institutions more than undergraduate fees. At CSU, for example, undergraduate and graduate fees are 52 percent and 44 percent, respectively, of the average of its comparison institutions.
|
Figure 7 UC’s and CSU's
Resident Undergraduate Fees |
||
|
(2004‑05) |
||
|
|
Undergraduate |
Graduate |
|
UC and Its Public Comparison Institutions |
||
|
University of Michigan, Ann Arbor |
$8,722 |
$13,585 |
|
University of Illinois, Urbana |
7,944 |
8,310 |
|
University of Virginia, Charlottesville |
6,790 |
9,200 |
|
State University of New York, Buffalo |
5,907 |
9,455 |
|
Average of Public Comparison Institutions |
7,341 |
10,138 |
|
UC |
$6,312 |
$7,928 |
|
CSU and Its Public Comparison Institutions |
||
|
Rutgers University |
$8,869 |
$10,846 |
|
University of Maryland, Baltimore |
8,020 |
13,500 |
|
University of Connecticut |
7,490 |
8,476 |
|
Cleveland State University |
6,618 |
9,308 |
|
State University of New York, Albany |
6,383 |
8,949 |
|
University of Wisconsin, Milwaukee |
5,835 |
8,131 |
|
Wayne State University |
5,819 |
9,978 |
|
Illinois State University |
5,588 |
5,646 |
|
George Mason University |
5,448 |
7,830 |
|
University of Texas, Arlington |
5,093 |
6,740 |
|
North Carolina State University |
4,260 |
4,479 |
|
University of Colorado, Denver |
4,160 |
6,918 |
|
Georgia State University |
4,154 |
4,830 |
|
Arizona State University |
4,066 |
5,310 |
|
University of Nevada, Reno |
3,034 |
4,009 |
|
Average of Public Comparison Institutions |
5,656 |
7,663 |
|
CSU |
$2,916 |
$3,402 |
|
|
||
|
a Includes both systemwide and campus-based fees. |
||
|
Fee Revenue Both Augments and Replaces General Fund Support As noted earlier, the state General Fund and student fees contribute to total resources available for each of the three segments. The question often arises whether student fee increases actually add to the total resources available to the segments or whether they simply generate revenue that replaces General Fund support. Over recent years, fee increases have accomplished both ends. General Fund monies and student fee revenue are interchangeable. From 1995-96 through 2001-02, for example, the state provided the University of California (UC) and the California State University (CSU) with additional General Fund support specifically to compensate for the effect of inflation on student fees. In other words, rather than increasing fee levels to compensate for inflation, the state provided the segments with additional General Fund support in lieu of those fee increases. By 2001-02, the General Fund had provided a total of about a half a billion dollars to the combined base budgets of UC and CSU to compensate for the foregone fee increases. Beginning in 2002-03, UC’s and CSU’s undergraduate student fees increased by 10 percent to 30 percent each year. While these increases were adopted in response to the state’s fiscal crisis, it is not necessarily the case that they merely offset other state support. Given the state’s fiscal problems, General Fund reductions for UC and CSU were a distinct possibility regardless of whether fee increases were imposed. Thus, it is likely that the fee increases both backfilled some General Fund reductions, and increased total revenue beyond what would have been available without a fee increase. Similarly, fee increases at California Community Colleges during this period likely resulted both in a backfill of General Fund reductions and in additional total revenue for the system. |
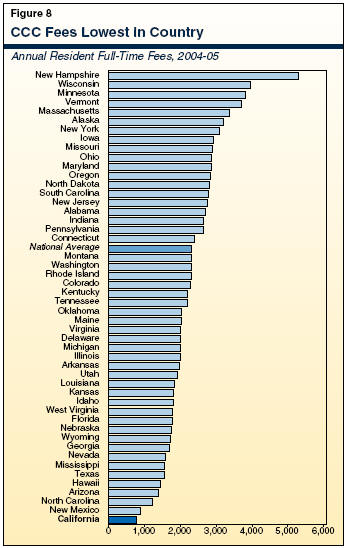
CCC’s Fees Remain Lowest in Nation. Unlike UC and CSU, CCC has no set of comparison institutions. Instead, CCC fees typically are compared with the average fee charged nationwide or the average fee charged by the various regions of the country. Figure 8 shows that CCC fees are the lowest in the country-much lower than the national average of $2,155 per year.
Issues for Legislative Consideration
Decisions about student fee levels involve fundamental policy questions that concern legislative priorities such as access and affordability. Central policy questions include:
What share of education costs should be borne by higher-income students who have not demonstrated financial need?
Should nonneedy students’ expected contribution (in percentage terms) vary by segment? by education level? by discipline? by future earning potential?
How can the state help students (both nonneedy and needy) and their families plan for the costs of their education?
Another major cost driver in higher education is financial aid. Financial aid comes in a variety of forms-including grants (which are need based); scholarships (which are merit based); waivers (which are either need based or provided in recognition of special circumstances); work study (primarily for undergraduates); fellowships, teaching assistantships, and research assistantships (primarily for graduate students); subsidized loans; tax credits; tax deductions; and savings plans with tax advantages.
What Are the Major Publicly Funded Aid Programs?
The state government, higher education segments, and federal government all administer financial aid programs. Below, we describe the major financial aid programs available to California students.
Statewide Financial Aid Programs. The SAC administers the Cal Grant programs. These programs provide state-funded financial aid to low-income and middle-income students who are California residents attending California institutions. Prior to 2001-02, three programs existed-the Cal Grant A, Cal Grant B, and Cal Grant C programs. All three programs offered grants on a competitive basis-meaning applicants were scored based upon their grade point average (GPA) and family income and then grant funds were distributed to the highest scoring applicants until all program funds were exhausted.
Chapter 403, Statutes of 2000 (SB 1644, Ortiz), largely replaced this competitive selection process with an entitlement program that guarantees a Cal Grant to all students who meet specified age, GPA, and income criteria. The entitlement program applies to recent high school graduates who enroll directly in a two- or four-year college, as well as students who transfer to a four-year college before turning 24 years of age. For students who do not meet these criteria, a limited number of competitive grants are still available each year.
Segment-Specific Aid Programs. The UC, CSU, and CCC operate large-scale, segment-specific financial aid programs. These “institutional aid” programs were originally created to help financially needy students pay education fees. The UC Student Aid program was established at the same time UC instituted its registration fee-in 1968-69. Similarly, CSU’s State University Grant program was established when the state university fee was instituted in the mid-1980s. Over time, UC’s and CSU’s programs, however, have evolved and now each has unique eligibility criteria, award coverage, and award levels. By comparison, the CCC Board of Governors’ fee waiver program has waived fees for financially needy students since its inception in the mid-1980s.
Federal Financial Aid Programs. The United States Department of Education (USDE) administers most federal financial aid programs. The USDE directly administers the Pell Grant program, which covers a portion of the total cost of attendance for low-income students. College campuses indirectly administer a much smaller supplemental grant program, the Supplemental Educational Opportunity Grant program, as well as a federal work-study program and the Perkins Loan program. The USDE directly funds the Federal Direct Student Loan program, and EdFund (California’s guarantee agency) administers the Federal Family Education Loan program. Both of these loan programs offer subsidized loans to financially needy students and unsubsidized loans to nonneedy students.
In addition to these programs, the Internal Revenue Service (IRS) administers two federal income tax credit programs-the Hope program, which provides students’ families a credit of up to $1,500 of their first- and second-year tuition and fee costs, and the Lifetime Learning program, which provides a credit of up to $2,000 of tuition and fee costs for any year of postsecondary education. The IRS also administers several college savings programs and several tax deduction programs, which allow families to deduct interest paid on loans, some work-related education expenses, and some tuition and fee costs when determining their tax liability.
|
Programs Are Major Public Investments The question often arises whether institutional aid programs are supported with “state” monies (General Fund) or “segment” monies (student fee revenue). From an accounting perspective, the University of California (UC) and the California State University’s (CSU) aid programs are supported with both General Fund monies and student fee revenue, whereas the California Community Colleges’ fee waiver program is funded entirely from the General Fund. (Until 1992-93, CSU’s program also was funded entirely from the General Fund.) From 1992-93 to the present, student fee revenue has comprised an increasing share of both UC’s and CSU’s institutional aid budgets. This is because 20 percent to 33 percent of all new fee revenue each year (which has been substantial given recent fee increases) has been added to UC’s and CSU’s institutional aid budgets-resulting in large aid augmentations even though General Fund support has remained virtually constant. From a policy perspective, General Fund monies and student fee revenue can be used to support the same general education purposes. Given this fungibility, the critical issue is whether institutional aid programs are meeting a vital public need in the best possible way. |
How Much Total Aid Is Available?
Figure 9 lists major publicly funded grant programs for California students and identifies the associated 2004-05 funding level. In 2004-05, California students received $3.2 billion in publicly funded college grants. In addition to this public gift aid, California students received $110 million in federal work-study monies, $4.4 billion in new federally guaranteed college loan volume, and hundreds of millions in federal tax benefits. At the three segments, private donors also contributed approximately $138 million for grants and scholarships.
|
Figure 9 Major Publicly Funded
Grants for |
|
|
(In Millions) |
|
|
|
2004‑05 Budgeted Funding Level |
|
State Financial Aid |
|
|
Cal Grants |
$758.9 |
|
Institutional Financial Aid |
|
|
UC |
$389.2 |
|
CSU |
216.5 |
|
CCC |
276.5a |
|
Subtotal |
($882.2) |
|
Federal Financial Aid |
|
|
Grants |
$1,552.7 |
|
Total |
$3,193.8 |
|
|
|
|
a In addition, CCC budgeted approximately $73 million for book and child care vouchers. |
|
Who Receives State Aid?
Although critical for evaluating financial aid programs, information on who receives aid, and in what amounts, is very difficult to obtain. This is because so many agencies administer so many programs providing so many types of aid, and the state lacks routine, formalized reporting of students’ overall financial aid packages. Nonetheless, by examining the various programs’ eligibility criteria, we can at least identify the types of students who are intended to be served.
Cal Grants Focus Primarily on Helping Low- and Middle-Income Students Cover Education Fees. Figure 10 shows the basic differences in the eligibility criteria of the Cal Grant A and Cal Grant B entitlement programs. In simplest terms, the Cal Grant A program is designed for low- and middle-income students enrolled in programs at least two years in duration, whereas the Cal Grant B program is intended to help lower-income students enrolled in programs at least one year in duration. The Cal Grant A covers only education fees, whereas the Cal Grant B covers a portion of the student’s living costs ($1,551), as well as education fees (after the first year of college). The Cal Grant C program, which remains a competitive program, is designed for both low- and middle-income students enrolled in short-term vocational education programs.
|
Figure 10 Eligibility Criteria
for |
||
|
(2004‑05) |
||
|
|
Cal Grant A |
Cal Grant B |
|
Grade Point Average |
|
|
|
Minimum high school |
3.0 |
2.0 |
|
Minimum transfer |
2.4 |
2.4 |
|
Income Ceiling for Family of:a |
|
|
|
Six or more |
$78,100 |
$42,900 |
|
Four |
67,600 |
35,500 |
|
Two |
60,700 |
28,300 |
|
Asset ceilingb |
52,300 |
52,300 |
|
|
||
|
a Represents ceilings for dependent students and independent students with dependents other than a spouse. |
||
|
b A family's asset level excludes its principal residence. |
||
UC Aid Program Helps Cover All Financial Need of All Its Students. Like most financial aid programs, the UC aid program assumes students and their families financially contribute toward college costs, as determined by a federal needs-based formula. The UC also assumes students contribute to their college costs though some combination of work and loans. (In 2003-04, for example, UC assumed students worked about 13 hours per week and took a manageable-sized loan.) After accounting for both the expected family contribution and the work/loan expectation, the UC program covers all remaining costs (if any) of all its students. Unlike the other public segments, the UC program therefore provides substantial aid to cover both educational costs and general living expenses. In the simplest terms, the UC program provides aid sufficient to meet the full range of costs of attendance for all financially needy students-even those with family incomes too high to qualify for the Cal Grant program.
CSU Aid Program Tends to Cover Education Fees for Students Not Qualifying for Cal Grants. Unlike UC’s program, CSU’s program continues to cover primarily education fees. Similar to UC, however, CSU’s aid program helps students who either have GPAs too low or family incomes too high to qualify for the Cal Grant program. The CSU program also serves older students who exceed the Cal Grant age caps.
CCC Aid Program Intended to Cover Education Fee for All Financially Needy Students. The CCC program provides fee waivers as an entitlement program, available to all resident students who can demonstrate need. Its specific eligibility criteria are the most generous of all publicly funded grant programs in California. Thus, like UC and CSU, it too serves some students with GPAs too low or family incomes too high to qualify for the Cal Grant program. About 40 percent of all credit units are waived through the program.
Issues for Legislative Consideration
The state’s various financial aid programs interact with one another and with fee levels in ways that have significant impacts on affordability. The Legislature encounters financial aid policy questions that include:
How much of the total funding the state provides for higher education should be targeted at needy students (through financial aid programs) versus nonneedy students (in the form of low fees)?
Should the state use different eligibility criteria across the segments or standardize eligibility criteria statewide? That is, which students attending which institutions should receive what types of aid benefits?
How should the segments be held accountable for distributing public monies consistent with state financial aid objectives? How should the state hold financial aid recipients accountable for their use of grant monies?
In addition to enrollment, fees, and financial aid (all of which involve important policy questions), annual budget deliberations typically must resolve a number of other key funding issues for higher education.
Cost-of-Living Adjustments (COLAs)
Over time, inflation has the effect of decreasing the purchasing power of state dollars. For this reason, the segments’ base budgets are typically increased by a few percentage points each year in order to compensate for the effect of inflation. These COLAs, therefore, are not intended to fund increased workload, but rather are meant to help the segments pay for the higher cost of meeting existing workload.
UC’s and CSU’s COLAs Are Discretionary. Although COLAs have customarily been provided to UC and CSU in most years, there is no statutory requirement for these payments. In some years when state funds have been scarce, the universities have not received a COLA. In others, the budget provided them base increases well above the rate of inflation. The amount of this funding that the universities provide for faculty and staff salary increases has varied.
CCC’s COLA Also Is Discretionary, but Has Tended to Match K-12 COLA. Statute directs the CCC Chancellor’s Office to include a COLA in its annual budget request to the Governor. This requested COLA is calculated using the same formula (based on the state and local deflator) used by the K-12 system. While there is no statutory requirement that the enacted budget include funding for the requested COLA, in most years CCC has received it. (A recent exception was in 2003-04, when neither CCC nor K-12 received a COLA.)
Earmarked Funding
State funding for the higher education segments is largely unrestricted. That is, the segments are free to expend most of their state funding (and fee revenue) for any purpose consistent with their mission. However, some higher education funding (particularly that of CCC) is earmarked for specific purposes in “schedules” within the budget act. By creating these scheduled categories of funding, the Legislature influences how the segments allocate a portion of their funding.
For UC and CSU, little of their General Fund appropriations are specifically earmarked. (An exception is some of UC’s research funding, which in recent years has included a dozen or so scheduled categories.) For CCC, however, separate categories exist for about two dozen programs, including student services, part-time faculty salaries and benefits, economic development programs, financial aid, technology projects, and various other activities.
Annual budget deliberations sometimes focus on proposed changes in the funding level for a particular program-an increase in outreach funding, for example. At other times, the Legislature has considered proposals to change the way programs are earmarked. In 2004-05, for example, the Governor proposed a modest restructuring of some of CCC’s categorical programs, but most of that proposal was rejected by the Legislature.
CCC and Proposition 98
All state funding provided to community college districts is counted toward the state’s minimum K-14 education funding level specified by Proposition 98. Proposition 98 is an initiative approved by voters in 1988 that requires the state to provide at least a specified level of annual funding (in the form of General Fund support and local property taxes) to K-12 public schools and CCC. The guaranteed amount varies depending on specified economic and demographic factors. Over the past decade the Proposition 98 guarantee has steadily increased from $25 billion to almost $50 billion. State funding for the CCC Chancellor’s Office (about $9 million in 2004-05) does not count towards the Proposition 98 appropriation, and neither does revenue from student fees. The box on the next page provides more detail about the interplay of General Fund and local property tax revenue within CCC’s Proposition 98 funding.
|
Interplay of General Fund and Local Property Tax Revenue for California Community Colleges (CCC) Proposition 98 funding is comprised of General Fund support and local property tax revenues. Under any given Proposition 98-mandated spending level, therefore, local property tax revenues offset state General Fund obligations. If local property tax revenues were to increase, state General Fund obligations (under any given Proposition 98 guarantee level) would decrease by a like amount. In developing the annual CCC budget, the state must estimate how much local property tax revenue will be available to the colleges. For any individual college district, General Fund revenues will be adjusted upward or downward from the budgeted level to compensate for any surplus or shortfall in actual tax receipts. However, if the systemwide level of local property tax revenue turns out to be lower than budgeted, this shortfall will be proportionally spread across all districts. In some years, legislation has been passed to augment General Fund support to community colleges in order to make up for this shortfall. In other years, community colleges were required to absorb the shortfall. In this latter case, total Proposition 98 spending for community colleges would decline from the budgeted level. |
Because of CCC’s inclusion under the Proposition 98 guarantee, there are significant consequences for shifting General Fund support in or out of the CCC budget. For example, a shift of $50 million in enrollment funding from UC to CCC would have no net effect on the General Fund and no effect on total higher education expenditures, but it would increase the level of appropriations counting toward the Proposition 98 guarantee. It also would alter the “split” between CCC and K-12, as described below.
The Proposition 98 Split. State law requires that CCC receive roughly 11 percent of total Proposition 98 appropriations. However, the Legislature has suspended this provision in each budget act since 1991, providing CCC with less than 11 percent each year. Figure 11 shows CCC’s share of Proposition 98 funding over the past decade.
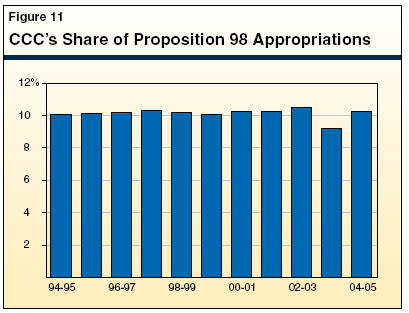
In recent years, the K-12/CCC split has become even less meaningful as a measure of actual resources provided to CCC. In part, this is because recent budgets have “deferred” some Proposition 98 costs incurred by K-12 districts and CCC districts from one fiscal year to the next, thus causing the “official” Proposition 98 funding levels to not fully correspond to programmatic funding levels in any given fiscal year. In addition, CCC has received additional revenue in recent years from student fee increases. This revenue is not counted toward CCC’s Proposition 98 appropriations.
Issues for Legislative Consideration
The Legislature continues to encounter long-standing policy questions about the desirability of earmarking higher education appropriations and various issues related to Proposition 98. These questions include:
To what extent should the budget specify funding levels for specific higher education programs?
What should determine the percentage of Proposition 98 funding that CCC receives? Should that percentage be the same year after year, or should CCC’s share respond to changing factors such as the relative enrollment growth between K-12 and CCC?
Ideally, the provision of state funds to the segments would ensure the achievement of certain outcomes, and these outcomes would reflect the state’s highest priorities. However, state funding for the public higher education segments is not explicitly linked with the actual performance of the public higher education system.
Legislative Delegation Authority
The state provides varying levels of autonomy to each higher education segment. When it was adopted in 1879, the State Constitution established UC as a “public trust” and conferred on the Board of Regents significant power to organize and govern UC. For example, the Regents can set student fee levels, establish admissions criteria, and approve academic degree programs without explicit legislative action. Still, the Constitution does not grant UC full autonomy. For example, the Legislature influences UC operations through the appropriation of state funds to the university, among other methods.
The Legislature consolidated the separate California state colleges into the CSU system as part of the Master Plan in 1960. The Board of Trustees exercises broad power over CSU’s day-to-day operations and administration, similar to the powers exercised by the UC Regents. Because the Trustee’s powers are conferred by statute (rather than the Constitution), the Legislature can modify those powers or impose new requirements on CSU by amending statute.
The Legislature statutorily consolidated the state’s community colleges into the CCC system in 1967. The system is composed of individual districts that are governed by locally elected Boards of Trustees. A state Board of Governors provides additional direction to the local boards. State law and annual budget acts are much more prescriptive for CCC than they are for UC and CSU. For example, unlike UC and CSU, the Legislature specifies the proportion of full-time to part-time faculty for CCC.
Accountability Efforts
While the state grants considerable flexibility to the segments, there is no mechanism to ensure the segments in fact achieve state goals. Instead, the Legislature, Governor, and segments have taken steps to measure performance towards predetermined goals.
CCC’s Partnership for Excellence. From 1998 until its expiration on January 1, 2005, the Partnership for Excellence provided supplementary funding to CCC in exchange for the commitment to improve student outcomes in specified areas. Statute required CCC to commit to improving performance in several areas related to student success, and to develop related outcome measures to assess district performance (see Figure 12). The act expressed the state’s commitment to provide supplemental funding (above funding for enrollment growth and COLAs) “to invest in program enhancements that will increase performance toward the community colleges’ system outcome measures.”
|
Partnership for Excellence: |
|
Transfer |
|
CCC Measure: Number of students who transfer from community colleges to baccalaureate institutions. |
|
Transfer-Prepared |
|
CCC Measure: Net number of students in the system who earned 56 transferable units with a minimum grade point average of 2.00. |
|
Degrees and Certificates |
|
CCC Measure: Number of degrees and certificates awarded. Currently, only degrees and certificates of at least 18 units are counted. |
|
Successful Course Completion |
|
CCC Measure: Overall rate of successful course completions. “Successful completion” requires a course grade of A, B, C, or “credit.” |
|
Work Force Development |
|
CCC Measure: Successful completion of vocational courses and provision of contract education to California businesses. Successful completion requires a course grade of A, B, C, or credit. |
|
Basic Skills Improvement |
|
CCC Measure: Number of students successfully completing coursework at least one level above their prior basic skills enrollment in the same subgroup (writing, reading, et cetera). Successful completion requires a course grade of A, B, C, or credit for credit courses, and 75 percent attendance for noncredit courses. |
CSU’s Internal Accountability Structure. In 1998, the CSU Board of Trustees adopted the Cornerstones report, a comprehensive planning framework that includes performance goals for the entire university system. During the creation of the report, CSU leaders advocated for the development of segment accountability system through which CSU could monitor its performance toward internally developed goals. Although these goals have no formal tie to statewide goals or legislative budget appropriations, they provide a framework for the achievement of systemwide goals. The first CSU accountability report was completed in April 2001 and subsequent reports have been issued yearly to the Board of Trustees.
Higher Education Compacts. Formal agreements that express performance and budget preferences, such as the “compacts” entered into by the Governor and higher education segments, have been called a form of accountability. These agreements outline the performance expectations of both parties. Typically, the Governor has promised to propose a certain allocation level in the annual budget and the segments have agreed to meet certain expectations, such as accepting all eligible applicants and improving graduation rates.
Other Accountability Efforts.
CPEC Performance Indicator Report. Chapter 741, Statutes of 1991 (AB 1808, Hayden), directs CPEC to submit an annual report to the Legislature and Governor that provides information on the significant indicators of performance of the state’s public universities and colleges.
Ad Hoc Legislative Action. In addition to the forms listed above, accountability is pursued through established legislative processes. The Legislature examines the segments’ progress toward state goals through budget and other legislative hearings. It also can compel action through supplemental report or budget bill language requirements.
SB 1331, Alpert (Vetoed by Governor). This 2004 legislation would have established a postsecondary education accountability structure and reporting system for the annual assessment of progress toward established policy goals. It would have directed CPEC to administer the statewide accountability program and to collect and analyze data received from institutions. It identified four statewide policy goals for postsecondary education in California: educational opportunity, participation, student success, and public benefits.
Issues for Legislative Consideration
In recent years, the Legislature has expressed a growing desire for greater accountability in higher education spending. Addressing this concern about accountability involves policy questions such as:
How can the state ensure that the funding that it provides to achieve specific goals in fact accomplishes those goals? To what extent do existing accountability mechanisms provide such assurance to the Legislature?
How should the state balance flexibility for the segments with the articulation of state goals?
Higher education receives a significant share of the state General Fund budget. As illustrated in the preceding chapters, there are a handful of regular topics the Legislature encounters each year in its funding deliberations on higher education. We have written this primer to help explain the nature and context of those annual funding decisions.
More generally, the Legislature is faced with the challenge of balancing the need to preserve flexibility in adopting annual budgets with the desire to focus its higher education funding choices over time toward established legislative goals. This balance can be addressed by the adoption of policies that can help guide future higher education funding decisions. While there are a number of policy areas in higher education that could benefit from such longer-term legislative guidance, we believe two policy areas stand out: establishing a student fee policy and coordinating financial aid to maximize access. In these two areas, which we discuss below, the Legislature has already devoted considerable time and attention, and we believe that resolution of these issues could be completed in the near future. Moreover, these two areas are of central importance to the state’s entire education system.
Establish Share-of-Cost Goal for Student Fees
Most interested parties-including the segments, student groups, and the Legislature itself-have long expressed a desire for the state to adopt a policy for the annual setting of higher education fees. However, there has been little consensus on how such a policy should be structured.
We recommend the Legislature adopt a fee policy that sets student fees at a specified percentage of the cost of education. Such a policy would make explicit the share of total education costs that financially nonneedy students would be expected to bear. (Financially needy students would continue to receive aid sufficient to cover education costs.) Once the share-of-cost target was achieved, it would be maintained over time. When the cost of education increased, student fees would increase by a proportionate amount. As a result, student fees would always reflect the same percentage of total cost.
A share-of-cost fee policy would provide both an underlying rationale for fee levels and a mechanism for annually assessing these levels. In doing so, it would promote clear expectations about fee levels and consistent treatment of student cohorts over time. It also would create incentives for students to hold the segments accountable for keeping costs low and quality high, and it would formally recognize the private as well as public benefits of higher education.
Coordinate Financial Aid Programs To Maximize Access
The state has a number of financial aid programs, including the Cal Grant entitlement and competitive programs, the CCC Board of Governors fee waiver program, and institutional financial aid programs at UC and CSU. The state invests more than $1 billion in these programs each year. The federal government and private organizations also contribute more than $1 billion to various financial aid programs.
It is important that financial aid programs be structured to maximize the overarching goal of facilitating access to higher education. Opportunities exist to improve the coordination of these programs to better ensure that aid is directed where it is most needed, the programs are readily understood by students, and the state’s objectives are consistently achieved. One potential area for improvement is the relationship between institutional aid programs and the Cal Grant programs. The institutional aid programs, for example, have different eligibility standards and award amounts that do not readily align with the Cal Grant criteria. As another example, there are gaps in Cal Grant entitlement eligibility that may not serve the Legislature’s policy objectives. For instance, students who do not enter college immediately after high school or who do not meet certain age restrictions are not eligible for this financial aid program.
We recommend the Legislature consider the various financial aid programs as a system and determine whether changes in the structure of these programs or the allocation of funding is warranted. A first step would be to identify clear policy goals for the provision of financial aid. Based on these goals, the Legislature could determine whether some programs should be modified, consolidated, or eliminated. It also could determine whether the current allocation of the state’s financial aid resources among the various programs is the best for achieving the state’s access goals.
Glossary
Apportionment Funding: General-purpose funding received by community colleges based on the number of students enrolled.
Board of Governors (BOG) Waiver: A fee waiver available to all community college students who can demonstrate need. The waiver completely covers a student’s enrollment fee, which in 2005 is $26 per unit. About 40 percent of all units taken at the community colleges are covered by BOG waivers.
Categorical Program: A program funded with appropriations that are “earmarked” or set aside specifically for that purpose.
Compact: An agreement made between the Governor and representatives of a higher education segment that sets expectations for the elements to be included in the Governor’s budget proposal to the Legislature.
Comparison Institution: Higher education institutions in other states that are considered comparable to UC or CSU. Some comparison institutions are private and some are public. Comparisons typically are made on such topics as faculty salaries and student fee levels.
Cost-of-Living Adjustments (COLAs): An appropriation to fund increases in faculty and staff salaries and other operational costs that increase as a result of inflation. The COLAs are typically calculated according to an inflationary index, such as the Consumer Price Index or the California State and Local Deflator.
Differential Funding: The funding of different types of instruction (such as lecture and lab classes), or instruction in different types of programs (such as engineering or nursing), at different rates.
Educational Fee: The fee charged for enrolling at the state’s public universities and colleges. It is analogous to what is termed “tuition” in most other states.
Eligibility: Meeting the requirements (usually related to grade point average and SAT scores, as well as residency) to qualify for admission to college. Master Plan admissions guidelines direct the University of California (UC) to draw students from the top one-eighth (12.5 percent) of public high school graduates, the California State University (CSU) to draw students from the top one-third (33 percent) of public high school graduates, and for California Community Colleges to accept all applicants 18 years or older.
Equalization: The process of addressing funding disparities among community college districts. (Also refers to similar efforts among K-12 school districts.)
Expected Family Contribution: The amount of money that a student’s family is expected to pay toward the cost of his or her education. Typically, financial aid programs cover costs beyond the expected family contribution.
Free Application for Federal Student Aid (FAFSA): A single form that enables students to apply for a range of federal financial aid programs. The FAFSA is also used to determine eligibility for some state financial aid programs.
Full-Time Equivalent (FTE): A measure that converts part-time student attendance into a comparable full-time basis.
Institutional Financial Aid: Financial aid offered by the state’s public universities to their own students. Most institutional financial aid is funded from a portion of the fee revenue the universities collect from students.
Headcount: The number of individual students who attend a college or university.
Marginal Cost: The funding provided to support each additional FTE student at UC or CSU. The marginal cost is typically much less than the average cost of instruction.
Master Plan for Higher Education: The state’s major policy statement on public higher education.
Outreach (Also Known as Academic Preparation): Activities conducted by the universities and others to increase the number of underrepresented students enrolled in higher education.
Participation Rate: The percentage of a defined population (such as 18- to 24-year-olds) that is enrolled in higher education.
Proposition 98: A constitutional amendment passed by California voters in 1988 that mandates that a minimum amount of funding be guaranteed for K-12 public schools and community colleges each year.
Tidal Wave II: What some have termed the projected increase in the number of students attending college in the near future due primarily to the movement of a demographic bulge towards college-age years.
Total Education Cost: The cost incurred by a college or university in educating a student. Part of this cost is typically paid by the student in the form of fees, and remainder is publicly funded.
LAO References
Enrollment
� Maintaining the Master Plan’s Commitment to College Access, February 2004.
� An Assessment of Differential Funding, report for the Assembly Higher Education Committee, September 2004.
� Analysis of the 2005-06 Budget Bill (page E-157), February 2005.
Student Fees
� A Share-of-Cost Student Fee Policy, report for the Assembly Higher Education Committee, April 2004.
� “Who Pays Education Costs at California’s Public Colleges and Universities,” Issue 2 of LAO’s series, Higher Education: Answers to Frequently Asked Questions, September 2004.
� Analysis of the 2005-06 Budget Bill (pages
E-178-197), February 2005.
Financial Aid
� “Financial Aid,” Analysis of the 2004-05 Budget Bill (pages E-214-235), February 2004.
� “UC and CSU’s Institutional Aid Programs,” Analysis of the 2003-04 Budget Bill (pages E-205-209), February 2003.
� “Re-Examining the Role of Colleges and Universities in Providing State-Funded Financial Aid,” Analysis of the 2002-03 Budget Bill (pages E-202-207), February 2002.
Other Budget Considerations
� “Categorical Consolidation” (in CCC), Analysis of the 2002-03 Budget Act (pages E-250-255), February 2002.
� Proposition 98 Primer, February 2005.
Accountability
� “What Role Does the State Play in Public Higher Education?” Issue 7 of LAO’s series, Higher Education: Answers to Frequently Asked Questions, December 2004.
� Analysis of the 2005-06 Budget Bill (page E-155), February 2005.
This report was prepared by
Steve Boilard,
Anthony
Simbol, and
Jennifer Kuhn. The Legislative Analyst's Office (LAO) is a nonpartisan office
which provides fiscal and policy information and advice to the
Legislature. To request publications call (916) 445-4656. This report and others, as well as an E-mail
subscription service, are available on the LAO's Internet site at
www.lao.ca.gov. The LAO is located at 925 L Street, Suite 1000,
Sacramento, CA 95814.
Acknowledgments
LAO Publications
Return to LAO Home Page