November 2006
This report provides our projections of General Fund revenues and expenditures for 2006-07 through 2011-12. It includes our independent assessment of the outlook for California�s economy, demographics, revenues, and expenditures.
Chapter 1 contains our principal findings and conclusions. Chapter 2 presents our economic and demographic projections, Chapter 3 our revenue forecasts, and Chapter 4 our expenditure projections.
Our fiscal projections primarily reflect current-law spending requirements and tax provisions. They are not predictions of future policy decisions by the Legislature, nor are they our recommendations as to what spending and revenue levels should be.
This report, in its twelfth year of publication, reflects the historical mission of the Legislative Analyst�s Office to assist the Legislature with its fiscal planning by assessing the revenues and expenditures of the state.
At the time the 2006-07 budget was passed last June, our longer-term revenue and expenditure projections indicated that California continued to face a significant budget problem. Although we estimated that California would conclude 2006-07 with a General Fund reserve of over $2�billion, we projected that the state would face operating shortfalls (that is, annual differences between revenues and expenditures) in the range of $4.5�billion to $5�billion during the subsequent two fiscal years. Our updated projections suggest a larger reserve in 2006-07 than we previously forecast, but also larger projected operating shortfalls in the out years. Specifically:
The current year (2006-07) is projected to end with a reserve of about $3.1�billion, up about $1�billion from the $2.1�billion estimate contained in the 2006-07 Budget Act.
However, expenditures will exceed revenues by $5.5�billion in 2007-08 and $5�billion in 2008-09, absent corrective actions. The 2006-07 carryover reserve could be used on a one-time basis to address over one-half of the projected 2007-08 shortfall, but would be exhausted thereafter. Thus, other actions will be needed to keep the budget in balance.
In subsequent years, the operating shortfalls decline-particularly after repayments associated with the deficit-financing bonds (which were approved by the voters in March�2004) cease at the conclusion of 2009-10. Nevertheless, they remain over $1.2�billion through the end of the forecast period.
The 2006-07 budget adopted last June included increases in all major program areas, but particularly education. Under the signed budget, the state entered the year with a carryover reserve of over $9�billion. Revenues were expected to total $94�billion, while expenditures were estimated to be $101�billion. The resulting $7�billion operating shortfall during the year was expected to draw down the carryover reserve, leaving the state with a 2006-07 year-end reserve of $2.1�billion (prior to the approval of various collective bargaining agreements).
Figure�1 shows the key changes that have taken place since the 2006-07 Budget Act was adopted last June. These changes include the following:
|
Figure 1 Effect of Recent Developments on 2006‑07 Budget Year-End Reserve |
||
|
(In Millions) |
||
|
|
|
|
|
2006‑07 Budget Act (June 2006) |
|
$2,102 |
|
Revenue Increases |
|
|
|
2005‑06 and prior years |
$408 |
|
|
2006‑07 |
474 |
|
|
Subtotal (increase to reserve) |
|
$882 |
|
Expenditure Changes (2005‑06 and 2006‑07 Combined) |
|
|
|
Proposition 98 |
-$138 |
|
|
Medi-Cal |
-433 |
|
|
Timing differences in capital outlay spending for levees |
-200 |
|
|
Employee compensation |
271 |
|
|
Reduced state operations savings |
194 |
|
|
Increased fire suppression costs |
92 |
|
|
In-Home Supportive Services |
124 |
|
|
Other (net) |
18 |
|
|
Subtotal (increase to reserve) |
|
$73 |
|
LAO Revised Estimate (November 2006) |
|
$3,057 |
Revenues Up by $882�Million. The 2006-07 Budget Act revenue totals assumed that California�s economic and revenue growth would slow, primarily due to the state�s real estate downturn. Although recent economic developments are generally consistent with this earlier projection, our revised revenue estimates are up modestly by $882�million from the 2006-07 Budget Act totals. This reflects the combined effect of two factors. First, tax receipts for 2005-06 and prior years exceeded the estimate by $408�million. Second, we are forecasting that revenues in the current year will exceed the 2006-07 Budget Act forecast by $474�million, reflecting stronger-than-expected personal income tax receipts related to investment income partially offset by softer-than-expected sales tax and corporate tax receipts.
Expenditures Down by $73�Million. This is the net result of increases in some areas and decreases in others. Increases include higher employee compensation costs (due to the approval of collective bargaining contracts), as well as additional costs for fire suppression, state operations, and In-Home Supportive Services. Decreases are estimated in prior-year Medi-Cal spending and in Proposition�98.
Increase in Year-End Reserve. Taking into account both the higher revenues and higher net costs, we estimate that the 2006-07 year-end reserve will increase from the $2.1�billion assumed in the 2006-07 Budget Act to our revised estimate of $3.1�billion.�
Projected Net Shortfall of $2.4�Billion. Figure�2 shows our updated projection of the General Fund condition through 2007-08, using the assumptions outlined in the following box. We forecast that revenues will climb to $100.1�billion (an increase of 5.6�percent from the current year) and that expenditures will total $105.6�billion (a growth of 3.4�percent), resulting in a $5.5�billion operating shortfall during the year. After taking into account the $3.1�billion carryover reserve available from 2006-07, the General Fund would be left with a deficit of $2.4�billion, absent corrective actions.
|
Figure 2 LAO Projections of General Fund Condition |
|||
|
2005‑06 Through 2007‑08 (In Millions) |
|||
|
|
2005‑06 |
2006‑07 |
2007‑08 |
|
Prior-year fund balance |
$9,311 |
$10,868 |
$3,578 |
|
Revenues and transfers |
93,357 |
94,828 |
100,120 |
|
Total resources available |
$102,668 |
$105,696 |
$103,698 |
|
Expenditures |
$91,800 |
$102,118 |
$105,588 |
|
Ending fund balance |
$10,868 |
$3,578 |
-$1,890 |
|
Encumbrances |
$521 |
$521 |
$521 |
|
Reserve |
$10,347 |
$3,057 |
-$2,411 |
|
Budget Stabilization Account |
� |
$472 |
� |
|
Special Fund for Economic Uncertainties |
$10,347 |
2,585 |
� |
Basis for Our EstimatesOur revenue and expenditure forecasts are based primarily on the requirements of current law, including constitutional requirements (such as Proposition�98) and statutory requirements (such as for program qualifications and cost-of-living adjustments). In other cases, the estimates incorporate effects of projected changes in caseloads, prices, federal requirements, court orders, and other factors affecting program costs. We have not included funding to cover the Governor�s �compact� with higher education, as the Legislature has taken no statutory action to implement such an agreement during this multiyear period. Rather, our estimates for higher education are based on projected enrollment and inflation-related increases. Fully funding the compact would require added annual expenditures beyond those we are projecting, reaching over $900�million by the final year of the forecast period. Accelerated Deficit-Financing Bond Repayments Included in Our Estimates. In March�2004, the voters approved Proposition�58, which among other things requires annual transfers of revenues to a newly created reserve fund called the Budget Stabilization Account (BSA). These transfers are equal to 1�percent of General Fund revenues in 2006-07, 2�percent of revenues in 2007-08, and 3�percent of revenues in 2008-09 and annually thereafter until the balance of the BSA reaches $8�billion, or 5�percent, whichever is greater. By law, one-half of the annual transfers are dedicated to the accelerated repayment of outstanding deficit-financing bonds. (The main source of deficit-bond repayment is a quarter-cent special fund sales tax.) The Governor may suspend the transfers to this fund through an executive order. The administration has stated its intent to fund these supplemental payments toward the accelerated repayment of the deficit-financing bonds. Therefore, our expenditure estimates include the portion of the annual BSA transfers that are dedicated to deficit-financing bond repayments. Projections, Not Predictions. Our estimates are not predictions of what the Legislature and Governor will adopt as policies and funding levels in future budgets. Rather, our estimates are intended to be a reasonable �baseline� projection of what would happen if current-law policies were allowed to operate in the future. In this regard, we believe that our forecast provides a meaningful starting point for legislative deliberations involving the state�s budget so that corrective actions can be taken to ensure that the state�s fiscal house is in order. |
Our longer-term revenue and expenditure forecasts are detailed in �Chapter 3� and �Chapter 4,� respectively. Figure�3 shows the effects of these projections on the state�s operating balance. Operating shortfalls result in all years. The figure breaks out these operating shortfalls into two categories: (1) the portion due to each year�s difference between current-law spending on state programs and current-law state revenues, and (2) the portion due to planned repayments of past budgetary debt. This debt was incurred to avoid adopting additional budget-balancing spending cuts or revenue augmentations at the time. Budgetary debt refers to the deficit-financing bonds (Proposition�57), as well as other borrowing from special funds, local governments, and schools.
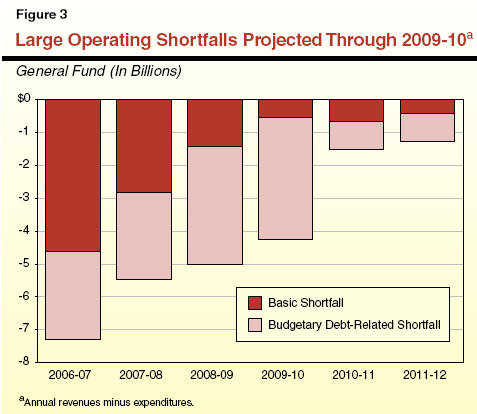
The figure shows that the state would face operating shortfalls of $5�billion in 2008-09 and $4.2�billion in 2009-10, before seeing the annual imbalance drop to below $1.5�billion in each of the final two years. The main factor responsible for the decline in the annual operating shortfall between 2009-10 and 2010-11 is that the $11.3�billion in previously issued deficit-financing bonds are scheduled to be fully repaid by the conclusion of 2009-10. The annual repayments for these bonds-both from the quarter-cent sales tax allocated for this purpose and the supplemental payments from the Budget Stabilization Account (BSA) as provided for in Proposition�58-are projected to total approximately $3�billion in both 2008-09 and 2009-10. The completed repayment of these bonds eliminates the need for these expenditures and, thus, reduces the operating shortfall by this amount.
Majority of Shortfalls Due to Budgetary Debt Repayment. As indicated in Figure�3, over 70�percent of the operating shortfalls in 2007-08 through 2011-12 are related to the repayment of past budgetary debt. Absent these payments, the shortfall between current-law expenditures on programs and current-law revenues would be $2.8�billion in 2007-08, $1.4�billion in 2008-09, and roughly $500�million in the subsequent three years. While the repayments represent real obligations to the state, the Governor and Legislature do have some control over the timing of these repayments.
It may be tempting for the state to rely heavily on the large carryover reserve balance and other one-time solutions to get through 2007-08. However, failing to meaningfully address the long-term fiscal imbalance would leave the state in a precarious position. At this advanced stage of the current economic expansion, California should be running projected operating surpluses instead of deficits-particularly in light of the risks posed by the current real estate downturn to the overall economy and revenues. In addition, the state faces significant fiscal pressures related, for example, to the funding of future health care costs for its retirees, and risks greater-than-expected cost increases stemming from the three federal court cases related to its correctional health care system. Given these factors, the Legislature should take significant steps now toward addressing the budget imbalance.
Given the narrowing but still-significant budget shortfalls we project over the next five years, it is appropriate to rely on a mix of solutions to address the structural budget shortfall. Elements of a multiyear budget balancing strategy are outlined in Figure�4.
|
Figure 4 Elements of a Multiyear Budget Balancing Strategy |
|
|
|
� Budget Savings and Revenue Increases |
|
� Targeted program savings. |
|
� Cost-of-living adjustment reductions or suspensions. |
|
� Funding redirections. |
|
� Tax compliance, fees, and targeted revenue increases. |
|
� Reduced Supplemental Repayments on Deficit-Financing Bonds |
|
� Continue regular schedule of debt payments. |
Savings and Revenue Solutions. The state has various ways to achieve ongoing and one-time expenditure savings and revenue increases. Options in this area include program reductions, the reversion of unused funds, and funding redirections (such as using fee support, rather than the General Fund, for various activities where there is a direct benefit to the user). As one specific example of a potential reversion, in �Chapter�4� we identify Proposition�98 funds that will likely be unneeded because of lower-than-budgeted community college enrollment.
Ongoing savings could also be achieved through the reduction or suspension of cost-of-living adjustments (COLAs)-which are provided in a variety of areas including health, social services, and trial courts. A 1�percentage point reduction in non-Proposition�98 COLAs for a single year would result in annual savings of roughly one-half billion dollars.
On the revenue side, options include additional compliance measures, elimination or modification of tax expenditures, or other changes to current tax laws. Specific examples in this area include continued suspension (or elimination) of the teachers� tax credit, and an extension of changes adopted in 2004 related to the application of the sales and use tax to out-of-state purchases of vessels, vehicles, and aircraft.
If spending reductions and/or revenue increases are not adequate to close the budget gap, one alternative would be to reduce supplemental deficit-bond repayments, as discussed below.
Reduce Supplemental Debt Repayments. While repayment of budgetary debt should remain a high priority, it is also the case that the repayments scheduled over the next five years are �front loaded.� As shown in Figure�3, such repayments (primarily the quarter-cent sales tax and supplemental BSA amounts) account for an average of $3�billion per year in 2007-08 through 2009-10, before dropping to less than $900�million in the subsequent years of the forecast. Given the large size of the operating shortfalls facing the state in 2007-08 through 2009-10, the Legislature may wish to spread out some of these repayments over a longer time frame. In particular, the state could suspend some or all of the annual supplemental payments for the deficit-financing bonds, temporarily saving up to $1�billion in 2007-08, $1.6�billion in 2008-09, and $1.7�billion in 2009-10. Spreading out these repayments would result in added costs in future years because it would take longer to pay off the outstanding deficit-financing bonds. However, such a strategy may be necessary if the magnitude of program reductions and/or revenue increases necessary to close the budget gap can not be achieved. It would also be preferable to alternatives involving new higher-cost borrowing. An example of such borrowing would be the issuance of pension obligation bonds (which the administration is assuming will occur in 2007-08).
Although it is reasonable to use a mixture of solutions in addressing the multiyear shortfalls facing the state, it also is important to remember that the state�s structural budget problem will only be fully addressed once ongoing revenues and expenditures are brought into line and budgetary debt is repaid. To this end, the Legislature should take actions to maximize the amount of ongoing solutions that it adopts in crafting its 2007-08 budget.
Economic and demographic developments are important determinants of California�s fiscal condition, primarily through their impacts on state revenues and expenditures in such areas as education, health, social services, corrections, and transportation. This chapter presents our economic and demographic projections for calendar years 2006 through 2012, which will affect California�s budgetary condition during fiscal years 2006-07 through 2011-12.
The recent decline in energy prices has �breathed new life� into the U.S. and California economic expansions, which had appeared to be fading as of late last summer. Despite this favorable development, however, we expect that national and state economic growth will remain subdued through 2007, as the major recent declines in the real estate sector continue to reverberate through the economy. Figure�1 summarizes the details of our economic forecasts for the nation and California. In the subsequent sections, we discuss in more detail the major factors underlying our outlook.
|
Figure 1 The LAO's Economic Forecast |
|||||||
|
Percentage Change (Unless Otherwise Indicated) |
|||||||
|
|
2006 |
2007 |
2008 |
2009 |
2010 |
2011 |
2012 |
|
United States |
|
|
|
|
|
|
|
|
Real gross domestic product |
3.3 |
2.2 |
3.3 |
3.3 |
3.2 |
2.9 |
2.5 |
|
Personal income |
6.7 |
5.5 |
5.6 |
6.0 |
5.8 |
5.5 |
5.0 |
|
Wage and salary jobs |
1.4 |
1.1 |
1.4 |
1.6 |
1.4 |
1.2 |
0.8 |
|
Consumer Price Index |
3.1 |
2.3 |
2.2 |
2.1 |
2.2 |
2.3 |
2.5 |
|
Unemployment rate (%) |
4.7 |
5.0 |
4.9 |
4.7 |
4.5 |
4.5 |
4.7 |
|
Housing starts (000) |
1,828 |
1,594 |
1,669 |
1,704 |
1,739 |
1,743 |
1,691 |
|
California |
|
|
|
|
|
|
|
|
Personal income |
6.5 |
5.4 |
5.9 |
6.2 |
6.1 |
5.7 |
5.5 |
|
Wage and salary jobs |
1.8 |
1.3 |
1.6 |
1.8 |
1.8 |
1.6 |
1.5 |
|
Taxable sales |
4.6 |
4.7 |
5.8 |
5.9 |
5.7 |
5.2 |
5.1 |
|
Consumer Price Index |
3.9 |
3.1 |
2.5 |
2.5 |
2.6 |
2.7 |
2.8 |
|
Unemployment rate (%) |
4.9 |
5.2 |
5.0 |
4.8 |
4.7 |
4.8 |
4.9 |
|
Housing permits (000) |
173 |
158 |
165 |
175 |
174 |
175 |
173 |
After expanding by well over 3�percent in both 2004 and 2005, U.S. gross domestic product (GDP) growth decelerated sharply over the first three quarters of 2006. As shown in Figure�2, real GDP growth eased from 5.6�percent (seasonally adjusted annual rate) during the first quarter to just 1.6�percent during the third quarter of the year.
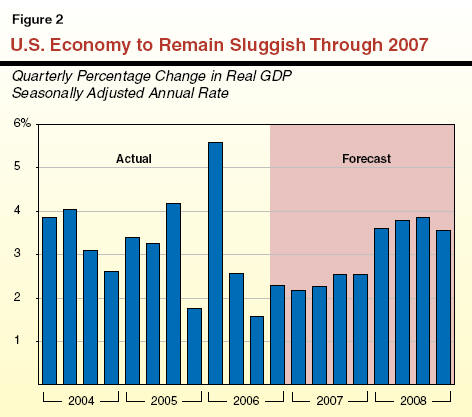
The main cause of the slowdown has been a drop in the residential real estate sector, where new housing starts fell from an annual rate of 2.2�million units in January to under 1.6�million by September. In addition, the combination of higher interest rates and soaring gasoline prices was beginning to adversely affect consumer spending, particularly on �big ticket� durable goods such as automobiles. Another concern was that rising energy costs were starting to boost prices of other goods and services that use energy in the economy. These rising inflationary pressures were leading to concerns that the Federal Reserve Board would need to further raise interest rates even as the economy was slowing.
Welcome Decline in Energy Prices. As shown in Figure�3, oil prices dropped sharply beginning in late summer, falling from a per barrel peak of $78 in July to $58 as of early November. The decline is attributable to several factors, including rising global supplies, fewer-than-expected supply disruptions, and slowing worldwide demand. A key related factor was that the hurricane season in the Gulf of Mexico turned out to be much less severe than predicted.
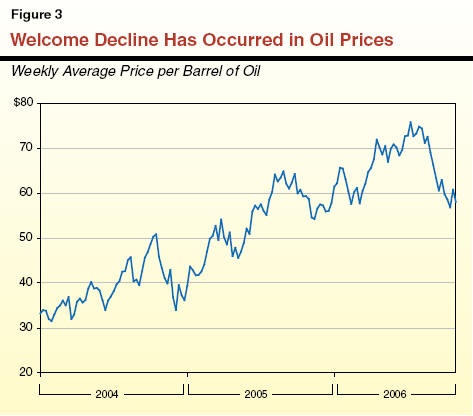
The retreat in oil prices has had major impacts on gasoline prices, which fell from a peak $3.05 per gallon in mid-2006 ($3.35 in California) to about $2.20 per gallon as of early November ($2.35 in California). The lower oil prices have also resulted in a drop in contract prices for heating fuel, which implies lower energy bills this winter.
This decline in gasoline prices has provided a much-needed boost to discretionary incomes of households and businesses, has helped boost stock market prices and consumer confidence levels, and has reduced inflationary pressures. All of these are welcome developments for the economy, and have significantly reduced the odds of a recession developing in late 2006 or early 2007.
Despite the recent oil price decline, we expect the housing downturn to depress the overall economy and hold GDP growth to between 2�percent and 2.5�percent through much of 2007, before rebounding to between 3�percent and 3.5�percent during the subsequent years of the forecast. The main components of this forecast are as follows:
Real consumer spending growth will slow from 3.2�percent in 2006 to 2.8�percent in 2008, before partially rebounding to an average annual pace of around 3.3�percent during the balance of the forecast period.
Residential construction is forecast to fall by 4.4�percent in 2006 and by a further 13�percent in 2007, before stabilizing in 2008 and growing modestly over the balance of the forecast period.
Real business investment growth will slow from 8�percent in 2006 to 6�percent in 2007, and further to around 5�percent per year over the balance of the forecast period. Spending on information technology (IT) equipment and software is expected to remain healthy over the forecast period, while spending on structures is expected to moderate after 2007. The continued strength in IT spending is positive for California, which has a large number of firms and workers which design and produce computer and software products.
Oil prices are expected to rebound slightly from current levels and average about $60 to $65 per barrel during the forecast period. Gasoline prices will continue to follow seasonal patterns, rising in the spring and summer and falling in the fall and early winter. However, the annual summertime peaks are forecast to remain in the range of $2.60 per gallon, compared to the over $3.00 per gallon this past summer.
Inflation will continue to subside in late 2006 and during 2007, reflecting the easing of energy-related pressures, continued intense worldwide competition by sellers of a variety of products and services, and ongoing worker productivity gains. We forecast that year-to-year Consumer Price Index (CPI) growth will ease from a peak of 4�percent in mid 2006 to below 2�percent by late 2007, thereby reducing the annual average growth from 3.1�percent in 2006 to 2.3�percent in 2007. Thereafter, it will stabilize in the range of 2�percent to 2.5�percent over the balance of the forecast period.
Interest rates are projected to dip modestly in 2007 as economic growth and inflation eases, but then rebound to near-current levels in 2008 and beyond. The three-month Treasury bill rate is forecast to average about 4.5 percent over the forecast period. By comparison, the ten-year Treasury note yield is projected to average slightly over 5 percent during the same period, reflecting both the risk premium and longer term expectations for somewhat higher economic growth and inflation.
The current situation and outlook for California are similar to the nation as a whole. The state�s economy slowed sharply this summer, but is expected to partly rebound late this year and continue to grow at a subdued pace in 2007, before accelerating to a more moderate pace in 2008 and thereafter.
After healthy gains in 2004 through early 2006, a variety of economic indicators suggest that economic growth slowed for the state as 2006 progressed:
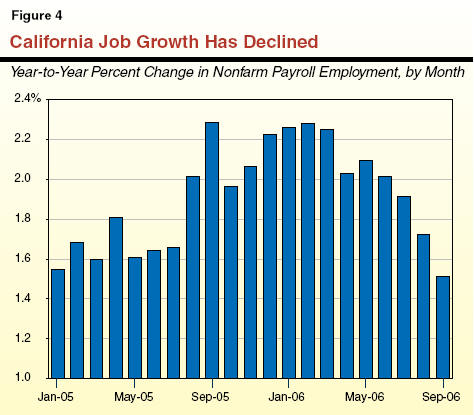
Wage and salary employment growth slowed from a 2.3�percent year-over-year increase in January 2006 to only a 1.5�percent rise as of September (see Figure�4).
Personal income tax withholding payments (which reflect the combination of wages, bonuses, and stock options) were up by over 10�percent in the first half of 2006, but slowed sharply to a less-than 5�percent gain in the third quarter of the year.
Taxable sales growth rates (which are barometers of household and business spending) slowed from 8�percent in the first quarter to near zero by the third quarter of the year.
The key forces behind the economic slowdown that has been experienced in California are the same as for the nation-namely, sharply declining real estate markets and soaring gasoline prices. In fact, the intensity of these negative forces was even greater in California than in the rest of the country, reflecting (1) the state�s higher-than-average gasoline prices and gasoline consumption, and (2) its more cyclical real estate market, which expanded more in the boom years and is falling by more than the rest of the country during the current downturn.
California�s real estate related industries-which include developers, contractors, real estate brokers, lenders, title companies, and insurers-account for roughly 15 to 20�percent of the state�s private sector economy. Changes in real estate asset values and mortgage refinancing activity can also have substantial indirect impacts on other sectors of the economy, such as consumer spending.
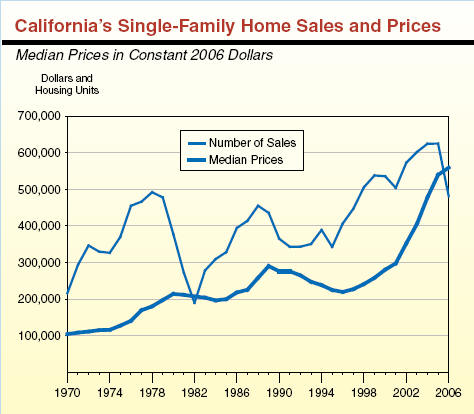
As discussed in the accompanying box, California experienced an unprecedented boom in its real estate markets between 2001 and 2005. During this period, inflation-adjusted home prices doubled, sales reached all time highs, and new construction reached the highest levels in nearly 15 years. These increases boosted employment, income, and spending in California�s overall economy during this period.
Recent Developments. California�s real estate market peaked in mid-2005. Over the subsequent year, home sales and new construction activity fell by proportionally more than the rest of the nation, and the buildup of unsold home inventories suggests that further softness in building activity is in store. Home prices have flattened out, and are starting to decline in some geographic regions of the state.
Implications of Reductions. The slowdown in real estate is having a major adverse impact on the incomes of realtors, developers, contractors, and real estate lenders in California. It is the single largest factor behind the slowdown in personal income growth during the second half of 2006. The reduction in housing prices will also financially squeeze recent home purchasers that have used variable rate loans to finance home purchases. This is of particular concern for the large proportion of homebuyers in 2004 and 2005 that financed the rising costs of homes with nontraditional or �exotic� mortgages, many of which had low initial payments that are scheduled to adjust upward over the next several years. By some accounts, over 60�percent of homes purchased in California during 2005 were financed with such nontraditional loans-roughly double the average for the rest of the nation.
The reduction in home prices implies that homeowners facing large payment increases when these loans reset will not have sufficient equity to refinance their loans and avoid higher monthly payments. Given the considerable dollar size of the mortgages involved, the anticipated rise in interest rates implies large monthly payment increases-potentially exceeding $1,000 per month. This suggests that less discretionary income will be left over for other purchases. It also raises the risk of �distress sales� and foreclosures in the years ahead, which in turn will have a dampening effect on economic growth during this period.
California�s Housing MarketVolatility Is CommonCalifornia�s real estate market has historically been characterized by sudden, rapid increases in housing prices and sales activity, followed by extended periods of stagnant or declining home prices. But even by California standards, the recent growth in real estate prices has been remarkable. Inflation-adjusted existing home prices doubled between the beginning of 2001 and the close of 2005 (see accompanying figure). This is easily the fastest recorded growth over such a brief period since the collection of comparable data began in 1968. For example, inflation-adjusted home prices grew by only 40�percent over the entire two decades from 1981 through 2001. Other housing market measures such as new home construction and home sales also increased rapidly over this recent period, although not quite as rapidly as prices.
Price Increases Were WidespreadThe housing boom affected all California regions. Historically low-priced areas like the Central Valley and the inland northern counties showed percentage growth in housing prices just as high as coastal regions. Fresno County home prices grew 110�percent from 2001 through 2006-as fast as home prices in Los Angeles County. In percentage terms, prices in far-northern Siskiyou County grew more rapidly than prices in San Diego. But the Boom Is Now OverRecent housing data show that the boom has ended. Home sales and construction activity have fallen by almost 25�percent over the past year. Home prices have clearly reached a plateau, but have yet to fall significantly. Unlike markets for more liquid assets such as stocks, housing markets typically show a lag of up to a year or two between drops in sales levels and significant declines in prices. This occurs because homeowners tend to delay sales or take homes off the market while waiting for prices to rise again. What Will Happen?Based on the experience of previous housing cycles in California, we expect that several years of declining real price levels will now occur throughout much of the state. It is difficult to say, however, exactly how long the market slump will last, or how large any fall in home prices will be. Inflation-adjusted prices fell for four straight years from 1980 through 1984, for a total decline of 8�percent, and real home prices dropped for five straight years and a total of 24�percent during the 1991 through 1996 recession. These two previous housing declines were both triggered by broader economic factors-a substantial increase in interest rates during the early 1980s, and a major decline in the aerospace industry during the 1990s. Currently, the nonhousing portion of the state�s economy is in generally good shape, with most industries expanding and interest rates unlikely to rise sharply. For this reason, we are estimating only a moderate slowdown in the housing market-one that is considerably less severe than the state experienced during the 1990s. But it is also true that current housing prices are at unprecedented levels when compared to income. The Housing Affordability Index compiled by the California Association of Realtors shows record low levels of California homebuyers able to afford a typical single-family home using a conventional mortgage and down payment amount. In addition, there are potential adverse effects lurking associated with the more exotic financing instruments that have been used to facilitate many recent home purchases. There is thus a real risk of a more severe drop in housing prices and sales than we are estimating. Any such development would of course pose a serious threat to the strength of the economy�s continued expansion.
|
Reduced home sales and housing prices have already resulted in slowdowns in household spending, particularly on such items as home furnishings and appliances. They are also having a negative impact on those manufacturing industries related to home construction, such as wood products, cement, steel fabrication, and furniture. We expect these impacts to continue during the next 12 months.
Despite the ripple effects noted above, job growth, wages, and business earnings in most California industries outside of the real estate sector have remained generally healthy. This reflects a variety of factors, including:
Solid growth in international trade, which is benefiting California manufacturers and farmers that sell abroad, as well as transportation, warehousing, and distribution activities associated with trade activity through California�s ports.
Continued strength in information-related industries (including motion pictures, broadcasting, sound recordings, publishing, and Internet service providers).
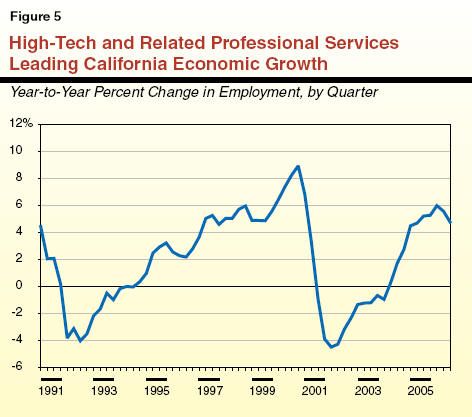
Healthy growth in California�s high-tech and related professional services industry. This includes software development, computer systems and design, biotechnology, and pharmaceuticals. As shown in Figure�5, this industry, which now accounts for more than one million jobs, has been growing strongly since mid-2003, and has added about 50,000 jobs over the past 12 months.
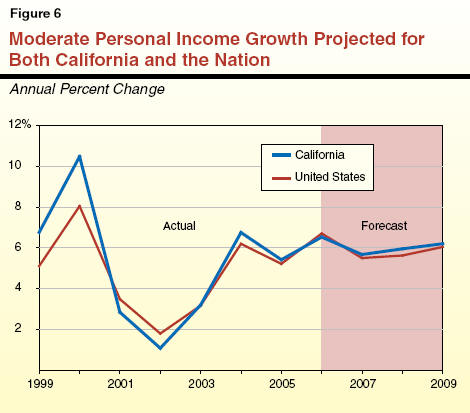
We expect current trends to continue through next year in California. That is, real estate-related activity will continue to fall, but other sectors-particularly those related to international trade, business research and development, and investment in high technology products and services-will continue to expand at a healthy pace. The net impact of these trends is that aggregate personal income and employment will expand at a somewhat subdued rate in 2007, but then accelerate in 2008 and beyond, once the real estate sector stabilizes. As indicated in Figure�6, the projected pattern of future California growth in personal income is similar to that of the nation as a whole.
The main risks to our economic outlook for the nation and state continue to be negative developments in the energy and/or housing markets. Regarding energy costs, while oil inventories have recently climbed significantly, the markets are still vulnerable to unexpected supply disruptions or rising political tensions in various global regions. Such developments could result in a quick reversal of recent downward price trends, placing upward pressures on U.S. inflation and interest rates. On the housing front, California is in uncharted territory in terms of the recent extent of home price appreciation. Our forecast assumes that price and construction declines remain fairly modest by historical standards, reflecting the overall positive outlook for California�s economy. However, steeper reductions could occur, which in turn would further depress economic growth in this state over the next couple of years.
California�s population currently totals over 37�million persons. During the six-year forecast period covered in this report, Figure�7 shows that the state�s population growth is projected to average about 1.2�percent annually. In terms of numbers of people, this modest annual growth rate translates into about 465,000 people and is roughly equivalent to adding a new city the size of Long Beach to California each year. As a result, California will add roughly 3�million people over the forecast interval and reach over 40�million by 2012.
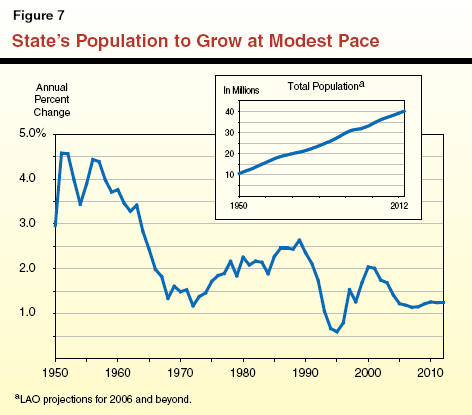
The population growth rate we are projecting is somewhat slower than that experienced in the late 1990s and early 2000s, when growth was averaging about 1.6�percent. This reflects both the dampening effects of higher home prices on in-migration and reduced birth rates.
California�s population growth can be broken down into two major components-natural increase (the excess of births over deaths) and net in-migration (persons moving into California from other states and countries, minus those leaving California for out-of-state destinations). On average, these two components have tended in the past to contribute about equally over time to the state�s population growth. However, their relative shares can vary significantly from one year to the next depending largely on the strength of the net in-migration component-by far the most volatile element.
Natural Increase. We project that the natural-increase component will average 318,000 new Californians annually over the forecast period. This net natural gain reflects an average of around 576,000 births annually partially offset by about 258,000 deaths annually.
Our forecast incorporates the well-documented trend of declining birth rates that has been in effect for essentially all ethnic groups in recent years in California. Despite these declining birth rates, however, the number of new births in our forecast actually trends up a bit through 2012. This is due to significant growth in the female population of child-bearing age groups in the faster-growing segments of California�s population, including Hispanic and Asian women. As a result, even after accounting for growth in the number of deaths occurring annually in California, we project that the natural increase component will grow slightly during the latter half of the forecast period.
Net In-Migration. We project that combined domestic and foreign net in-migration will average roughly 145,000 annually over the next six years. This is less than during the latter half of the 1990s and in the early 2000s when annual net in-migration averaged about 260,000. It also is considerably less than the projected 318,000 natural-increase component noted previously. Regarding this in-migration:
Most of the net in-migration we are projecting reflects foreign net in-migration from other nations. This component has been relatively stable over the past decade and has proved to be less sensitive to the economy than domestic population flows between states. We forecast the net foreign in-migration will be fairly constant through 2012, averaging about 165,000 annually.
Regarding domestic net in-migration, preliminary data suggest that this is likely to be negative in 2006 (that is, more people left California for other states than flowed in from them). In large part, this is attributable to continued modest job growth and high home prices. Our economic forecast is not strong enough to induce significantly more net domestic in-migration from other states. Thus, we do not foresee a return to net interstate population in-flows for a couple of years, after which only modest net domestic in-flows of 5,000 annually are anticipated. Over our entire forecast period, net domestic out-migration will average 20,000.
Figure�8 shows our population growth projections by broad age categories, including both numerical and percentage growth.
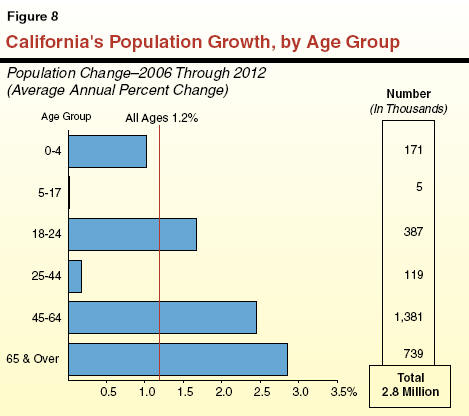
�Baby Boomers� Swelling 45 to 64 Age Group. The 45 to 64 age group (largely the baby boomers) continues to be by far the fastest growing segment of the population numerically and the second-fastest percentage wise. Nearly 1.4�million new people are expected to move into this age category over the next six years for an annual average growth of 2.5�percent.
Slow Growth for Children. At the other extreme, slow growth is anticipated for preschoolers and the K-12 school-age population. This reflects several factors. One is the movement of children of the �baby boom� generation beyond the upper-end of the 5 to 17 age group, which partially explains the above-average growth in the 18 to 24 age category. Other factors include the slower rate of net in-migration, and the decline in birth rates in recent years that has reduced the number of children moving into the preschool and school-age categories.
Rapid Growth for the Elderly. The single-fastest-growing age group percentage wise and second-fastest numerically is the 65 and over category, reflecting the well-known �graying� of the population. This cohort is expected to increase at an annual average pace of 2.9�percent.
These various age group demographic projections can have significant implications for the state�s revenue and expenditure outlook. For example, strong growth of the 45 to 64 age group generally benefits tax revenues since this is the age category that routinely earns the highest wages and salaries. Likewise, the growth in the young adult population affects college enrollments, those for the 0 to 4 and 5 to 17 age groups drives K-12 enrollment growth, and that for the elderly impacts medical care costs.
In addition to age, projected population growth will also differ markedly along other dimensions. For example:
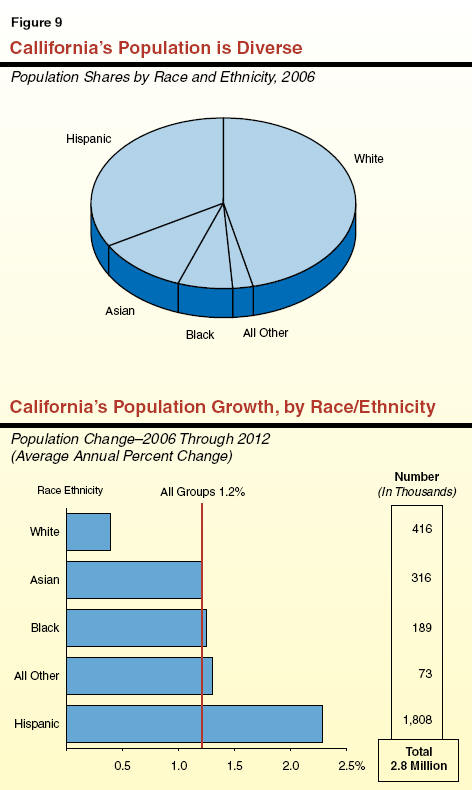
Racial/Ethnic Variation. Figure�9 indicates that California�s population is very diverse in terms of its racial/ethnic composition. In addition, the amounts and rates of population growth along these dimensions will differ significantly for different groups. The Hispanic population is forecast to experience especially strong growth, averaging over 2.3�percent annually and accounting for 65�percent of Californian�s total population growth between 2006 and 2012.
Geographic Variation. Rates of growth will be above average for the state�s Central Valley, Inland Empire, and foothills areas. This will occur as the availability of land allows population to continue to �fill in� and attracts intrastate migrants from the more-congested coastal areas where growth will necessarily be constrained. Such high-growth regions will increasingly face new challenges in providing the public services and infrastructure to accommodate growth.
The revenues that finance California�s state General Fund budget come from numerous sources, including taxes, fees, licenses, interest earnings, loans, and transfers. However, almost 95�percent of the total is attributable to the state�s �big three� taxes-the personal income tax (PIT), the sales and use tax (SUT), and the corporation tax (CT). In this chapter, we summarize our updated General Fund revenue projections and provide detail behind our key revenue-related assumptions. We also discuss the outlook for property taxes (see shaded box on page 24). Although a local revenue source, these have significant implications for the state budget due to their effects on General Fund spending on Proposition�98.
Preliminary estimates indicate that revenues in 2005-06 and prior years exceeded the budget estimate by over $400�million. However, revenue trends for the first four months of 2006-07 are more mixed, with collections from PIT exceeding estimates but receipts from SUT and CT falling slightly below estimates.
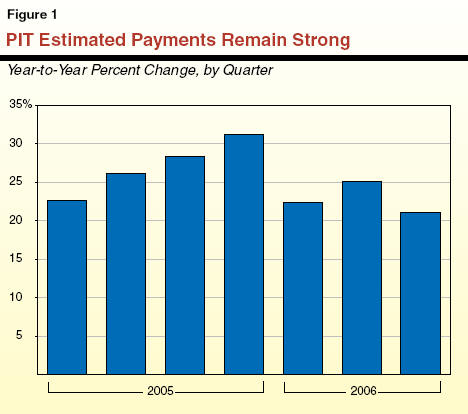
The most positive cash-related development has been the continued strength in PIT quarterly estimated payments. These payments are related to earnings from volatile non-wage sources, such as investment income and business income (such as for sole proprietors, partnerships, limited liability companies, and Subchapter S corporations). We had been concerned that these payments would slow sharply in the second half of 2006 as economic growth in California subsided. However, as shown in Figure�1, they have remained robust, increasing by more than 20�percent in the third quarter of calendar year 2006 compared to the same period of 2005. In addition to their direct impact on revenues in early 2006-07, the strong quarterly prepayments have often been early indicators of similarly strong final payments made the following April. We believe that these gains are primarily attributable to healthy growth in stock market-related capital gains.
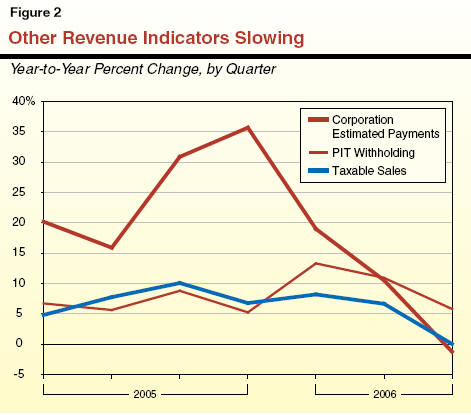
The economic slowdown has had a significant adverse impact on other General Fund revenue sources. As indicated in Figure�2, the year-to-year increases in personal income tax withholding (which is tied to wages), quarterly estimated payments from corporations, and taxable sales have subsided as 2006 has progressed. It should be noted, that the budget act had assumed significant slowdowns in receipts from these sources. Moreover, the weak performance in the third quarter is partly due to temporary factors. For example, the small year-to-year increase in corporate estimated payments is partly attributable to extraordinarily large one-time payments from companies in the utilities and telecommunications industry in 2005. Even after taking these factors into account, however, the recent slowdown in growth from these sources is significant. It suggests that the reduction in real estate-related activity is taking a significant toll on wages, sales, and profits in California.
The bottom-line impact of the recent cash and economic developments is a modest increase in the revenue outlook relative to the 2006-07 Budget Act forecast. Figure�3 shows our updated revenue estimates for the prior year (2005-06) and current year (2006-07), and compares them to the projections assumed in the 2006-07 Budget Act. Figure�4 shows our revenue projections for the entire forecast period, ending in 2010-11.
|
Figure 3 Revised LAO Revenues for 2005-06 and 2006-07 Compared With 2006-07 Budget Act |
|||||||
|
(In Millions) |
|||||||
|
|
|
2005‑06 |
|
|
|
2006‑07 |
|
|
Revenue Source |
Budget Act |
LAO |
Difference |
|
Budget Act |
LAO |
Difference |
|
Personal Income Tax |
$49,555 |
$49,980a |
$425a |
|
$50,885 |
$52,000 |
$1,115 |
|
Sales and Use Tax |
27,211 |
27,411 |
200 |
|
28,114 |
27,610 |
-504 |
|
Corporation Tax |
10,484 |
10,513 |
29 |
|
10,507 |
10,190 |
-317 |
|
Other revenues and transfers |
5,499 |
5,454 |
-45 |
|
4,848 |
5,028 |
180 |
|
Total Revenues and Transfers |
$92,749 |
$93,357a |
$608a |
|
$94,354 |
$94,828 |
$474 |
|
|
|||||||
|
a Includes $200 million of audit payments due to a timing shift that is offset by an equivalent reduction in the previous year. Note: Detail may not add to total due to rounding. |
|||||||
2005-06 and Prior Years-Up $408�Million. Based on preliminary reports by the state�s tax agencies for 2005-06, we estimate that General Fund revenues and transfers totaled $93.4�billion during the year. As Figure�3 shows, this is up $608�million from the level assumed in the 2006-07 Budget Act. About $200�million of this gain, however, merely involves a revenue shift between years that is related to an audit payment that had been expected in 2005-06 (and thus would have been accrued back to 2004-05) but was actually received in early 2006-07 (and thus is now being accrued back to 2005-06). This $200�million gain in 2005-06 is thus offset by an identical $200�million reduction in the carry-in balance from 2004-05. This leaves a net improvement to General Fund revenues for 2005-06 and prior years combined of $408�million.
2006-07 Revenues-Up $473�Million. We project that General Fund revenues and transfers will total $94.8�billion in 2006-07, a 1.6�percent increase from 2005-06. This low growth rate is partly due to a variety of special factors, including a one-time refinancing of tobacco bonds and a suspension of a transportation-related transfer in 2005-06. This revised total is up $474�million from the estimate contained in the 2006-07 Budget Act. As Figure�3 shows, this difference consists of increases from PIT ($1.1�billion) and the �other revenues and transfers� category ($180�million, mostly from higher tidelands royalties and interest income), partially offset by decreases from SUT ($504�million) and CT ($317�million).
2007-08 Revenues-Modest Growth. As shown in Figure�4, we forecast that total General Fund revenues and transfers will be $100.1�billion in 2007-08, a 5.6�percent increase from the current year. This growth relative to the current year reflects improvement in the overall economy in 2008.
|
Figure 4 The LAO's General Fund Revenue Forecast |
|||||||
|
(Dollars in Millions) |
|||||||
|
Revenue Source |
2005‑06 |
2006‑07 |
2007‑08 |
2008‑09 |
2009‑10 |
2010‑11 |
2011‑12 |
|
Personal Income Tax |
$49,980 |
$52,000 |
$54,930 |
$58,640 |
$62,620 |
$66,890 |
$71,160 |
|
Sales and Use Tax |
27,411 |
27,610 |
29,560 |
31,400 |
33,380 |
35,310 |
37,090 |
|
Corporation Tax |
10,513 |
10,190 |
10,610 |
11,650 |
12,510 |
13,220 |
14,000 |
|
Other revenues and transfers |
5,454 |
5,028 |
5,020 |
5,393 |
5,124 |
5,315 |
5,496 |
|
Total Revenues and Transfers |
$93,357 |
$94,828 |
$100,120 |
$107,083 |
$113,634 |
$120,735 |
$127,746 |
|
(Percentage Change) |
13.6% |
1.6% |
5.6% |
7.0% |
6.1% |
6.2% |
5.8% |
2008-09 Through 2011-12. We project that revenue growth will accelerate modestly in 2008-09, and average about 6.3�percent per year through 2011-12. This is slightly faster than the 5.9�percent average annual increase projected for statewide personal income. We are projecting that PIT revenues will grow moderately faster than statewide personal income, but that other sources will grow slightly less than statewide personal income.
Based on actual cash receipts and preliminary accruals, we estimate that PIT receipts totaled $50�billion in 2005-06, a nearly 17�percent increase from the prior year. We estimate that PIT receipts will grow to $52�billion in 2006-07, a modest 4�percent gain from the prior year. The PIT revenues are projected to grow further to $54.9�billion in 2007-08, a 5.6�percent increase from the current year, and at an average annual rate of 6.7�percent over the balance of the forecast period.
Key Forecast Factors. As noted earlier, our forecast for 2006-07 is up by $1.1�billion relative to the 2006-07 Budget Act forecast. The increase is largely related to the continued strength in quarterly estimated payments through September 2006. It suggests that more of last year�s extraordinary growth in non-wage income is carrying over into 2006 than had been assumed in the 2006-07 Budget Act forecast. The continued strength is consistent with the rise in stock market valuations, as well as industry data suggesting evidence of continued large stock sales by company directors, officers, and founders in California. Even with this improvement, we continue to forecast that PIT growth will be somewhat subdued in 2006-07, reflecting the adverse impacts of the housing decline on real estate-related capital gains and earnings related to sales, construction, and financing of homes. Over the longer term, we forecast PIT liabilities and collections will grow modestly faster than statewide personal income, due to California�s progressive tax rate structure, under which real income levels are subject to higher marginal tax rates.
We estimate that SUT receipts totaled $27.4�billion in 2005-06, a 6.4�percent increase from 2004-05. The updated total is up $200�million from the 2006-07 Budget Act estimate, reflecting higher-than-expected cash receipts late in the fiscal year. We forecast that SUT receipts will total $27.6�billion in 2006-07-a marginal 0.7�percent increase from 2005-06-and reach $29.6�billion in 2007-08, a 7.1�percent increase from the current year. Over the balance of the forecast period, SUT revenues are projected to increase at an average annual rate of 5.8�percent.
Key Forecast Factors. The main determinant of SUT receipts is taxable sales. About two-thirds of these sales are related to retail spending by consumers, while the remainder is related both to building materials that go into new construction and to business-to-business transactions that are taxed because the purchaser is the item�s final consumer.
Taxable sales slowed sharply during the first three quarters of calendar year 2006. The slowdown appears to be related to the downturn in real estate, which is negatively affecting sales related to building materials and home furnishings. A second factor is the run-up in gasoline prices this past spring and summer, which depressed consumer spending, particularly on light trucks and SUVs.
We expect that taxable sales will rebound modestly from recent levels during the next several quarters, reflecting (1) the positive effects of lower energy prices on household discretionary incomes, (2) a relatively slower rate of decline in home construction, and (3) continued strength in business spending on new facilities and equipment. On an annual average basis, we forecast that taxable sales will increase by 4.6�percent during 2006 and 4.7�percent in 2007, before rebounding to a trend rate of between 5.5�percent and 6�percent for the balance of the forecast period.
A second factor affecting the strength of General Fund sales tax receipts is the transfer of sales taxes on gasoline to a special fund for transportation (the so-called �spillover� calculation). This transfer was suspended in 2005-06, but will resume this year, reducing General Fund sales tax revenues by $590�million. The transfer is projected to decline to $420�million in 2007-08 and further in subsequent years as the result of lower gasoline prices.
We estimate that CT receipts totaled $10.5�billion in 2005-06, a 22�percent increase from the prior year. We forecast that receipts from this source will decline to $10.2�billion in 2006-07, before rebounding to $10.6�billion in 2007-08. Over the four subsequent years of the forecast, we project that CT receipts will expand at an average annual rate of 7.2�percent.
Key Forecast Factors. The single most important factor underlying CT receipts is California taxable corporate profits. These profits had jumped sharply in 2004 and 2005, reflecting widespread gains among various industries. More recently, a sharp slowdown in quarterly estimated payments in the third quarter of calendar year 2006 indicates that earnings growth is flattening out in 2006. A review of quarterly payments suggests that profits related to building and finance-related companies are slowing, reflecting the recent downturn in home construction, sales, and financing. The increased foreign earnings reported by companies in 2004 and 2005 in response to federal law changes is also dampening year-to-year growth rates.
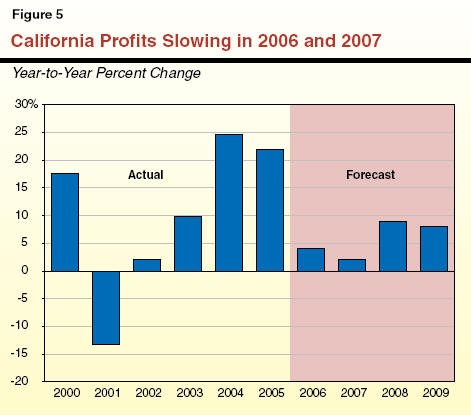
As indicated in Figure�5, we forecast that California taxable profits will grow at a sluggish pace in 2006 and 2007 before rebounding moderately in 2008. Positive factors in the longer-term profit outlook are continued growth in worker productivity and expanding markets for California-produced goods, both in the U.S. and abroad.
A second factor depressing CT collections in 2006-07 and 2007-08 is that some audit payments that would have otherwise been collected during each year were accelerated into 2004-05 as the result of the amnesty program. The program resulted in nearly $4�billion in amnesty-related payments, of which more than $3�billion represented an acceleration of payments that would have otherwise been collected through the normal audit process. We estimate that the program accelerated into 2004-05 $400�million from the 2005-06 fiscal year, more than $600�million from both the 2006-07 and 2007-08 fiscal years, and then declining annual amounts thereafter.
The remaining 5�percent of General Fund revenues includes taxes on insurance premiums, alcoholic beverages, and cigarette distributions, as well as fees, interest on investments, asset sales, and loans and transfers between the General Fund and special funds.
Revenues from this category are expected to vary within a range of $5�billion to $5.5�billion over the forecast period. Tax-related revenues are projected to grow roughly 2�percent per year, reflecting a mixture of different trends including moderate gains in the insurance tax and modest declines in cigarette taxes. Non-tax sources are projected to decline slightly over the forecast period, reflecting such factors as lower interest earnings (due to declining General Fund investable balances), federal changes affecting certain fee revenues, and scheduled repayments of outstanding loans from special funds in various years. Our estimates do not include any revenues from the estate tax. Under current federal law, the estate tax is presently not in effect but is scheduled to be reinstated at the national level in 2012. If this were to occur, California�s estate tax (which is tied to the federal credit allowed to states for federal estate taxes paid by their residents) would raise roughly $1�billion in the final year of the forecast.
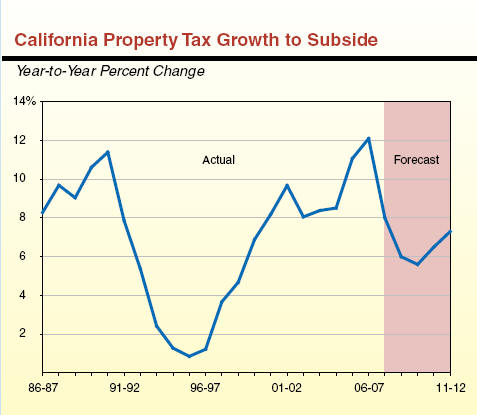
The Outlook for Property TaxesProperty taxes will total $43�billion during 2006-07, making it the third-largest state-local government revenue source in California. In the current year, about one-third of property tax revenues will go to schools, while the remainder will be apportioned among cities, counties, and special districts. Under Proposition�13, real property (land and buildings) is reassessed to market value only when it changes ownership. Otherwise, the assessed value grows by no more than 2�percent a year. An assessment also can be reduced (through a process initiated by the assessor or property owners under Proposition�8) when the estimated market value of a property falls below its assessed value. Despite the dedication of property tax revenues to local governments, the state is affected by changes in local property taxes. Under Proposition�98, state funding for K-14 education is generally offset, dollar-for-dollar, by the amount of local property taxes available to school and community college districts. Property Taxes Have Soared in Recent YearsThe recent real estate boom has led to a nearly 58�percent increase in local property tax revenues between 2001-02 and 2006-07, and a 35�percent increase after adjusting for inflation. The inflation-adjusted increase is the largest of any five-year period since the passage of Proposition�13 in 1978. The unprecedented growth has had beneficial impacts on both state and local government finances in recent years. The large increase reflects a combination of soaring real estate prices and historically high sales rates (which has led to large reassessments), and large increases in new construction activity. But Slower Growth Is ForecastThe slowdown in the real estate market that is currently underway will lead to more subdued growth in property tax revenues during the next several years (see accompanying figure). Factors leading to lower growth include (1) a reduced level of property sales (and hence fewer upward assessments to market value), (2) less new construction, and (3) less average growth in assessed values for property that is sold. Depending on the magnitude of future price declines in the real estate market, downward assessments (under the Proposition�8 process) of certain recently purchased property also may have a negative impact on assessed values during the next several years. As shown in the accompanying figure, we are forecasting that annual growth in property taxes will subside from 12�percent in 2006-07 to below 6�percent by 2009-10, before rebounding modestly in subsequent years. Our forecast, however, is highly dependent on the length, scope, and severity of the current slump in the real estate market. Our figures could be overstated if the slump proves to be more pronounced than we are assuming.
|
In this chapter, we discuss our General Fund expenditure estimates for 2005-06 and 2006-07, as well as our projections for 2007-08 through 2011-12. Figure�1 (see next page) shows our forecast for major General Fund spending categories. We first discuss below our projected general budgetary trends and then discuss in more detail our expenditure projections for individual major program areas.�
We forecast that General Fund expenditures will grow from $102.1�billion in 2006-07 to $105.6�billion in 2007-08, an increase of 3.4�percent. The relatively low growth rate reflects one-time expenditures in 2006-07 related to budgetary loan repayments to transportation, schools, and local government. Excluding these one-time repayments, the underlying growth rate in 2007-08 is closer to 5�percent. Compared to this underlying rate, above-average increases are projected for the California Department of Corrections and Rehabilitation (CDCR) and certain health and social services programs.
Moderate Total Growth Projected. The right-hand column of Figure�1 shows our projected average annual growth rates for major programs from 2006-07 through 2011-12. We forecast that total spending will increase by an average annual rate of 4.8�percent over the period, or roughly one percentage point less than statewide personal income growth. This average expenditure growth rate, however, masks divergent trends among many of the different individual program areas that make up the total. In addition, the projected annual spending totals within the final four years of the forecast period are affected by various loan repayments, making year-to-year comparisons difficult.
|
Figure 1 Projected General Fund Spending for Major Programs |
|||||||||
|
(Dollars in Millions) |
|||||||||
|
|
|
|
|
|
|
|
|
|
Average Annual Growth From 2006‑07 |
|
Estimated |
|
Forecast |
|||||||
|
2005‑06 |
2006‑07 |
|
2007‑08 |
2008‑09 |
2009‑10 |
2010‑11 |
2011‑12 |
||
|
Education |
|
|
|
|
|
|
|
|
|
|
K-14�Proposition 98 |
$38,420 |
$41,157 |
|
$42,491 |
$44,373 |
$45,777 |
$47,415 |
$50,196 |
4.1% |
|
Proposition 98 Settlement |
� |
� |
|
300 |
450 |
450 |
450 |
450 |
� |
|
Proposition 98 Settlement�Tobacco Bond Offset |
� |
� |
|
-300 |
-450 |
-150 |
� |
� |
� |
|
CSU |
2,536 |
2,724 |
|
2,825 |
2,933 |
3,054 |
3,182 |
3,311 |
4.0 |
|
UC |
2,696 |
2,918 |
|
3,022 |
3,124 |
3,239 |
3,354 |
3,464 |
3.5 |
|
Health and Social Services |
|
|
|
|
|
|
|
|
|
|
Medi-Cal |
12,351 |
13,824 |
|
14,439 |
15,162 |
15,913 |
16,832 |
17,840 |
5.2 |
|
CalWORKs |
2,001 |
1,964 |
|
2,253 |
1,985 |
1,980 |
1,981 |
1,988 |
0.3 |
|
SSI/SSP |
3,421 |
3,543 |
|
3,783 |
4,066 |
4,312 |
4,567 |
4,848 |
6.5 |
|
IHSS |
1,273 |
1,446 |
|
1,563 |
1,726 |
1,900 |
2,086 |
2,285 |
9.6 |
|
Developmental Services |
2,245 |
2,491 |
|
2,740 |
2,913 |
3,177 |
3,474 |
3,797 |
8.8 |
|
Other major programs |
4,801 |
5,705 |
|
5,686 |
5,987 |
6,376 |
6,836 |
7,247 |
4.9 |
|
Corrections and Rehabilitationa |
7,332 |
8,471 |
|
9,079 |
9,555 |
10,049 |
10,544 |
11,082 |
5.5 |
|
Proposition 42-related payments |
1,345 |
2,616 |
|
1,556 |
1,640 |
1,732 |
1,819 |
1,888 |
-6.3 |
|
Debt service on infrastructure bonds |
3,812 |
4,162 |
|
4,582 |
5,440 |
6,248 |
6,789 |
6,936 |
10.8 |
|
Other programs/costs |
9,567 |
11,097 |
|
11,571 |
13,198 |
13,823 |
12,911 |
13,690 |
4.3 |
|
Totals |
$91,800 |
$102,118 |
|
$105,588 |
$112,100 |
$117,879 |
$122,240 |
$129,022 |
4.8% |
|
|
|||||||||
|
a Reflects employee compensation costs. |
|||||||||
Highlights for Individual Program Areas. With regard to the major individual program areas in the budget, the figure shows that:
�K-14 Proposition�98 (General Fund) spending is projected to increase at an average annual rate of 4.1�percent throughout the forecast period. For the last two years of our forecast, slowing K-12 school enrollments trigger the �Test�1� Proposition�98 formula that requires a fixed percentage of General Fund revenues be spent on K-14 education. This leads to average annual increases of 4.7�percent in General Fund K-14 spending levels in those years-the same as the growth in overall spending in those final two years.
University of California (UC) and California State University (CSU) are forecast to grow at an average annual rate of 3.5�percent and 4�percent, respectively, reflecting full funding of projected enrollment and inflation.
Medi-Cal is projected to grow at an average annual rate of 5.2�percent. This reflects continued increases in caseload-related costs and the utilization of medical services, as well as various one-time and on-going changes in basic program costs.
California Work Opportunity and Responsibility to Kids (CalWORKs) spending is projected to increase by an average of 0.3�percent over the forecast period. This marginal increase reflects costs for statutory cost-of-living adjustments (COLAs) and cost pressures from the Guillen court case, which are almost entirely offset by savings from estimated caseload declines.
Supplemental Security Income/State Supplementary Program (SSI/SSP) spending is projected to increase at an average annual rate of 6.5�percent, reflecting statutory COLAs and moderate growth in caseloads during the forecast period.
In-Home Supportive Services (IHSS) spending is projected to increase at an average annual rate of 9.6�percent. This rapid growth reflects both increases in caseloads and service hours, as well as wage increases for IHSS workers.
Department of Developmental Services (DDS) spending is projected to increase at an average annual rate of 8.8�percent over the period, reflecting continued increases in caseloads and the cost-per-client served by the state�s 21 Regional Centers.
Department of Corrections and Rehabilitation spending is forecast to increase at an average annual rate of 5.5�percent over the forecast period. This growth takes into account increases in the prison inmate population, court-ordered increases in health care costs, and increases in salary and other operating expenses.
Debt-service expenses for general obligation and lease-revenue bonds that fund infrastructure projects in all program areas are projected to increase at an average annual rate of 10.8�percent. This reflects average annual sales over the forecast period of about $10�billion in currently authorized General Fund-supported debt, including a total of about $25�billion of the nearly $43�billion of new bonds approved by voters in the November 2006 election.
In the sections that follow, we provide a more detailed discussion of the expenditure outlook for these and other individual major program areas.
State spending for K-14 education (K-12 schools and community colleges) is governed largely by Proposition�98, passed by the voters in 1988. Proposition�98 is funded from the state General Fund and local property taxes, and accounts for about three-fourths of total support for K-14 education. The remainder comes from a variety of sources including non-Proposition�98 General Fund, federal funds, lottery revenue, community college fee revenues, and other local revenues. Generally, the Proposition�98 guarantee is increased annually by the growth in K-12 average daily attendance (ADA) and the growth in the economy.
California�s public K-12 education system consists of more than 1,000 locally governed school districts and county offices of education. These entities operate about 9,500 schools serving about 6�million K-12 students. The California Community Colleges (CCC) consists of 72�locally governed districts operating 109�colleges that serve slightly more than 1�million full-time equivalent students (FTES).
Figure�2 shows our projections of the Proposition�98 minimum guarantee throughout the forecast period. Our forecast projects significant increases in Proposition�98 funding-increases that will permit the Legislature to make major investments in K-12 education and community colleges over the next five years.
|
Figure 2 Proposition 98 Forecast |
|||||||
|
(In Billions) |
|||||||
|
|
2006-07 |
|
|
|
|
|
|
|
|
Budget Act |
Revised |
2007-08 |
2008-09 |
2009-10 |
2010-11 |
2011-12 |
|
General Fund |
$41.3 |
$41.2 |
$42.5 |
$44.4 |
$45.8 |
$47.4 |
$50.2 |
|
Local property tax |
13.8 |
13.9 |
15.0 |
15.9 |
17.1 |
19.6 |
20.9 |
|
Totalsa |
$55.1 |
$55.1 |
$57.5 |
$60.2 |
$62.9 |
$67.0 |
$71.1 |
|
|
|||||||
|
a These totals do not include the $2.9 billion appropriated in Chapter 751, Statutes of 2006 (SB 1133, Torlakson) because it is to be treated as �settle-up funding� to 2004-05 and 2005-06. |
|||||||
Current-Year Technical Adjustments. At the time the 2006-07 budget was enacted, the K-14 funding level was significantly above the Proposition�98 minimum guarantee and the amount of funding (known as the maintenance factor) that needed eventually to be restored to the ongoing Proposition�98 base was roughly $300�million. Since that time, our forecast indicates the minimum guarantee has fallen slightly, but this change has no practical effect on the K-14 funding level or amount of outstanding maintenance factor. Although the total funding level has not changed, local property tax revenues have increased by almost $100�million, thereby reducing the General Fund share of Proposition�98 by a like amount (as shown in Figure�2).
Current-Year Attendance Declines. In addition, K-14 attendance is now anticipated to fall by a greater amount than initially assumed. From budgeted levels, we expect K-12 ADA to drop by roughly 6,000 and CCC FTES to drop by roughly 36,000. This equates to roughly $80�million to $90�million in potential attendance-related savings (split about evenly between K-12 and CCC), which could free up a like amount of non-Proposition�98 General Fund monies. Although the savings associated with the drop in K-12 ADA will occur automatically, realizing savings from the drop in CCC FTES would require legislative action.
Budget-Year Forecast. In 2007-08, we project the Proposition�98 guarantee will be $57.5�billion, which is $2.4�billion, or 4.3�percent, greater than the current-year spending level. This is roughly $350�million more than needed to cover baseline costs (including projected enrollment changes, cost-of-living increases, and mandate costs). Under our forecast, relatively modest growth in General Fund revenues results in a �Test 3� year.
Out-Year Forecast. As shown in Figure�2, we project the Proposition�98 minimum guarantee will experience healthy increases throughout the forecast period. In the four years following 2007-08, we project the guarantee will increase by almost $11�billion-from just over $60�billion in 2008-09 to just over $71�billion in 2011-12. (Over this same period, we project K-12 attendance will decline by roughly 0.5�percent.) Whereas growth in the guarantee is considerable in 2008-09 and 2009-10 (averaging 4.7�percent), it is even greater in the last two years of the forecast period (averaging 6.3�percent). This is because our forecast has Test 1 applying in those latter years. For more information about Test 1 and its implications, please see the nearby box.
�Test 1� to Be Operative Toward End of Forecast PeriodThe Proposition�98 minimum guarantee is usually set at the higher of two tests. Under Test 1, the guarantee is set at about 40�percent of General Fund revenues. To date, Test 1 has been operative only in 1988-89, the year after Proposition�98 was passed. In subsequent years, �Test 2�, which grows the prior-year K-14 funding level by the percent change in per capita personal income, quickly moved the guarantee above the Test 1 level. This was because slow growth in General Fund and property tax revenues were coupled with fast growth in K-12 attendance. The combined effect was to increase the K-14 share of total General Fund spending. Over the past few years and throughout the forecast period, these dynamics essentially act in reverse-a healthy economy increases total General Fund and property tax revenues while K-12 attendance drops. The combined effect is to reduce the K-14 share of General Fund spending. By 2009-10, we project the K-14 share of General Fund spending will decline to about 40�percent. Once Test 1 applies, the K-14 share of General Fund spending is fixed and increases in local property tax revenues begin to supplement rather than supplant General Fund spending. This means K-14 funding levels can benefit substantially from healthy increases in local property tax revenues. Given so many factors affect the Proposition�98 minimum guarantee, when Test 1 actually will apply is difficult to know with certainty. Some developments would delay when Test 1 applies-such as an unexpected downturn in the economy (which would reduce total General Fund revenues), a more dramatic slowdown in the housing sector than we are projecting (which would slow growth in local property taxes), or future state decisions to provide more funding than the Proposition�98 minimum guarantee requires (which would increase the share of General Fund going to K-14 education). In contrast, other developments would result in Test 1 applying sooner than projected-such as an even quicker and stronger economic recovery or a rebound in the housing sector compared to our estimates. |
Our forecast of the Proposition�98 guarantee depends on a variety of factors-including changes in K-12 ADA, as well as changes in per capita personal income, and General Fund revenues. Figure�3 shows these factors and their projected rates over the forecast period. It also shows projected rate increases in CCC FTES and the statutory K-14 COLA.
|
Figure 3 Proposition 98 Underlying Forecast Factors |
||||||
|
|
2006-07 |
2007-08 |
2008-09 |
2009-10 |
2010-11 |
2011-12 |
|
Annual Percent Change |
|
|
|
|
|
|
|
K-12 average daily attendance |
-0.4% |
-0.5% |
-0.5% |
-0.3% |
� |
0.2% |
|
Per capita personal income (Test 2) |
4.0 |
4.8 |
4.6 |
4.7 |
4.9% |
4.6 |
|
Per capita General Fund |
1.3 |
4.3 |
5.6 |
5.3 |
5.0 |
4.6 |
|
K-14 COLA |
5.9 |
3.8 |
3.0 |
2.7 |
2.8 |
2.9 |
|
Share of General Fund Revenues |
|
|
|
|
|
|
|
Projected |
44.1% |
43.2% |
42.2% |
40.8% |
39.8% |
39.8% |
|
Test 1a |
41.0 |
41.0 |
41.0 |
40.4 |
39.8 |
39.8 |
|
Proposition 98 "Test" |
3 |
3 |
2 |
2 |
1 |
1 |
|
|
||||||
|
a LAO estimates for Test 1 factor, adjusted to reflect transfers of local property tax revenues between schools and local governments. |
||||||
K-12 ADA on the Decline. The trend of modest year-to-year declines in total K-12 ADA is expected to continue throughout most of the forecast period. The only year in which K-12 ADA is projected to increase is 2011-12, and then at a very modest rate of 0.2�percent.
Growth in General Fund Revenues to Outpace Growth in Personal Income Throughout Most of Forecast Period. As shown in Figure�3, growth in per capita General Fund revenues and per capita personal income are likely to be moderate throughout the forecast period (averaging 5 percent and 4.7�percent, respectively). Per capita General Fund revenues are forecast to grow more slowly than per capita personal income in 2007-08 but then grow more quickly the next few years. As a result of this change, Proposition�98 moves from Test 3 to Test 2 in 2008-09 and remains at Test 2 in 2009-10.
COLAs to Decline Moving Forward. The K-14 COLA budgeted for 2006-07 is 5.9�percent. As shown in Figure�3, the COLA rate is projected to be notably lower in the budget year (3.8�percent), due largely to the recent drop in energy and construction costs. The rate is likely to drop even further in 2008-09 (to about 3�percent) and then remain below 3�percent for the rest of the forecast period.
Figure�4 compares projected year-to-year growth in Proposition�98 funding with the amount we expect will be needed to cover baseline costs. As shown in the figure, roughly $350�million is likely to be available in 2007-08 after covering baseline costs. The amount of available funds grows to more than $1�billion for the next two years. It then increases significantly in 2010-11 and 2011-12, with more than $2�billion in new monies available after covering baseline costs (due in large part to Test 1 becoming operative). The Legislature and Governor would determine how these monies would be split between K-12 and community colleges.
|
Figure 4 Special Opportunity to Plan for Major Education Reform |
|||||
|
(In Millions) |
|||||
|
|
2007‑08 |
2008‑09 |
2009‑10 |
2010‑11 |
2011‑12 |
|
Growth in Proposition 98 |
$2,380 |
$2,780 |
$2,680 |
$4,040 |
$4,110 |
|
Baseline Expenditures |
|
|
|
|
|
|
K-12 Enrollment Growtha |
-$180 |
-$180 |
-$100 |
$10 |
$100 |
|
CCC Enrollment Growthb |
60 |
70 |
90 |
90 |
80 |
|
COLA |
1,980 |
1,630 |
1,490 |
1,570 |
1,710 |
|
Otherc |
170 |
175 |
180 |
180 |
185 |
|
Totals |
$2,030 |
$1,695 |
$1,660 |
$1,850 |
$2,075 |
|
Available Funds |
$350 |
$1,085 |
$1,020 |
$2,190 |
$2,035 |
|
|
|||||
|
a Adjusts categorical funding to reflect decline in attendance. |
|||||
|
b Assumes enrollment grows consistent with underlying demographic changes. Average annual rate of growth over the forecast period is 1.4 percent. |
|||||
|
c Includes ongoing full-year costs of K-14 mandates and CCC fee reduction (which will become effective January 1, 2007). |
|||||
Opportune Time to Plan for Education Reform. These large projected increases in Proposition�98 funding provide the Legislature with a special opportunity to plan for major new investments in K-14 education. Because the additional resources would become available over the next five years, the Legislature could use 2007-08 to develop a coherent, overarching reform plan. We believe the K-12 component of the plan should include clear student achievement goals and flexibility in how to meet them as well as fiscal reforms that would allow monies to be pooled and administration to be streamlined. This part of the plan might benefit from more than twenty academic studies relating to K-12 governance, efficiency, and adequacy that are to be released in early 2007. We believe the CCC component of the plan should identify desired educational outcomes (such as improved course and program completion rates) and link new funding to the achievement of those outcomes. For both K-12 and CCC, the plan should distinguish between limited-term and ongoing costs.
In addition, the Legislature could consider ways to integrate recent initiatives (including the Quality Education Investment Act, which provides $2.6�billion to K-12 and about $300�million to CCC) into a broader reform plan. In short, by creating a long-term plan for the strategic use of additional education monies, the Legislature would be able to maximize the benefit of the new funds-providing school districts and community colleges with time to become familiar with reform objectives and implement them in an effective manner.
In addition to community colleges (which are discussed above as part of the Proposition�98 forecast), the state�s public higher education segments include UC and CSU. The UC consists of nine general campuses (including a new campus at Merced, which opened in fall 2005), one health sciences campus, and numerous special research facilities. The UC awards bachelors, masters, and doctoral degrees, as well as various professional degrees. Of the segments, UC has almost exclusive jurisdiction over public university research. The CSU consists of 23 campuses and several off-campus centers. The CSU grants bachelors and masters degrees and a doctorate in education, and may award joint doctoral degrees with UC under specified circumstances. Overall, state policy for higher education is laid out in its Master Plan for Higher Education, which was originally adopted in 1960.
The Spending Forecast. Our forecast assumes cost increases which fully fund the projected impacts of inflation and enrollment growth. As a result, the segments� budgets grow by an average annual rate of slightly less than 4�percent over the forecast period. We project that General Fund spending on the two university systems will increase from $5.6�billion in 2006-07 to $6.8�billion in 2011-12.
Key Forecast Factors. Our forecast is largely based on three key factors.
Inflation. We assume that base funding will increase annually to compensate for inflation. Neither the Master Plan nor statute provides any explicit guidance about inflationary adjustments. Over the forecast period, we project inflation to average about 2.7�percent annually.
Enrollment. Forecasting enrollment growth is more difficult. Enrollment growth depends primarily on population growth and participation rates. Participation rates respond to a range of factors, including state policies in areas such as outreach and financial aid, and actions by the segments in areas such as admissions policies and class scheduling. California�s college participation rates, currently among the highest in the nation, have been relatively flat over recent years. Given this, and lacking any evidence to assume otherwise, we have assumed participation rates at UC and CSU will remain constant throughout the forecast period. Our enrollment projections are therefore driven by projected population growth. We calculated the ethnic, gender, and age makeup of each segment�s student population, and projected separate growth rates for each group based on statewide demographic data. For example, we project that the population of Latino females ages 17 through 19 will grow by about 14�percent statewide over the forecast period, and therefore the number of students in that category will grow by the same percentage. When all student groups� projected growth is aggregated together, we project that demographic-driven enrollment at the two segments will grow at an annual rate ranging from about 1�percent to 1.7�percent annually. Enrollment growth near the end of the forecast period is expected to slow significantly due to slowing growth in the college-age population.
Fees. The state has no expressed policy for annual fee adjustments at UC and CSU. In the absence of such a policy, we assume that enrollment fees will increase annually at the rate of inflation, thus maintaining their current purchasing power.
Governor�s Compacts. In spring 2004, the Governor developed �compacts� with UC and CSU in which he commits to seek specified funding increases for the segments in his future budget proposals through 2010-11. Because these compacts are neither in statute nor formally endorsed by the Legislature for this period, we have not reflected them in our projections for spending at UC and CSU. We estimate the General Fund cost of implementing the compact would be about $130�million above our projection for 2007-08, rising to about $900�million above our projection for 2011-12.
Student Financial Aid. Most of the state�s General Fund support for student financial aid is directed through the Cal Grant programs, which provide fee coverage and subsistence grants to eligible students. The California Student Aid Commission administers both the Cal Grant Entitlement Programs (in which all students who meet certain income, grade point, and age criteria are entitled to receive grants) and the Cal Grant Competitive Programs (in which eligible students must compete for a fixed number of grants). Our expenditure forecast assumes that the number of Cal Grant entitlement awards will grow in proportion to enrollment growth, and that the fee coverage component of the grants will increase to match projected fee increases. We project that Cal Grant costs will increase from about $800�million in 2006-07 to about $990�million at the end of the forecast period.
The Medi-Cal Program (the federal Medicaid Program in California) provides health care services to recipients of CalWORKs or SSI/SSP grants, and other low-income persons who meet the program�s eligibility criteria (primarily families with children and the elderly, blind, or disabled). The state and federal governments share most of the program costs on a roughly equal basis.
The Spending Forecast. We estimate that General Fund spending for Medi-Cal local assistance (including benefits, county administration of eligibility, and other costs) will reach over $13.8�billion in the current year, slightly more than the amount appropriated in the 2006-07 Budget Act. The estimated increase is due to a shift of costs from 2005-06 to 2006-07 resulting from delays in implementing certain retroactive rate changes for skilled nursing facilities. These costs are partially offset by lower-than-anticipated caseloads for certain beneficiary categories.
We project that General Fund support will grow to over $14.4�billion in 2007-08, a 4.4�percent increase from revised current-year expenditures. This is largely due to costs the Medi-Cal Program will incur as a result of increases in caseload, costs, and utilization of medical services. Other factors contributing to the increase are the discontinuation of a 5�percent provider rate reduction for managed care plans, that will expire in January 2007 and additional caseload spending resulting from Medi-Cal enrollment procedure changes mandated by Chapter�328, Statutes of 2006 (SB 437, Escutia). By the end of the forecast period in 2011-12, we estimate that General Fund spending for Medi-Cal will reach $17.8�billion, an average annual increase of 5.2�percent over the projection period.
Key Forecast Factors. Several factors play a significant role in our forecast:
Health Care Costs. A significant factor in our forecast is the assumption that the cost per person of providing Medi-Cal health-care services will grow at an average annual rate of 4.6�percent, with the cost of providing care to the aged and disabled growing faster than the cost of providing care to families and children. This difference is primarily due to the higher utilization of care among the aged and disabled. As shown in Figure�5 the average cost per person enrolled in Medi-Cal is projected to grow from about $3,700 to $4,600 during the forecast period. Our health care cost assumptions are subject to considerable uncertainty, and small changes in the actual rate of growth in medical costs could have significant fiscal effects.
Medi-Cal Caseload Trends. As shown in Figure�5 we project that the overall Medi-Cal caseload will grow slightly each year throughout our projection period. This forecast reflects continued caseload growth commensurate with increases in the state population and other underlying trends. Notably, our analysis indicates that the aged and disabled caseload will grow faster than that for families and children during the projection period.
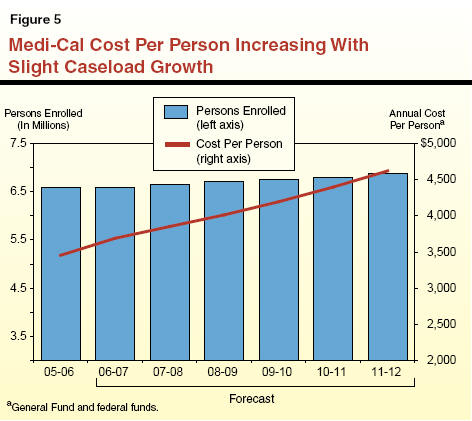
Further Savings in 2007-08 and Beyond. Our forecast assumes that the state will achieve an increased level of savings beginning in 2007-08 from the implementation of various cost reduction strategies begun in prior years. These include activities to ensure that the Medi-Cal Program avoids costs and recovers certain payments for Medi-Cal services as allowed under state and federal law. Savings are also anticipated from the expansion of Medi-Cal managed care into 13 additional counties by July 2009.
Impact of Medicare �Part D� Drug Benefit. In January 2006, the federal government began to provide outpatient prescription drug coverage, known as Part D, to Medicare beneficiaries. With the implementation of Part D, individuals who are both Medicare and Medi-Cal recipients, commonly referred to as �dual eligibles,� began to receive most of their prescription drugs under Medicare at federal expense, instead of Medi-Cal. In order to recoup some of its costs, the federal government charged states a �clawback� payment. In our previous Fiscal Forecast, released in November 2005, we estimated that this payment in combination with other Part D fiscal effects would cost the state about $200�million per year beginning in 2007-08. Since our November 2005 projection, the federal government has adjusted downward the clawback payment. We now project that Part D will be cost neutral in 2007-08 and then grow steadily to a state cost of about $50�million by 2011-12.
The Healthy Families Program (HFP) is California�s version of the federal State Children�s Health Insurance Program (SCHIP). (The SCHIP was enacted in 1997.) Funding generally is provided on a two-to-one federal/state matching basis. The program generally offers health insurance to eligible children in families with incomes below 250�percent of the federal poverty level (FPL). The federal government has also authorized the use of federal funds to cover children up to age two in families with incomes below 300�percent of FPL who have transferred to HFP from the state�s Access for Infants and Mothers program. To participate in HFP, all participating families pay a relatively low monthly premium and are offered health coverage similar to that available to state employees.
The Spending Forecast. We estimate that overall General Fund spending for HFP local assistance will be about $358�million in 2006-07, about $10�million less than what was provided in the 2006-07 Budget Act. This estimated decrease is due to slower caseload growth than previously projected. We further estimate that overall General Fund spending for the program will increase to about $399�million by 2007-08 and that by 2011-12 the program will have an annual General Fund cost of about $524�million. The average annual growth in expenditures over the forecast period is projected to be about 8.1�percent.
Key Forecast Factors. Several factors play a role in our forecast:
Exhaustion of SCHIP Fund Balance. States must spend their federal SCHIP allocations within a set period of time (generally three years) or risk the reversion of these funds to the federal government. The state expanded its use of SCHIP funds for health coverage programs beginning in 2003-04 to prevent SCHIP funds from being reverted and lost to the state. As a result, the current level of SCHIP funds being spent each year now exceeds the annual SCHIP allocation to California, with the result that the balance of unspent SCHIP funds has been gradually declining. Our HFP projection assumes that the state will exhaust its balance of unspent SCHIP funds in 2008-09, and that funding for HFP would continue to remain on a roughly two-to-one federal/state matching basis.
SCHIP Reauthorization. Funding for SCHIP has been authorized by Congress only through the 2007 federal fiscal year (FFY) (September 30, 2007). Our forecast assumes that Congress will reauthorize SCHIP funding beyond 2007. If Congress does not reauthorize funding for the program at a level necessary to support the growing HFP caseload, state costs for HFP would be significantly greater than we have projected during the forecast period.
Senate Bill 437 Implementation. Chapter�328, Statutes of 2006 (SB 437, Escutia), establishes presumptive eligibility for HFP and an accelerated enrollment program. It also establishes a process by which HFP applicants can self-certify income at the time of their annual eligibility review. Our projection assumes that full implementation of these changes would not occur until 2009-10, which accounts for the gradual increase in caseload resulting from this legislation.
The Department of Mental Health (DMH) directs and coordinates statewide efforts for the treatment of mental disabilities. The department�s primary responsibilities are to (1) provide for the delivery of mental health services through a state-county partnership, (2) operate five state hospitals, (3) manage state prison treatment services at the California Medical Facility at Vacaville and at Salinas State Prison, and (4) administer various community programs directed at specific populations. The state hospitals provide inpatient treatment services for a variety of clients including sexually violent predators (SVPs) transferred from the CDCR.
The Spending Forecast. We estimate that General Fund spending for mental health services in 2006-07 will total about $1.6�billion. Our estimate of current year spending includes about $50�million above the amount approved in the 2006-07 Budget Act. This increase is due to the costs of implementing Proposition�83 (commonly known as Jessica�s Law), approved by the voters at the November 2006 election, as well as the costs for higher than anticipated caseload growth in community mental health programs.
We further estimate that General Fund spending for mental health services will grow by more than 8�percent above our estimated 2006-07 spending level to almost $1.8�billion in 2007-08.
Between now and 2011-12, we estimate that General Fund spending for mental health services will grow by about $850�million and reach a total of $2.5�billion annually. The average annual growth in expenditures over this forecast period is projected to be about 8.6�percent.
Key Forecast Factors. Several factors play a role in our forecast:
Proposition�83. This measure increases penalties for violent and habitual sex offenders and expands the definition of a sexually violent predator. We estimate that these changes will result in a significant increase in the number of sex offenders that will be referred by CDCR to DMH for evaluation as potential SVPs. We also estimate that the measure will result in a significant increase in the number of sex offenders who will receive civil commitments to state mental hospitals as SVPs. Our projection assumes increased costs to the state of more than $40�million beginning in 2007-08 and growing steadily thereafter as the SVP caseload increases.
Mental Health Beds in CDCR Facilities. A federal court has ruled in the Coleman case that the mental health care system in the state�s prisons is inadequate. A special master appointed by the court in the Coleman case has indicated an intention to seek a total of 5,000 new mental health beds for the CDCR system. To date, the Coleman court has required CDCR to add 695 acute and intermediate care beds to treat inmates with mental illnesses. The DMH will manage these state prison treatment services within CDCR facilities. Our projection assumes that the expansion of the 695 mental health care beds will be phased in over a three-year period between 2009-10 and 2011-12. We estimate that DMH will incur costs of about $200�million in 2011-12 to staff these beds.
The state provides a variety of services and supports to individuals with developmental disabilities, including mental retardation, cerebral palsy, epilepsy, autism, or other similar disabling conditions. The DDS, which oversees the programs, operates five Developmental Centers (DCs) and two smaller facilities which provide 24-hour institutional care, and contracts with 21 nonprofit regional centers (RCs) to coordinate and deliver community-based services.
The Spending Forecast. We estimate that General Fund spending for developmental services in 2006-07 will total $2.5�billion, about the same amount of funding appropriated in the 2006-07 Budget Act. Of that total, about $2.1�billion will be spent by RCs for community-based services and about $375�million will be spent for operating DCs.
We further estimate that General Fund spending for developmental services will grow by almost 10�percent in 2007-08 to approximately $2.7�billion.
Between now and 2011-12, we estimate that General Fund spending for the developmental services program will grow by $1.3�billion and reach a total of $3.8�billion annually. This expenditure growth is due mainly to increased spending by RCs on community-based services.
We estimate that there will be various one-time administrative and programmatic costs in 2006-07 and 2007-08 as a result of the closure of Agnews DC followed by an ongoing reduction in DC operating costs. Spending for DCs is projected to remain relatively flat over the rest of the forecast period.
Key Forecast Factors. Our forecast of significant growth in RC spending reflects historical increases both in caseload and in the average cost of serving each RC client. Specifically, our forecast assumes that RC caseloads will grow at an average annual rate of 3.8�percent, and that costs will grow at an annual average rate of 6.9�percent.
The CalWORKs program provides cash grants and welfare-to-work services to families with children whose incomes are not adequate to meet their basic needs. The CalWORKs program is primarily funded by state General Fund and federal funds that the state receives as part of its Temporary Assistance for Needy Families (TANF) block grant. In order to receive these federal funds, the state must meet a maintenance-of-effort requirement, which is largely satisfied through state and county spending on CalWORKs. Federal TANF funds are used both to support the CalWORKs program and for transfers to offset General Fund costs in other related programs.
The Spending Forecast. General Fund spending for the CalWORKs program is estimated to be $2�billion in 2006-07, a $37�million decrease from the prior year. We project spending to increase by almost $290�million in 2007-08. Following a substantial decrease ($270�million) in 2008-09, we project that spending will remain essentially flat through 2011-012.
Key Forecast Factors. Most of the increase in 2007-08 is the one-time costs ($436�million) for retroactive payment of the October 2003 COLA for 2003-04 through 2006-07. These additional costs are in part offset by surplus TANF funds. A superior court has ruled in the Guillen court case that the October COLA is required by current law. We note that the administration has appealed the court decision but no court date has been set. Our projections include an ongoing cost of $117�million for the October 2003 COLA beginning in 2007-08.
Beginning in 2007-08, program costs increase primarily due to (1) grant COLAs, and (2) inflation increases for employment services, child care, and administration. However, these costs will be largely offset by savings from continued caseload decline, as discussed below. Our projections do not reflect the costs associated with potential federal penalties for failure to meet work participation requirements pursuant to the federal Deficit Reduction Act of 2005. This is because California has the potential of complying as a result of recently enacted CalWORKs policy changes and potential other strategies for increasing work participation or increasing the caseload reduction credit (which has the effect of lowering the federal requirement).
Caseload Trends and Projections. From its peak in March�1995 to its low point in July 2003, the CalWORKs caseload declined by 49�percent to about 475,000 cases. This decline in caseload is attributable to a number of factors including the strong economy of the late 1990s, annual reductions in the teen birth rate, and CalWORKs program changes which emphasized welfare-to-work services. For the next 18 months, the caseload grew very slowly to a total 493,000 cases in December 2004. Since then, the caseload has once again been in decline falling to 468,000 as of June 2006. Based on this recent decline, we project further modest decreases in the out-years of our forecast.
The SSI/SSP provides cash assistance to eligible aged, blind, and disabled persons. The SSI component is federally funded and the SSP component is state funded.
The Spending Forecast. General Fund spending for SSI/SSP is estimated to be $3.5�billion in 2006-07, an increase of 3.5�percent compared to the prior year. For 2007-08, we project a 6.8�percent increase, raising total expenditures to $3.8�billion. From 2007-08 through 2011-12, spending for SSI/SSP will increase by an annual average rate of 6.4�percent, eventually reaching a total of over $4.8�billion.
Key Forecast Factors. The two primary cost drivers for SSI/SSP are caseload growth and the cost of providing the statutory COLA beginning in 2007-08. (For 2005-06 and 2006-07, the state COLA was suspended.) The state COLA resumes in January 2008, resulting in a six-month cost of $98�million in 2007-08. For the remainder of the forecast, the annual COLA will add costs of about $130�million each fiscal year. Starting in September 2006, the cost of providing state-only SSI/SSP benefits to noncitizens who immigrated to the U.S. after August 1996 substantially increased (about $25�million annually). This is because their sponsors� incomes are no longer counted as an offset to the grant amount.
Caseload Trends and Projections. During the late 1980s and early 1990s, the caseload grew rapidly, with most of the growth in the disabled component of the caseload. Subsequently, the caseload leveled off and actually declined in 1997-98, in part due to federal policy changes which restricted eligibility. From 1998 through 2003, the caseload grew at a steady rate of just over 2�percent per year. Beginning in 2003, caseload growth began to rise over 2�percent, reaching nearly 2.5�percent in 2006. Given this recent modest up-tick in caseload growth and anticipated growth in the aged population, we project caseload growth to approach�3�percent by the end of the forecast period.
The IHSS program provides various services to eligible aged, blind, and disabled persons who are unable to remain safely in their homes without such assistance. Program costs are shared 50�percent federal, 32�percent state, and 18�percent county.
The Spending Forecast. General Fund spending for IHSS is expected to be $1.4�billion in 2006-07, an increase of almost 14�percent over the prior year. This increase is primarily due to caseload growth and provider wage increases. For 2007-08, we project that costs will increase by about 8.1�percent to a total of over $1.5�billion. This lower growth rate reflects some savings from a quality assurance initiative to standardize assessment practices and provided training for IHSS social workers. For the remainder of the forecast, we expect costs to increase at an average annual rate of 10�percent each year, resulting in General Fund expenditures of nearly $2.3�billion in 2011-12.
Key Forecast Factors. The primary cost drivers for IHSS are caseload growth of about 6.9�percent per year and increases in provider wages. For this forecast, we have assumed annual increases in state costs of $55�million per year as counties gradually increase wages paid to IHSS providers. This assumption is primarily based on recent trends in 19 counties that authorized wage increases ($29�million) since May 2006.
Figure�6 presents recent trends and our projections of IHSS costs per person. From 1999-00 through 2002-03, the cost per case increased rapidly, primarily due to increases in provider wages and the hours of services provided to recipients. These trends moderated somewhat in 2004-05 and 2005-06 due to the approval of a federal Medicaid waiver authorizing federal financial participation in the formerly state-only �residual� program. Our forecast assumes continuation of the Medicaid waiver through the projection period. We anticipate the cost per case to begin rising again during the projection period, mostly due to increases in provider wages.
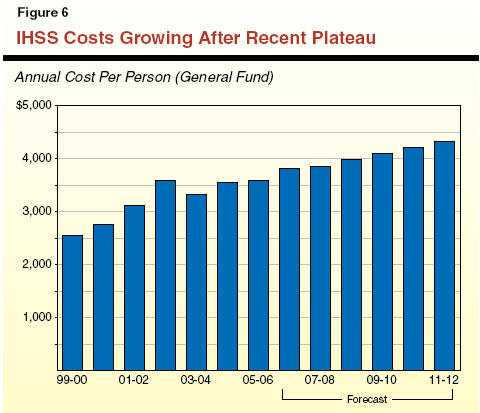
The major state judiciary and criminal justice programs include support for two departments in the executive branch-the CDCR and the Department of Justice-as well as expenditures for the state court system. The single largest expenditure program-CDCR-is discussed in more detail below.
Effective July�1, 2005, the various corrections departments were consolidated into a single department pursuant to Chapter�10, Statutes of 2005 (SB�737, Romero), and the Governor�s Reorganization Plan No. 1. The CDCR is responsible for the incarceration and care of adult felons and nonfelon narcotics addicts at 33 state prisons, as well as the rehabilitation of youthful offenders at eight youth correctional facilities. The CDCR also supervises and provides services to parolees and wards released to the community.
The Spending Forecast. General Fund CDCR expenditures for 2006-07 are estimated to be about $8.5�billion (excluding lease-revenue bond payments, capital outlay, and certain other expenditures). This would be generally in line with the amount of funding provided in various budget items in the 2006-07 Budget Act.
Spending is projected to increase by 7.2�percent above the revised 2006-07 level to approximately $9.1�billion in 2007-08. During the entire forecast period, General Fund spending is projected to increase at an average annual rate of 5.5�percent, reaching nearly $11.1�billion in 2011-12. Our estimates for the forecast period include adjustments for employee compensation increases, but do not include General Fund support for capital outlay and debt service, which are accounted for elsewhere in our projections.
During the forecast period, the state�s General Fund costs are assumed to be partially offset by about $114�million in annual reimbursements from the federal government for a portion of the state�s costs of housing undocumented immigrants convicted of felonies in California.
Key Forecast Factors. The projected increases in General Fund support for CDCR are driven by a combination of factors, including (1) growth in the prison population, (2)�salary increases, (3) compliance with federal court orders to improve health care for inmates, (4) inflation on operating expenses and equipment, and (5) recent changes in state laws affecting certain criminal offenders.
Adult correctional facilities are expected by CDCR to reach their maximum capacity during 2007-08. Nevertheless, our projections assume that by a combination of several possible approaches, CDCR is able to obtain the capacity needed to hold additional inmates. These approaches include contracting for additional community correctional facility beds from private or public agencies; contracts, such as those recently executed by the administration, to transport inmates to out-of-state facilities (currently subject to two legal challenges); placement of some additional parole violators in jails in some counties; or construction of additional temporary or permanent beds on the grounds of existing prisons.
Specifically, as Figure�7 shows, the adult prison population is projected to increase by approximately 17,000 inmates during the forecast period, reaching 190,000 by the end of fiscal year 2011-12. This assumes a continuation of modest growth in the inmate population, although at a somewhat slower pace than in recent projections. The incarcerated juvenile offender population (not shown in the figure) is projected to decrease to approximately 2,200 youth during the forecast period, a drop of about 700 youthful offenders. This reflects a continued trend of declining court commitments to state youth correctional facilities and a diversion of these individuals to local programs and facilities.
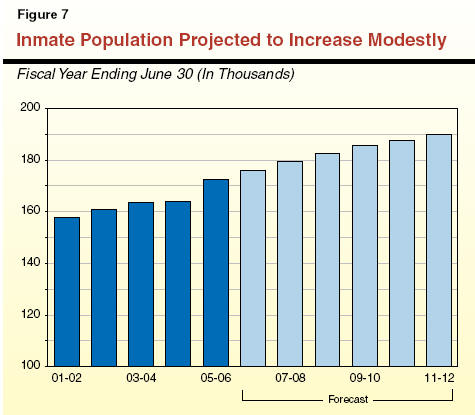
In all, we assume these caseload changes to the population in adult and juvenile facilities, as well as changes in the number of offenders on parole, will result in a net increase in CDCR expenditures of almost $300�million by the end of the forecast period. However, if CDCR is not able to obtain the capacity to hold additional inmates as we have assumed, this could result in such actions as the release of inmates prior to the completion of their prison sentences. Should such actions occur, state expenditures could be lower than we have projected.
General salary increases for CDCR staff are projected to increase expenditures by almost $1.1�billion during the projection period, accounting for more than 40�percent of the total growth in General Fund spending estimated to occur by 2011-12. In addition, our projections assume that three major federal court cases relating to inmate health care would further increase CDCR costs, including salaries for certain medical personnel, as well as other operating expenses. While the exact magnitude of these increases are uncertain, we estimate that various changes in the inmate health care system would increase CDCR operating expenditures by about $850�million annually by 2011-12, not including additional capital outlay costs related to these court cases. (We discuss these fiscal effects in more detail in the shaded box in this section of the report.) In addition, price adjustments for operating expenses are projected to account for about $370�million in increased costs.
Finally, our projections take into account added CDCR costs and savings likely to result from the implementation of new laws that affect certain criminal offenders. Proposition�83, known as Jessica�s Law, which was approved on the November�2006 ballot, and Chapter�337, Statutes of 2006 (SB�1128, Alquist), together impose longer criminal sentences and tighter community supervision of sex offenders. These changes are likely to increase state costs. Another measure, Chapter�875, Statutes of 2006 (SB�1453, Speier) generally mandates residential aftercare in the community for inmates who complete in-prison drug treatment programs along with early discharge for parolees who succeed in treatment. It is expected to eventually result in a net savings to the state. The combined fiscal effect of these three new laws is expected to be a net increase in state costs exceeding $100�million by 2011-12.
Court Cases on Health Care Projected to Increase Correctional CostsOur projections for the California Department of Corrections and Rehabilitation (CDCR) assume that by 2011-12 the state budget would include annual costs of about $1.2�billion in support for prison operations and lease-revenue debt payments related to ongoing litigation in the federal courts over prison health care. As shown in the figure below, the cumulative additional spending from 2006-07 through 2011-12 related to prison operations and capital outlay would amount to almost $4�billion over the five-year period. Several Key Court Cases Involved. A series of federal court rulings in separate cases have found CDCR in violation of the Eighth Amendment of the U.S. Constitution, which forbids cruel and unusual punishment, in regard to the condition of health care provided in state prisons. These class-action lawsuits relate to the provision of general medical care (known as the Plata case), mental health (Coleman) and dental care (Perez). In addition, the Plata and Coleman courts found the state in contempt due to CDCR�s failure to comply with court orders to improve the quality of prison health care. In response, the courts appointed a receiver and a special master, respectively, to carry out significant changes in the way in which prisons provide medical and mental health care. The receiver and the special master are empowered to request the federal judges to order General Fund spending regardless of whether such expenditures have been approved by the Legislature and the Governor. They can also request the courts to waive state laws, rules and procedures (including provisions of labor contracts and environmental protection laws) that they determine are preventing or slowing the implementation of court-ordered changes. The Plata, Coleman, and Perez courts have stressed the importance of increasing the state�s recruitment and retention efforts for CDCR medical, mental health, and dental professionals as a strategy to improve health conditions for inmates in the prisons. All of these courts have also identified insufficient health program space, antiquated facilities, and inadequate equipment as major obstacles to providing adequate health care.
Pay Increases and Other Operational Changes. Since 2005, the courts have ordered significant pay raises as one of the primary elements of their strategy to improve the health care system. To date, the state has implemented these pay increases, as well as other court-ordered changes in CDCR staffing and operations. However, should the courts find that these pay increases and other operational changes are insufficient to meet their objectives, they are likely to require that the state implement further salary increases and take other further actions to improve the health care system. Already, the receiver in the Plata case has identified the need for changes such as new procurement procedures, improved equipment, and a centralized health care information technology system. We estimate that these court cases could result in approximately $850�million in annual CDCR operating costs to the state by 2011-12, including the new resources committed during the current fiscal year. As shown in the figure, we estimate that the cumulative additional spending during 2006-07 through 2011-12 related to prison operations would amount to about $3.2�billion. Our estimates do not include significant additional CDCR operating costs incurred prior to 2006-07 as a result of the three court cases. Already, in October 2006, the federal court overseeing the Plata case ordered the state to raise salaries-in some cases, for the third time in ten months-for numerous CDCR personnel classes who provide medical care (including nurses and physicians) in response to the state�s continuing inability to attract and retain enough qualified employees to fill authorized positions. Given the magnitude of costs for court orders to date, we believe our projections of future pay increases and operating costs may be conservative. We also note that court-ordered pay increases in CDCR also may prompt the state to raise pay for medical personnel in other departments-especially the Department of Mental Health (DMH). These pay increases might prove necessary to prevent medical staff in these other departments from leaving their positions for higher-paid CDCR positions. Capital Outlay. The Plata, Coleman, and Perez courts have all identified inadequate facilities as a major obstacle to providing medical services for inmates, and they are beginning to take steps to address this issue. The exact construction cost for all of the proposed facilities required by these three court cases is unknown and will depend on facility location, the mix and type of treatment space that CDCR is eventually ordered by the courts to build, the total number of beds that are ultimately required, and their timing. Based on the capital outlay projects approved by the Legislature to date and our review of the statements made by the courts, the receiver and the special master, we estimate that the construction and other project costs for such facilities could total about $4.6�billion by 2011-12. As noted earlier, the receiver and the special master could seek court orders to spend General Fund monies to build these facilities. However, our analysis assumes instead that the Legislature and the Governor agree to finance much of the new construction with lease-revenue bonds that would spread out construction costs over time, given the state�s ongoing fiscal problems. Assuming that the state does finance a majority of the construction with lease-revenue bonds over 25 years, the debt-service payments would reach approximately $330�million annually by 2011-12. As also shown in the figure, we estimate that the cumulative spending during 2006-07 through 2011-12 for these facilities (including both direct appropriations from the General Fund for preliminary plans and working drawings and lease-revenue bond payments for construction) would amount to about $830�million. Although no new facilities have actually been constructed in response to the Coleman case, the Coleman court has already ordered the state to provide 695 new mental health beds for which design is currently under way. The Legislature and Governor have also approved these projects at an estimated total capital cost of $590�million. The DMH would probably incur additional costs of about $200�million annually by the end of the projection period to staff these beds. We account for these costs in the DMH budget. The Coleman special master has indicated an intention to eventually seek a total of 5,000 new mental health beds for the CDCR system to address estimated gaps in the existing mental health system. The cost for these additional mental health beds is unknown at this time. The Plata receiver similarly has called for new medical facilities for general medical care, including the construction of (1) 500 correctional treatment facility beds (a type of licensed clinic on prison grounds) at existing prisons within the next 18 months and (2) an additional 5,000 prison medical beds (in various licensing categories) within the next three to five years. Our estimate of the total cost of these facilities required under Plata is about $3�billion. In addition, in response to the Perez case, CDCR is currently evaluating the dental facilities needs of the department. Early estimates place the cost of implementing dental-related projects throughout the prison system at a total of $1�billion. | |||||||||||||||||||||
Funding in Current-Year Budget Designated As �Prepayment.� In recent years, there has been debate as to when the state must reimburse local governments for mandates. The Government Code makes local governments eligible for reimbursements in the year in which they carry out mandated activities. The Constitution (as amended by the state�s voters in Proposition�1A in 2004), in contrast, does not require the Legislature to provide mandate reimbursements until the fiscal year after local governments submit their mandate bills. The current budget provides funding for mandated activities carried out in the current year, but the Legislature and administration specified that this funding represents prepayment of 2007-08 state mandate obligations (an action that appears to reflect the mandate payment schedule allowed by Proposition�1A). The state also has a large backlog of unpaid pre-2004 mandate claims. The current budget makes two years of payments towards the state�s 15-year plan to retire the debt. The administration and Legislature designated the second payment as a prepayment of 2007-08 state obligations.
The Spending Forecast. Given the state�s actions to designate funding in the current budget as prepayments, the forecast for 2007-08 includes only the funding necessary to pay outstanding mandate claims submitted during 2006-07 year (less than $60�million). The 2007-08 forecast does not include funding to (1) reimburse local governments for mandated activities carried out in 2007-08 or (2) make a payment to retire mandate debt. In the 2008-09 and subsequent fiscal years, the forecast assumes the state will pay outstanding mandate bills from the prior year (about $200�million annually) and make annual payments of over $100�million to retire the state�s mandate debt.
Departments� budgets include the current costs of compensating state employees. In 2005-06, the General Fund paid about $9�billion (excluding higher education) in salary, salary-related expenses (such as pension contributions), and employee health benefits. Each year, the budget includes a lump sum for most additional compensation and benefit provisions that will take effect in the budget year. The 2006-07 Budget Act and later legislation appropriate $569�million from the General Fund for this purpose. The largest component of these costs is for correctional officers and their supervisors and managers. In addition to the funds appropriated specifically for employee pay increases, we assume that a large portion of the $100�million appropriated for the prison health care receivership will be used to augment salaries under an October 2006 court order.
The Spending Forecast. After the current year, we forecast that employee compensation budgets will be augmented annually in amounts ranging from $380�million in 2007-08 to $450�million in 2011-12. After compounding these increases, annual employee compensation costs would be $2.7�billion higher in 2011-12 than they were in 2005-06. This reflects estimated costs under union agreements that generally extend to the end of 2007-08 and projected increases for employees in subsequent years (generally at the rate of inflation). About one-fourth of the annual increases after the current year result from increased health care premiums.
Key Forecast Factors. We assume that pay levels for state correctional officers, doctors, dentists, and nurses will increase somewhat faster than inflation during the forecast period. These employee groups continue to experience persistent recruitment and retention problems, and wage pressures in some of their respective labor markets (as well as costs resulting from the prison court cases) are expected to result in above-average wage increases. Given the large portion of the state operations budget spent on correctional officer pay and benefits, the terms of future collective bargaining agreements with the California Correctional Peace Officers Association (CCPOA) will be major factors affecting growth in this portion of the budget. (The prior CCPOA contract expired in July 2006, and the administration and the union currently are discussing a new contract at the bargaining table.) Regarding health care costs for all state employees, premiums are set by the California Public Employees� Retirement System (CalPERS). We assume the state�s share of these premiums will grow at an average rate of about 10�percent per year, which is considerably less than the rate of growth experienced in some recent years.
The 2006-07 Budget Act includes over $3.5�billion of General Fund appropriations for employee retirement programs (excluding Social Security and Medicare taxes). The state�s payments to the CalPERS pension program equal more than 40�percent of this total. Payments to (1) CalPERS for health benefits for retired state and CSU employees and (2) the California State Teachers� Retirement System (CalSTRS) for pension benefits each make up about 30�percent of the total. On an annual basis, state and school district retirees are paid most of their pension benefits from returns generated by the large investment portfolios of CalPERS and CalSTRS, respectively. In contrast, no investment funds have been set aside for retiree health benefit expenses.
The Spending Forecast. Overall, we estimate that net General Fund retirement costs increase from $3.5�billion in 2006-07 to $5.6�billion in 2011-12, with half of this growth resulting from retiree health expenses. Under current law, issuance of pension obligation bonds to achieve about $525�million in one-time General Fund savings related to CalPERS is permitted. Our forecast, however, assumes that this bond issuance does not take place during the forecast period due to unfavorable court decisions to date.
Key Forecast Factors. In 2005, CalPERS adopted new actuarial methods that reduce the likelihood that stock market fluctuations will result in sudden, sharp changes in the required rate of state contributions. Accordingly, we forecast stable CalPERS contribution rates through 2011-12 and modest growth in General Fund contributions consistent with a growing payroll. Despite the new actuarial methods, costs could deviate from the forecast by hundreds of millions of dollars in any given year due to variances in the rate of employee retirements, employee pay growth, and retiree mortality from CalPERS� existing actuarial assumptions. The annual payments to CalPERS include amounts to amortize the current unfunded liability for state employee pension benefits.
Current law establishes state contributions to CalSTRS as a percentage of a prior year�s teacher payroll. We assume that state contributions to CalSTRS resume at their statutory rate in 2007-08 after a one-time $121�million savings in 2006-07 due to the system�s prior accounting errors. In addition, in 2003-04, the state reduced the appropriation to CalSTRS by $500�million on a one-time basis. A Superior Court decision requires restoration of the $500�million (with interest). Our forecast assumes this repayment would take place over a number of years beginning in 2008-09. Overall, we assume the state�s contributions to CalSTRS grow from $959�million in 2006-07 to $1.6�billion in 2011-12.
We project that state retiree health benefit costs will continue to increase significantly due to rising medical costs and growth in the number of retirees. In the forecast, retiree health costs grow from $1�billion in 2006-07 to $2�billion in 2011-12. The largest portion of these new costs results from assumed premium rate increases by CalPERS and its contracted health plans. Actions by the CalPERS Board of Administration to reduce the rate of premium growth below that in our forecast could reduce annual increases by tens of millions of dollars per year.
Reflecting current law, the forecast assumes no expenditures during the forecast period to amortize existing or potential unfunded liabilities for (1) state and CSU retiree health benefits, (2) CalSTRS� pension programs, or (3) the UC�s pension and retiree health programs. These liabilities may now approach $100�billion. We estimate that the additional annual costs necessary to amortize these unfunded liabilities over 30 years could total in the range of billions of dollars per year, assuming continuation of current benefit levels. In addition, local school districts will face similar challenges for their retiree health programs.
The 2006-07 budget plan assumes $200�million in General Fund savings from authority given to the administration to reduce departmental appropriations during the year. Given the difficulties in achieving these types of savings in past years, we instead assume that the authority will result in minimal savings.
The General Fund incurs debt-service costs for both principal payments and interest owed on two basic types of bonds used to fund infrastructure-voter-approved general obligation bonds and statutorily authorized lease-revenue bonds. (The latter have commonly been used to finance correctional and higher education facilities, among other purposes, and their debt service is paid out of appropriations made by the General Fund to the entities that occupy and lease the facilities that the bonds have funded.) In recent years, the General Fund has also incurred costs for the deficit-financing bonds that the state has issued to help deal with its budgetary problems.
The Spending Forecast. General Fund spending for debt service on bonds used to fund infrastructure is estimated to be $3.8�billion in 2005-06, $4.2�billion in 2006-07, and $4.6�billion in 2007-08. Thereafter, it is projected to grow at an annual pace of almost 11�percent annually.
Key Forecast Factors. Projections of debt-service costs depend primarily on the volume of past and future bond sales, their interest rates, and their maturity structures. Regarding bond sales, our projections are based on a combination of past sales trends and estimates about when various bond-related programs will be in need of funds. Over the entire forecast period, we are assuming that a total of about $58�billion of general obligation and lease-revenue bonds will be sold, including about $25�billion of the nearly $43�billion in new bonds authorized by the voters in the November 2006 statewide general election. Regarding interest rates, we are assuming that they will track our economic forecast, while maturity structures will reflect recent bond sales.
Debt-Service Ratio (DSR). The DSR for bonds-that is, the ratio of annual General Fund debt-service costs to annual General Fund revenues and transfers-is often used as one indicator of the state�s debt burden. There is no one �right� level for the DSR. However, the higher it is and more rapidly it rises, the more closely bond raters and financial analysts look closely at the state�s debt practices and the more debt costs limit the ability to use revenues for other programs. Figure�8 shows what California�s DSR has been in the recent past and our DSR projections for the forecast period. We estimate that the DSR for infrastructure bonds will rise to 5.6�percent in 2010-11 and then fall to 5.4�percent in 2011-02. If the state�s deficit-financing bonds are included in the DSR, it would peak at 8.1�percent in 2009-10, after which these bonds would be repaid and the DSR would drop to under 6�percent, reflecting only infrastructure bonds. Such a DSR, while higher than in past years, is still within the range of what many if not most bond-market participants would consider acceptable.
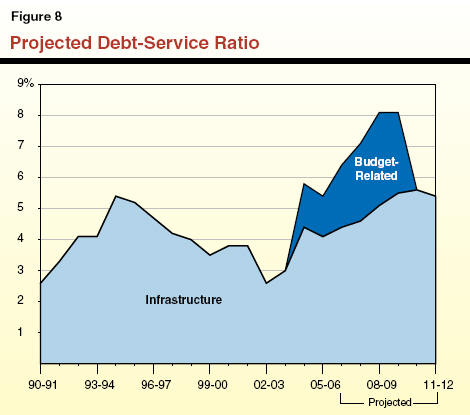
|
Acknowledgments The Legislative Analyst's Office (LAO) is a nonpartisan office which provides fiscal and policy information and advice to the Legislature. |
LAO Publications To request publications call (916) 445-4656. This report and others, as well as an E-mail subscription service, are available on the LAO's Internet site at www.lao.ca.gov. The LAO is located at 925 L Street, Suite 1000, Sacramento, CA 95814. |