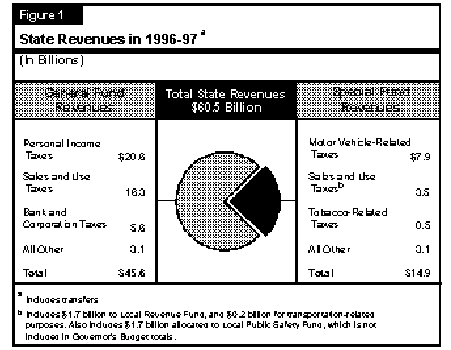
Figure 1 (see page 34) shows that, of the $60 billion-plus in state revenues projected in the budget for 1996-97, about three-fourths are General Fund revenues while the remaining one-fourth are special fund revenues. These estimates include the effects of the Governor's tax reduction proposal, as well as other revenue-related budget assumptions.
Figure 2 (see page 34) shows how total revenues have performed from a long-term perspective. It shows that, over the past 12 years, total revenues have increased at an average annual rate of 6.6 percent. The growth rate has been faster for special funds (about 11 percent) than for General Fund revenues (5.6 percent). This difference is partly due to the relatively harsher impact that the recent recession had on some of the more cyclical General Fund revenue sources, such as the personal income and bank and corporation taxes. The more rapid past increases in

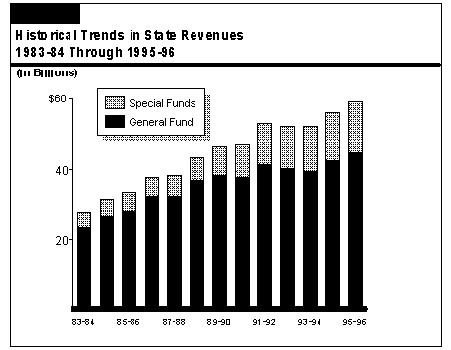
special funds is also due, however, to legislative and voter-approved changes which raised or expanded various special fund taxes. These include the voter approval of gasoline tax increases in 1990, the creation of the one-half cent Local Revenue Fund sales tax in 1991, and, more recently, voter approval of a one-half cent state sales tax for local public safety.
The figure also shows that, after several years of weak performances in the early 1990s, total state taxes increased 7.5 percent in 1994-95, reflecting the positive effects of an improving state economy on both General Fund and special fund taxes. As discussed below, revenue growth is expected to continue in the current and budget years.
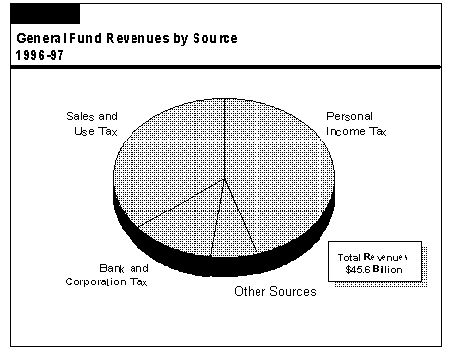
As indicated above, the majority of state revenues are deposited into the General Fund. Figure 3 shows that the bulk of General Fund revenues--about 94 percent--are from the "big three" taxes--the personal income, sales, and bank and corporation tax. The largest of these, the personal income tax (PIT), alone will account for over 45 percent of total receipts in 1996-97. The sales tax is the second largest state tax, accounting for about 36 percent of the total, while the bank and corporation tax accounts for about 12 percent of the total. All three of these taxes are highly dependent on changes in state-level economic activity, including such measures as employment, income, corporate profits, retail spending, and housing construction. Thus, changes in the economy have major impacts on the General Fund revenue outlook.
Recent Revenue Developments. Following healthy increases in 1994-95, the General Fund revenue picture remained positive during the first half of 1995-96. Revenue collections during the July-through-December period were up significantly from the prior year, and have exceeded the 1995 Budget Act estimate by a considerable margin. Moreover, key revenue sources related to current economic activity--such as withholding and corporation tax prepayments--have continued to show healthy year-over-year gains, suggesting that the current higher revenue trend will continue.
Figure 4 summarizes the 1996-97 Governor's Budget revenue forecast. It shows that General Fund revenues are projected to total $45 billion in the current year, a 5.3 percent increase from 1994-95. The administration's estimate is up $982 million from the 1995 Budget Act projection, reflecting recent favorable trends in cash revenue deposits and state economic performance. The budget forecast for 1996-97 General Fund revenues is $45.6 billion, an increase of 1.3 percent.
| Figure 4 Summary of Department of Finance General Fund Revenue Forecast (Dollars in Millions) |
|||
|---|---|---|---|
| Actual 1994-95 | Estimated 1995-96 | Forecast 1996-97 |
|
| Personal income tax | $18,500 | $20,220 | $20,583 |
| Sales and use tax | 14,630 | 15,545 | 16,275 |
| Bank and corporation tax | 5,708 | 5,680 | 5,620 |
| All other | 3,872 | 3,546 | 3,093 |
| Totals | $42,710 | $44,991 | $45,571 |
| Annual percent change | 6.9% | 5.3% | 1.3% |
Budget Proposals. The low 1.3 percent growth in General Fund revenues is partly due to the tax reduction and trial court proposals included in the budget (discussed below), which together will lower General Fund tax receipts by $883 million in 1996-97. Figure 5 shows that after adjusting for these policy changes, the underlying budget-year revenue growth would be a bit higher--3.3 percent. This is a modest improvement but still relatively low, given the moderate growth pace projected for the California economy.
Other Factors. However, several other special factors also are responsible for the low forecasted revenue growth rate in 1996-97. These include the expiration of the temporary 10 percent and 11 percent marginal personal income tax brackets, a reduction in transfers from special funds to the General Fund, and the effects of the phasing in of a variety of previously enacted tax measures. After adjusting for these additional factors, as well as the Governor's new tax reduction and trial court funding proposals, underlying revenue growth would be about 4.7 percent under the budget projection.
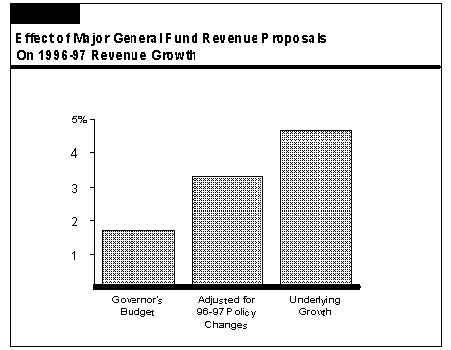
Underlying Forecast Appears Conservative. This underlying 4.7 percent revenue growth implied by the budget is, however, still well below its projected increases in the economy. This primarily reflects the administration's relatively conservative assumptions about how growth in the California economy will affect sales and income taxes during the next two years. The administration's revenue forecast appears to be somewhat conservative given its generally upbeat view for the California economy. As discussed below, if the California economy performs as expected, we believe that revenues will exceed the budget forecast by about $1 billion over the current and budget years combined.
Income Tax Reduction Proposal. The Governor is proposing a variety of tax reductions which would take effect beginning in the 1996-97 fiscal year. The main provision is a 15 percent across-the-board reduction in personal income tax and bank and corporation tax rates, which would be phased in evenly over a three-year period beginning on January 1, 1997. In addition, with the intent of stimulating the economy and job growth, the Governor is proposing a variety of other tax changes, including an increase in the research and development tax credit and a reduction in insurance tax rates on certain annuities.
Taken together, the Governor's tax reduction proposal would lower General Fund revenues by $572 million in 1996-97, by $2 billion in 1997-98, by $3.2 billion in 1998-99, and by $4.7 billion in 1999-2000 when its provisions are fully phased in. Thus, its four-year effect would be a General Fund revenue reduction of $10.8 billion. The Governor's tax proposal is discussed in greater detail in Part V of this volume.
Trial Court Funding Proposal. The Governor's Budget contains a proposal to restructure the trial court program, which has revenue implications in 1996-97 and beyond. The restructuring would include a provision which redirects from the General Fund to the Trial Court Trust Fund fines and penalties imposed by the trial courts. This would result in an annual General Fund revenue reduction (and a corresponding expenditure reduction) of $311 million beginning in 1996-97.
Taken together, the Governor's tax reduction and trial court proposals would reduce General Fund tax revenues by $883 million in 1996-97 and $2.3 billion in 1997-98.
Figure 6 shows the Legislative Analyst's updated General Fund revenue forecast for 1995-96 through 1997-98, based on our economic forecast presented in Part II. The 1996-97 and 1997-98 numbers in Figure 6 include the effects of the Governor's tax reduction proposal and other revenue provisions. (This allows a comparison with the Governor's budget forecast based solely on differences in economic and revenue assumptions.)
| Figure 6 Summary of Legislative Analyst's Office General Fund Revenue Forecast (Dollars in Millions) |
|||||
|---|---|---|---|---|---|
| Actual 1994-95 | Estimated 1995-96 | Forecast 1996-97 | Forecast 1997-98 | ||
| Personal income tax | $18,500 | $20,330 | $20,900 | $21,200 | |
| Sales and use tax | 14,630 | 15,610 | 16,460 | 17,400 | |
| Bank and corporation tax | 5,708 | 5,720 | 5,810 | 5,950 | |
| All other | 3,872 | 3,556 | 3,169 | 3,243 | |
| Totals | $42,710 | $45,216 | $46,339 | $47,793 | |
| Annual percent change | 6.9% | 5.9% | 2.5% | 3.1% | |
The figure shows that:
Given the large share of General Fund revenues accounted for by personal income, sales, and bank and corporation taxes, the state's fiscal performance is heavily dependent on the strength of these revenue sources. In the following sections, we discuss the key assumptions and issues relating to the forecasts for each of the major taxes.
As noted earlier, the state PIT is the General Fund's largest revenue source, accounting for an estimated 45 percent of total General Fund revenue collections in 1996-97. The California income tax generally conforms to federal income tax law, including most of its major income exclusions, exemptions, and deductions. The state's income tax system has six tax brackets, whose marginal tax rates range from 1 percent to 9.3 percent. From 1991 through 1995, there were eight brackets, due to the temporary 10 percent and 11 percent high-income tax rates that expired after 1995.
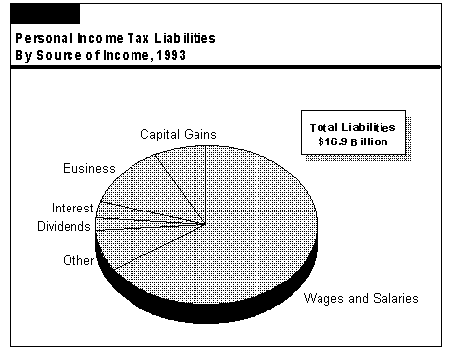
Figure 7 shows that about two-thirds of total PIT liabilities are related to wages and salaries paid to individuals. The next-largest share is business-related earnings, including the income of partnerships and sole proprietors. The remainder is from interest, dividends, capital gains, and other smaller sources.
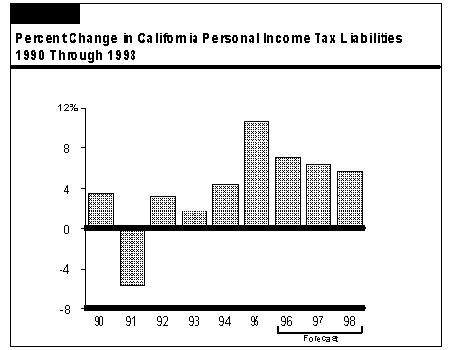
The PIT liabilities fell in the early 1990s, as the recession took a major toll on California wages and business earnings (see Figure 8). However, PIT liabilities stabilized in 1993 as the state's economy began to turn around, and these liabilities experienced significant increases in both 1994 and 1995.
We project that the underlying trend in PIT revenues (that is, revenues adjusted for special one-time anomalies) will continue to expand in line with the strengthening California economy over the next three years. After removing the effects of the elimination of the temporary top marginal tax brackets as well as the Governor's proposed tax reductions, we forecast that underlying PIT liabilities will increase at an average annual rate of 6.5 percent during the 1996 through 1998 period. This is modestly above the 5.8 percent average annual gain projected for statewide personal income.
The relatively healthy increases in PIT liabilities are due in part to continued solid growth in business and investment earnings, which tend to accrue to higher-income taxpayers and thus are subject to the state's higher marginal income tax rates.
While the underlying growth rates in PIT liabilities are expected to remain relatively strong, actual receipts from this source would grow only modestly in both 1996-97 and 1997-98. Specifically, we project that PIT revenues would total $20.9 billion in 1996-97, an increase of just 2.8 percent over the current-year projected amount of $20.3 billion. In 1997-98, we project PIT revenues of $21.1 billion, a growth of about 1.4 percent. These limited growth rates are due to the expanding fiscal impacts of the proposed tax cut, as well as the elimination in 1996 of the 10 percent and 11 percent marginal income tax rates.
Two recent federal developments have a negative impact on personal income tax revenues in our forecast.
Federal Tax Offset Provision. The 1995 Budget Act estimate (and our November fiscal outlook report) assumed that there would be a state revenue gain of $85 million in 1995-96 and annually thereafter from the federal government enacting legislation to collect delinquent state taxes out of the refunds owed to federal taxpayers. (The state currently provides a similar service for the federal government.) However, congressional action has been stalled, at least temporarily, making it unlikely that the program will be implemented in time to affect state revenues this year. Our current forecast, along with the updated budget projection, assumes that the federal program will become operative next year and result in a state revenue gain of $85 million in 1996-97, and additional amounts thereafter.
Out-of-State Retirement Income. On January 10, 1996, the President signed federal legislation which prohibits a state from imposing an income tax on the retirement income of an individual who has moved out of the state and is no longer a resident of it. Prior to this measure, many states, including California, taxed out-of-state distributions from retirement plans and various savings vehicles in cases where the contributions to these retirement plans and accounts had been tax-deferred when the individual was living and working in the state. According to the Franchise Tax Board, this federal measure will reduce state tax collections by about $10 million in 1995-96 and $26 million in 1996-97, with the amounts increasing thereafter. These revenue losses are not reflected in the 1996-97 budget forecast because it was put together prior to the enactment of the new federal law.
The sales and use tax is imposed primarily on the retail sales of tangible goods in California. Services are generally exempt from the tax. Goods purchased by businesses which are not intended for resale (such as computers used by a business, or machinery used in its production process) are also subject to the sales tax, as are materials that go into the construction of homes and buildings. Overall, about two-thirds of the total sales tax "base" is related to retail purchases by consumers, and the remaining one-third is related to business-related purchases.
The "use" tax is imposed on products bought from out-of-state firms by California residents for use in the state. Such purchases are difficult to monitor, and a significant portion of out-of-state purchases escape taxation since the state currently is prohibited by the federal government from requiring out-of-state mail-order businesses to collect the use tax for California. As a result, only a very small percentage of total sales and use tax revenues is from this source.
When all levels of government are considered, the sales tax is California's single largest state revenue source, accounting for over $24 billion in combined state and local revenues. As shown in Figure 9 (see page 44), the overall sales tax rate is actually the combination of several individual rates levied by the state and various local governments.
State-Level Tax Rates. The basic state sales tax rate is 6 percent, of which the General Fund portion is 5 percent and the special fund portion is 1 percent. The special fund portion includes a 0.5 percent tax to fund health and welfare program costs associated with the 1991 realignment legislation, and a 0.5 percent rate dedicated to local public safety programs. The local public safety monies are directly given to localities, and the administration has chosen not to display them in the budget. However, they do represent state tax receipts and we generally report them as such.
Uniform Local Tax Rate. A 1.25 percent uniform local sales tax rate is levied in all counties (this is the so-called Bradley-Burns rate). Of this amount, 0.25 percent is deposited in county transportation funds, while the remaining 1 percent portion is allocated to city and county governments for general purposes. Cities receive the proceeds of the sales taxes collected within their boundaries and counties receive the proceeds from unincorporated areas.
| Figure 9 Sales and Use Tax Rates in California | ||
|---|---|---|
| Current Rate | ||
| State | ||
| General Fund | 5.00% | |
| 1991 program realignment (Local Revenue Fund) | 0.50 | |
| Local Public Safety Funda | 0.50 | |
| Total | (6.00%) | |
| Local | ||
| Uniform local taxesb | 1.25% | |
| Optional local taxes | 1.50c | |
| Total | (2.75%) | |
| Statewide maximum rate | 8.75% | |
| a These revenues are not shown in the Governor's Budget totals. | ||
| b Levied in all counties. | ||
| c Maximum allowable rate, except maximum rate is 1.75 percent in San Francisco and 2 percent in San Mateo Counties. | ||
Optional Local Tax Rates. Local governments are authorized to levy additional local sales taxes for a variety of purposes. Most optional taxes are levied on a county-wide basis, primarily for transportation. These taxes can be levied in 0.25 percent or 0.5 percent increments, and cannot exceed 1.5 percent (except in San Francisco and San Mateo Counties).
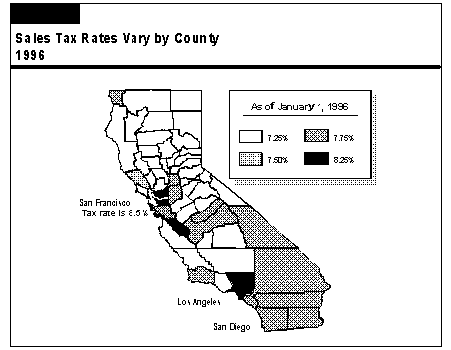
Total State and Local Tax Rates. As shown in Figure 10, the combined state and local sales tax rate in California currently ranges from 7.25 percent for counties that impose no optional sales taxes, up to 8.5 percent in the City and County of San Francisco. No county currently imposes the maximum allowable 8.75 percent rate.
The outlook for the sales tax is primarily determined by the strength of taxable sales. As shown in Figure 11, spending in terms of taxable sales has mirrored overall economic activity in the state over the past 15 years. It grew strongly in the 1980s, declined in the early 1990s, and rebounded as the California economic recovery gained momentum in 1994 and 1995. We forecast that taxable sales will continue to expand in
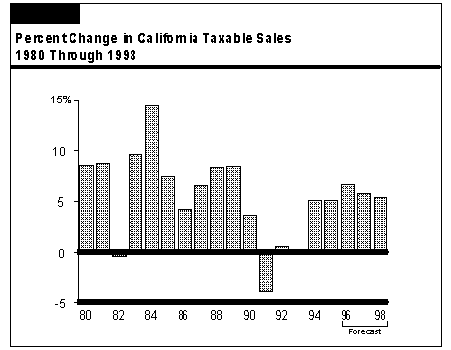
the 1996 through 1998 period, in line with projected increases in key state economic variables such as personal income.
In line with our projections for taxable sales growth, we forecast that sales tax receipts will grow from $15.6 billion in 1995-96, to $16.5 billion in 1996-97, and to $17.4 billion in 1997-98.
Banks and corporations are subject to a general tax rate of 9.3 percent on their taxable profits earned in California. Corporations that qualify for California Sub-Chapter S status are taxed on their income at a 1.5 percent rate. Banks and other financial corporations pay an additional 2 percent tax, which is in lieu of all other state and local taxes except those on real property, motor vehicles, and business licenses.
Multistate and multinational corporations (or groups of affiliated corporations) have their total income apportioned to California, based on California's share of their nationwide or worldwide property, payroll, and sales. Multinational taxpayers, however, can elect to have their California income based on an apportionment of just their domestic, as opposed to worldwide, income.
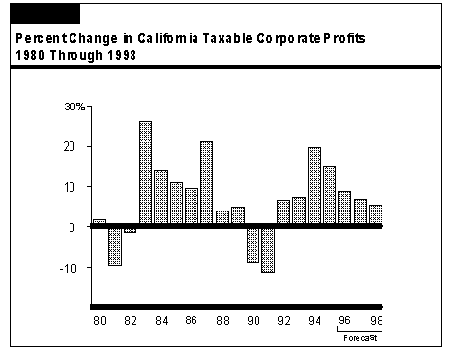
The key to the outlook for bank and corporation tax receipts is the future performance of taxable corporate earnings. Figure 12 shows that these earnings experienced an extended period of weakness from 1988 through 1993, and fell sharply during the first two years of the recent recession. More recently, however, profits have rebounded sharply in response to the economic recovery, increasing by 20 percent in 1994 and by an estimated 15 percent in 1995.
We forecast that taxable corporate profits will increase at an average annual rate of about 7 percent over the next three years. Aside from the overall strengthening in California's economic outlook, profits are benefiting from major increases in business efficiencies. These improvements have resulted from past cost-cutting measures instituted by firms during the recession, as well as ongoing efforts to trim costs and remain competitive. The efficiency measures have been accompanied by numerous business consolidations and employee layoffs, and thus have taken a toll on the California economy over the past several years. However, as a result of these actions, increases in sales and output are now
quickly translating into businesses' "bottom line" earnings and, correspondingly, taxable corporate profits. This should be a continuing force in keeping the profits outlook reasonably good in the near future.
We estimate that bank and corporation tax revenues will total $5.7 billion in 1995-96. This is unchanged from 1994-95. However, two special factors account for the lack of growth and, in their absence, growth would have been over 10 percent. The first special factor is the recent Barclays decision, in which the Supreme Court upheld the state's past application of the unitary method in the apportionment of income to California of worldwide corporations. This decision resulted in $400 million in one-time payments in 1994-95, which bolstered the revenue totals in that year. The second factor is legislation passed in 1993 which provides a tax credit for equipment purchases by manufacturers, beginning in 1995. This will reduce revenues by an estimated $365 million beginning in 1995-96, according to the Franchise Tax Board.
We forecast that bank and corporation tax receipts will grow to $5.8 billion in 1996-97 and to $6 billion in 1997-98, representing an average annual increase of 2 percent over the two years. Again, this low growth is an anomaly, partly reflecting the Governor's tax reduction proposal, which reduces bank and corporation taxes by $110 million in 1996-97 and by $383 million in 1997-98. (Please see Part V for a separate discussion of the Governor's tax reduction proposal.)
The remaining 6 percent of General Fund revenues consists of the insurance, estate, tobacco, and alcoholic beverage taxes, along with a variety of smaller taxes, fees, interest earnings, and transfers from special funds.
Overall, these other revenues are expected to decline from $3.6 billion in the current year to $3.2 billion in both 1996-97 and 1997-98. The decline in 1996-97 is related to two special factors: (1) the Governor's trial court proposal, which reduces General Fund revenues by $311 million beginning next year and (2) a drop in the amount of transfers from special funds--from $293 million this year to $95 million in 1996-97. The phase-in of the Governor's proposed annuity tax rate reduction further dampens revenue growth in 1997-98.
In general, our estimates for the other taxes assume modest growth in insurance and death-related taxes, and continued small declines in tobacco and alcoholic beverage taxes over the next two years. Interest earnings are expected to remain near current levels.
The LAO's forecast is $225 million above the budget forecast in 1995-96 and $768 million above the budget forecast for 1996-97, a two-year difference of $993 million. About $200 million of the combined total can be traced to differences in our respective economic forecasts. However, the majority of the difference--nearly $800 million--relates to the administration's more conservative estimates of how changes in the economy will translate into changes in key revenue-related variables (such as taxable sales, taxable corporate profits, and taxable personal income).
A nearly $1 billion difference is obviously important from a budgetary standpoint. However, a difference of even this magnitude still represents just 2 percent of total projected revenues, and thus is well within the historical range of revenue estimating errors. As indicated below, such a margin could easily be eliminated, for example, by a weaker-than-expected economy over the next year. Thus, while we believe that current trends warrant a higher revenue projection, it is important to point out that our estimates, like all projections, are inherently subject to considerable risk.
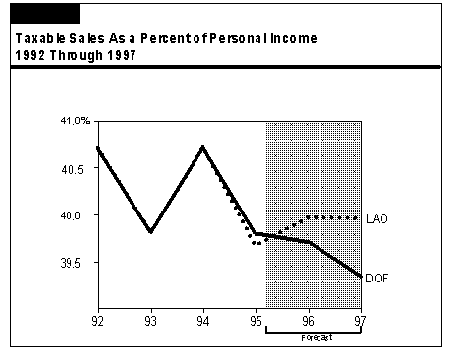
One key area where the administration is more conservative is in its estimate of the proportion of California income which will be spent on items subject to the sales tax. Over the past two decades, the ratio of taxable sales to personal income has trended downward. This is largely due to increased spending on services, which means that an increasingly larger portion of sales transactions are not subject to taxation in California. Examination of this trend over business cycles, however, reveals that most of the downward movement in the ratio has occurred during recessionary periods. The ratio has tended to stabilize and even rise during economic recovery periods. This partly reflects increases in investment spending, purchases of durable goods such as cars and appliances, and spending on building materials that go into new home construction during the recovery phase of economic cycles.
As shown in Figure 13 (see page 50), the LAO forecast assumes that the historical pattern will prevail in the current economic recovery, and that the ratio of sales to income will remain fairly stable during the economic upturn over the next two years. In contrast, the administration assumes that the ratio will continue to fall to an all time low by 1997. As an indication of the significance of these different views about the taxable sales ratio, a 0.5 percentage-point increase/decrease in the ratio is equal to about $210 million more/less in annual state revenues.
1995-96 Forecast. Our current projection of General Fund revenues and transfers for 1995-96 is down $104 million from our November 1995 forecast. On balance, most of the downward revision is related to the federal developments affecting state income tax receipts (discussed above), which will reduce revenues by a combined $110 million this year. We also lowered our sales tax estimate to take into account the weaker-than-expected retail sales both nationwide and in California during the December 1995 Christmas shopping season. Partly offsetting these factors has been a modest increase in our bank and corporation tax estimate, reflecting stronger-than-expected corporation tax prepayments made in December.
1996-97 Forecast. Our forecast for 1996-97 is $1.6 billion lower than our November 1995 forecast. However, about $1.1 billion of this reduction is the result of policy assumptions--namely, the Governor's tax reduction proposal, trial court proposal, and other administrative actions assumed in the budget, which we have incorporated into our forecast to make its policy-related assumptions comparable to the Governor's. The remaining difference--about $500 million--represents a reduction to our underlying forecast. This is primarily due to slight downward revisions to our national and state economic growth forecasts, and historical data revisions that indicate a somewhat lower trend in taxable sales than previously assumed.
Although we project somewhat higher revenues over the next two years than does the administration, both the LAO and the budget forecasts are contingent on continued expansion of the California economy. While this view is consistent with most other forecasts at this time, there is a significant probability that economic growth could be less than we project. Of special concern is the possibility of a significant national economic slowdown, which would adversely affect both California's economy and state revenues. At this time, the two largest national economic forecasting services place the odds of a significant recession during the next three years at about 40 percent.
To provide a general indication of how sensitive state revenues are to the economy, we estimate that if California's employment growth slowed to below 1 percent for the next two years (instead of our standard forecast of 2.4 percent growth), General Fund revenues could fall by more than $2 billion in the current and budget years combined. A full-blown recession would reduce revenues by considerably more.
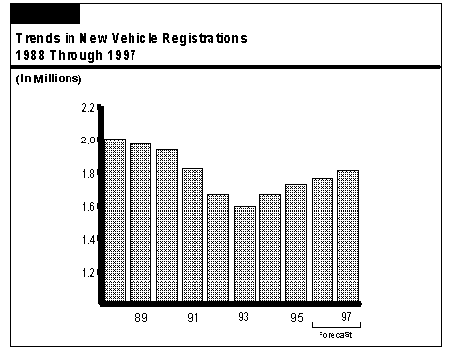
Special fund revenues support a wide variety of specific state and local government programs, ranging from transportation to health care. Figure 14 summarizes the Governor's Budget forecast for special fund revenues. It indicates that motor vehicle-related revenues account for about one-half of the projected 1996-97 special fund revenues. These
| Figure 14 Special Fund Revenues and Transfers 1994-95 Through 1996-97 (Dollars in Millions) |
|||||
|---|---|---|---|---|---|
| Source of Revenue | Actual 1994-95 | Estimated 1995-96 | Forecast 1996-97 | Change From 1995-96 to 1996-97 |
|
| Amount | Percent | ||||
| Motor Vehicle Revenues | |||||
| License fees (in lieu) | $3,136 | $3,258 | $3,398 | $139 | 4.3% |
| Fuel taxes | 2,620 | 2,808 | 2,848 | 40 | 1.4 |
| Registration, weight, and miscellaneous fees | 1,557 | 1,607 | 1,629 | 22 | 1.4 |
| Subtotals | ($7,313) | ($7,673) | ($7,875) | ($201) | (2.6) |
| Other Sources | |||||
| Sales and use taxesa | $3,139 | $3,348 | $3,496 | $148 | 4.4% |
| Cigarette and tobacco taxes | 500 | 478 | 468 | -10 | -2.1 |
| Interest on investments | 110 | 88 | 83 | -5 | -5.7 |
| Other revenues | 2,898 | 3,022 | 3,046 | 24 | 0.8 |
| Transfers and loans | -244 | -164 | -27 | 137 | -- |
| Totals | $13,716 | $14,445 | $14,940 | $423 | 3.4% |
| a Includes Local Public Safety Fund revenues. These amounts are not included in the Governor's Budget presentation. | |||||
include motor vehicle license fees (which are distributed to local governments), and fuel taxes and registration fees (which support transportation-related programs). Other major special fund revenue sources include sales taxes (used for local general purposes, local public safety, and transportation-related purposes) and tobacco-related taxes (primarily used for Proposition 99 purposes).
Special funds are projected in the budget to increase from $14.4 billion in 1995-96 to $14.9 billion in 1996-97, an increase of 3.4 percent. The small gain is the net result of the following factors:
Return to LAO Budget Perspectives and Issues Table of Contents
Return to LAO Home Page