The Governor's Budget proposes spending a total of $58.6 billion from the General Fund and state special funds in 1996-97, as shown in Figure 1 (see page 56). This expenditure level is about $1.4 billion, or 2.4 percent, more than estimated current-year spending of $57.2 billion. Proposed General Fund spending grows by $1 billion, or 2.3 percent. (If the spending figures are adjusted for the proposed restructuring of the Trial Court Funding Program, proposed General Fund spending increases by 3 percent.) Spending from the General Fund comprises 77 percent of the budgeted spending total for 1996-97. Proposed spending for state special funds, as shown in the budget, grows by $391 million, or 3 percent.
Budget Excludes $1.7 Billion of Local Public Safety Fund Spending. Spending amounts shown in the budget for state special funds do not include any spending from the Local Public Safety Fund (LPSF). The LPSF was established by Proposition 172, which was approved by the voters in November 1993. This measure made permanent a temporary half-cent increase in the state sales tax and dedicated the revenue to the LPSF for allocation by the Legislature to cities and counties. These allocations, in effect, offset some of the local revenue loss from shifts of property taxes to schools that were enacted to reduce the state's school funding obligation.
The budget treats the LPSF as a trust fund and excludes it from spending totals. However, we include LPSF expenditures in spending from special funds because the LPSF consists of state tax revenues expended for public purposes. As such, it is not fundamentally different from other dedicated state funds, such as the Motor Vehicle License Fee Account (also constitutionally dedicated to local government), that the budget does include in spending totals. Furthermore, excluding LPSF spending distorts comparisons of state spending before 1993-94 (when the temporary tax revenues were included in General Fund spending totals), with state spending totals in 1993-94 and subsequent years.
As Figure 1 shows, including the LPSF in spending totals adds $1.6 billion and $1.7 billion to spending totals in 1995-96 and 1996-97, respectively. With this adjustment, total proposed spending increases by almost $1.5 billion--from $58.8 billion to $60.2 billion.
| Figure 1 Governor's Budget Proposed and Adjusted Spending 1995-96 and 1996-97 (Dollars in Millions) |
||||
|---|---|---|---|---|
| 1995-96 | 1996-97 | Change from 1995-96 | ||
| Amount | Percent | |||
| Budgeted Spending | ||||
| General Fund | $44,246 | $45,242 | $996 | 2.3% |
| Special funds | 12,942 | 13,333 | 391 | 3.0 |
| Totals shown in budget | $57,188 | $58,575 | $1,387 | 2.4% |
| Adjustments | ||||
| Add Local Public Safety Fund | $1,586 | $1,658 | ||
| Adjusted totals | $58,774 | $60,233 | $1,459 | 2.5% |
In addition to the $60.2 billion of proposed spending from the General Fund and state special funds discussed above, the budget also proposes a total of $34.6 billion of spending from federal funds and from the proceeds of general obligation bonds and lease-payment bonds.
The budget proposes spending $31.2 billion of federal funds in 1996-97. Most of this spending occurs in three program areas. The largest amount is for federal contributions to health and social services programs ($20.4 billion). Education programs receive the second largest share of federal funds ($6.5 billion, including $2.4 billion for support of U.S. Department of Energy laboratories operated by the University of California). Transportation programs will spend a projected $2.1 billion of federal funds in 1996-97.
Compared with the current year, total proposed spending from federal funds declines by $428 million, or 1.4 percent, in 1996-97. This decline reflects a projected reduction in expenditures of federal funds for social services programs, partially offset by modest increases for health and other programs. Federal funds spending for the Employment Development Department drops by a projected $538 million, reflecting anticipated federal budget reductions for job training programs and reduced spending on unemployment benefits due to the improving employment outlook in the state. The budget also projects a decline of $149 million in federal funds expenditures by the Department of Social Services, primarily because of grant reductions in the Aid to Families with Dependent Children (AFDC) program and the assumption that federal AFDC funding will be converted to a block grant.
Budgeted spending from federal funds includes $449 million in the current year and $627 million in 1996-97 in new federal reimbursements for the state's costs of providing illegal immigrants with emergency Medi-Cal health care services and incarcerating illegal immigrant felons. These amounts are consistent with funding levels in federal budget-related legislation, but appropriations had not yet been approved at the time this analysis was prepared due to the federal budget stalemate.
In Part V of this volume, we examine current proposals to reduce federal spending and balance the federal budget and their implications for California.
Expenditures shown in Figure 1 are from current state revenues and, therefore, include capital outlay spending financed directly from current revenues, as well as debt service payments on general obligation bonds and lease-payment bonds. However, Figure 1 does not include spending from bond proceeds (funds derived from the sale of bonds). The budget proposes spending a total of $3.4 billion from bond proceeds in 1996-97--primarily for construction or renovation of educational facilities, prisons, and rail transportation projects.
General Obligation Bonds. General obligation bonds pledge the full faith and credit of the state and must be approved by the voters. Proceeds of general obligation bonds are the major source of financing for proposed state capital outlay and infrastructure programs. The budget estimates that the state will spend $3 billion of general obligation bond proceeds in 1996-97, more than four times the estimated current-year level of $688 million. Most of this new spending would be for educational facilities. The budget includes $1.9 billion for K-12 public school facilities and a total of $424 million for the higher education facilities. These funds would be provided from a bond measure that will appear on the March 1996 ballot, subject to voter approval.
Other significant bond expenditures budgeted for 1996-97 include $180 million for rail projects funded by the California Transportation Commission, and $157 million for adult and youth correctional facilities (about half of this amount would be provided from a new $1.9 billion correctional facilities bond measure proposed for the November 1996 ballot). The budget as submitted does not include any spending from the $2 billion Seismic Retrofit Bond Act of 1996 on the March ballot, which would finance retrofitting of highways and toll bridges. The administration indicates that it has deferred proposing spending from the proceeds of these bonds, pending voter approval and the incorporation of these funds into the State Transportation Improvement Plan by the California Transportation Commission.
Lease-Payment Bonds. In addition to general obligation bonds, the state also has used lease-payment bonds (repaid almost entirely from annual General Fund lease payments) to finance the construction and renovation of facilities. Lease-payment bonds do not require voter approval. They are backed by a state pledge to make annual lease payments (usually from the General Fund) for facilities constructed with the bond proceeds. In the current year, the budget indicates that spending from the proceeds of lease-payment bonds will total $730 million, primarily for higher education facilities ($451 million) and the Department of Corrections ($276 million). For 1996-97, the budget proposes spending approximately $400 million in proceeds from lease-payment bonds. Almost all of this amount is to continue work on previously authorized projects of the Department of Corrections.
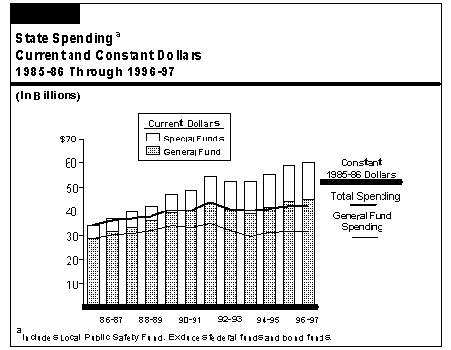
Figure 2 illustrates the trend in state General Fund and special fund expenditures from 1985-86 through 1996-97 (as proposed). The figure shows expenditures in both "current dollars" (amounts as they appear in the budget) and "constant dollars" (current dollars removing the effect of inflation). Using constant dollars allows comparisons of the purchasing power of state spending over time.

During the decade since 1985-86, total spending has grown at an average annual rate of 5.6 percent in current dollars and 2.2 percent in constant dollars. Over this same period, the state's annual rate of population growth also has averaged 2.2 percent. Consequently, spending measured in terms of constant dollars per capita in the current year is the same as it was in 1985-86. However, as Figure 2 shows, the pace of spending growth has varied considerably within this period.
Spending Grew Rapidly Through 1991-92. Spending grew relatively rapidly from 1985-86 through 1991-92, when it reached $54.4 billion. Total spending grew at an average annual rate of 8.2 percent during this period. Even after adjusting for inflation, annual spending growth averaged 4.3 percent. During this period, dollar spending from special funds grew about twice as rapidly as General Fund spending (14 percent annually versus 7 percent annually), which reflected increases in earmarked special fund revenues and the creation of new programs with their own funding sources. Two major contributors to this trend were the approval of Proposition 99 in 1988 (which increased cigarette taxes and earmarked the revenue primarily to augment health programs) and Proposition 111 in 1990 (which authorized increases in the gasoline tax and other transportation revenues).
General Fund spending also grew significantly from 1985-86 through 1991-92. In part this reflected rapid growth in caseloads and costs in health and welfare programs. A strong economy enabled the state to finance this spending growth until 1990-91, when the recession caused a drop in General Fund revenues. Anticipating that the recession would be brief, similar to other postwar recessions, the state continued to fund spending growth for most programs through 1991-92. However, the recession proved deeper and more prolonged than expected, and a large budget deficit resulted despite tax increases and other revenue enhancements.
Spending Declined During the Recession. From 1991-92 through 1993-94, revenues were essentially flat, and a portion of those revenues were used to reduce the accumulated budget deficit. As a result, total spending declined at an annual rate of 2 percent during this period. The decline in General Fund spending was greater--averaging 5.9 percent annually. (A variety of cost deferrals and accounting adjustments that occurred over this period exaggerate this decline somewhat.) However, spending from special funds continued to grow, offsetting a portion of the General Fund decline. This difference in spending growth partly resulted from the creation of the LPSF in 1993-94, which had an effect equivalent to shifting $1.4 billion of revenues and spending from the General Fund to this new special fund.
Spending Growth Resumes with End of Recession. With the resumption of economic growth in California, spending growth has resumed, albeit at a slower pace than in the pre-recession period. During 1994-95 and the current year, total spending will have grown at an annual rate of 5.9 percent (2.7 percent after adjusting for inflation), based on the budget's estimates. Nevertheless, spending in the current year remains below the level of spending in 1991-92 after removing the effects of inflation.
Proposed spending increases by 2.5 percent in 1996-97 (3 percent after adjusting for the redirection of trial court funding), which is roughly in line with the anticipated pace of inflation. However, because of population growth, spending per capita will decline slightly in constant dollars in 1996-97 under the budget proposal.
Figure 3 shows how the budget allocates the proposed $60.2 billion of total spending in 1996-97 among the major state program areas. The figure combines both General Fund and special fund expenditures in order to provide a meaningful comparison of program areas that have different mixes of General Fund and special fund support.
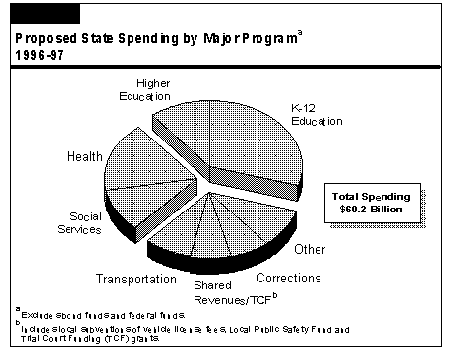
As Figure 3 shows, education receives the largest share of total state spending--a total of 40 percent (K-12 education receives three-fourths of this amount). Education's share of General Fund spending is considerably greater--52 percent. Health and social services programs account for 28 percent of proposed total spending. On a combined basis, slightly more than two-thirds of proposed total spending is for these three program areas.
Figure 4 (see page 62) shows the percentage growth or reduction in spending that the budget proposes for each major program area in 1996-97. Proposed spending growth varies widely by program. The budget proposes the largest percentage spending increase for corrections programs-- 9.4 percent. This growth primarily reflects the costs associated with a projected 12 percent growth in the prison inmate population. In contrast, proposed spending for social services programs declines by 10 percent in 1996-97. This decline reflects the implementation of welfare grant reductions that are awaiting federal approval; budget proposals for additional grant reductions and making temporary
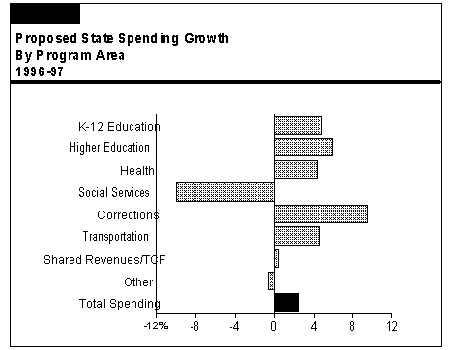
reductions permanent; eligibility restrictions; and savings from assumed federal block grant funding for AFDC.
Over the last ten years, there have been significant changes in the shares of the state budget devoted to some of the major program areas. Examining these program spending trends provides a context in which to view the proposed 1996-97 spending changes.
Education programs consistently have received the largest share of state spending. However, their share of state spending had been declining until recently, as shown in Figure 5. Ten years ago, almost 47 percent of total state spending was devoted to either K-12 or higher education programs. By 1993-94, however, education's percentage of total spending had fallen to 38 percent. Property tax shifts enacted in 1992-93 and 1993-94 contributed significantly to this decline. These shifts replaced a portion of the state's education funding with an equivalent amount of local property tax revenues that were shifted from local governments to schools and community colleges. Consequently, the abrupt drop in education programs' share of the state budget that
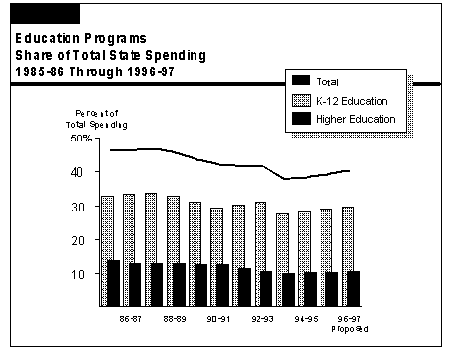
occurred in 1993-94 primarily reflected a restructuring of school funding, rather than a reduction in resources available to education programs.
Higher Education's Spending Share Fell During Recession. The decline in higher education's share of spending was particularly large--from 14 percent in 1985-86 to 10 percent in 1993-94. During the recession, the spending requirements of caseload-driven mandatory programs required increasing shares of the state's stagnant revenues, leaving a smaller share for programs over which the state has more funding discretion, such as higher education. Another factor that moderated spending for higher education was slow growth of the college-age population during this period.
Education's overall share of the budget stayed more or less constant during the recession (excluding the impact of the property tax shifts). This is because the decline in higher education's share was offset by an increase in the K-12 share of spending, which was driven by rising school enrollment and the funding requirements of Proposition 98.
Budget Continues Recent Growth in Education's Share of Spending. Since 1993-94, Figure 5 shows that education's share of the budget has grown and would reach 40 percent of total spending in 1996-97 under the Governor's budget proposal. As shown in Figure 4, the budget proposes spending increases for K-12 education and higher education of 4.8 percent and 5.9 percent, respectively, in 1996-97. These growth rates are about twice the overall spending increase of 2.5 percent in the budget. Two factors are primarily responsible for the growth in education program's share of state spending:
Most state spending in the social services area is for welfare grants to low-income persons in families with children under the AFDC program, or who are elderly, blind, or disabled persons under the Supplemental Security Income/State Supplementary Program (SSI/SSP). Caseloads in these welfare programs grew rapidly through the early 1990s, and grant costs also increased due to statutory cost-of-living adjustments (COLAs). As a result, social services' share of total spending grew from 11 percent in 1985-86 to more than 13 percent in 1992-93, as shown in Figure 6.
Starting in 1991-92, however, the state began to adopt a series of grant reductions to slow the growth of welfare spending. That year, AFDC grants were reduced by 4.4 percent and automatic COLAs were suspended. Additional grant reductions in 1992-93 and 1993-94 that also applied to SSI/SSP grants brought the cumulative reduction in grant levels to more than 10 percent for AFDC and about 8 percent for SSI/SSP. (Further grant reductions also were enacted in 1994-95 and 1995-96, but have not been implemented pending federal approval.) Caseload growth, which had peaked at 11 percent for AFDC in the early 1990s, slowed substantially, partly in response to the end of the
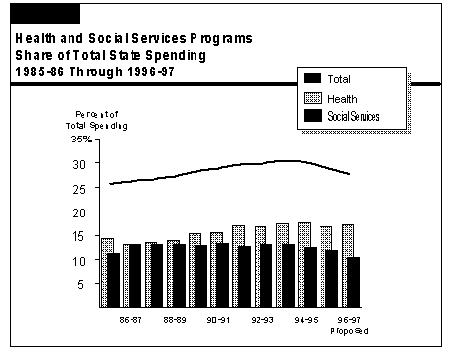
recession and partly due to a variety of demographic and social factors. In the current year, AFDC caseloads are declining slightly, although SSI/SSP caseloads continue to experience moderate growth. The combination of grant reductions and slowing caseload growth now has reduced social services' share of the budget from just over 13 percent to just under 12 percent.
Budget Reduces Social Services Spending by 10 Percent. Under the budget proposal, state spending for social services programs in 1996-97 declines by $700 million, or 10 percent, compared with estimated spending for the current year. Social services' share of total spending would decline to 10.5 percent. Although the budget proposes a new 4.5 percent AFDC grant reduction, the bulk of the savings results from the budget's assumptions that federal welfare reform legislation will enable the state to implement the still-pending welfare grant reductions enacted in 1994-95 and 1995-96, and also provide additional federal funds from a welfare block grant. The budget further proposes to make permanent the COLA suspension and those past grant reductions that were enacted on a temporary basis.
Rising welfare caseloads (welfare recipients qualify for Medi-Cal, the state's major health care program) and rapid inflation in health care costs combined to increase health programs' share of state spending from 13 percent in 1986-87 to 17 percent in 1991-92, as illustrated in Figure 6 (page 65). In contrast to spending on social services, however, the percentage of total spending devoted to health programs has not declined in recent years. Cost containment measures have slowed the growth of health care costs, but the state has not significantly reduced the health care services that it provides.
For 1996-97, the budget proposes some additional cost containment measures, the elimination of some optional Medi-Cal benefits and prenatal care for illegal immigrants, and some funding increases for family planning and teenage pregnancy prevention. The budget also assumes receipt of federal reimbursements totaling $519 million for emergency health care costs of illegal immigrants in the current year and in 1996-97. Proposed state spending for health programs increases by 4.3 percent ($427 million) in 1996-97, as indicated in Figure 4 (page 62).
Corrections Spending Continues on Growth Path. Under the budget proposal, spending on youth and adult corrections would grow by 9.4 percent in 1996-97--similar to the 9.8 percent average annual growth rate for corrections spending over the last ten years. Correctional programs' share of state spending has grown more or less steadily--from 4.3 percent in 1985-86 to 6.4 percent in the current year (assuming the receipt of federal reimbursements for incarceration of illegal immigrant felons that have been included in the budget). In 1996-97, corrections' share of total state spending would increase to 6.8 percent.
Shared Revenues/Trial Court Funding Show Effects of Funding Rearrangements. This area of the budget consists of basic funding support that the state provides to local governments--such as allocations of revenues from vehicle license fees and the LPSF, as well as funding provided to counties for support of the trial courts. In 1993-94, spending on this portion of the budget increased sharply. This reflected the creation of the LPSF, financed with a half-cent portion of the state sales tax. This increase and the corresponding reduction in state education spending in 1993-94 were related, in that allocations from the LPSF were intended, in part, to offset some of the property tax revenues that were shifted from local governments to schools in order to reduce the General Fund's share of the state's Proposition 98 school funding requirement.
For 1996-97, the budget proposes essentially no change in spending for the shared revenues/trial court funding portion of the budget. Moderate growth in shared revenues would be offset by a reduction of $311 million due to the proposed redirection of trial court fines and penalties to an off-budget trust fund.
Transportation Share of Spending Relatively Constant. The share of state spending devoted to transportation programs (including subventions for local streets and roads) dipped slightly below 7 percent from 1987-88 through 1989-90. Otherwise, the transportation share of the budget has remained relatively constant from year to year--generally between 7 percent and 8 percent.
Figure 7 (see page 68) lists the major proposals and assumptions in the 1996-97 Governor's Budget and indicates whether state legislation or federal action is needed to implement them, as well as the timing of the actions assumed by the budget. The figure includes both budget savings actions and proposed spending increases or new programs. The savings or costs shown in the figure represent the amounts estimated in the budget as submitted. They also represent two-year totals in those cases where the budget proposal or assumption affects the current year as well as 1996-97.
As discussed in Part I, a total of $2.6 billion of budget savings depends on federal action (state legislation also is needed to achieve about $600 million of these savings). In addition, the budget counts on approximately $1.3 billion of savings that do not depend on federal action, but do require enactment of state law changes. About $750 million of the total savings assumed in the budget depend on enactment of federal or state legislation in time to achieve savings in the current year.
| Figure 7 1996-97 Governor's Budget Requirements for Legislation or Federal Action (In Millions) |
||||
|---|---|---|---|---|
| Proposal/Assumption | State Legislation Required? | Federal Action Required? | Assumed Effective Date | Savings |
| Savings | ||||
| Implement Previous Budget Savings Actions | ||||
| AFDC and SSI/SSP 1995-96 regional 4.9 percent grant reduction | No | Yes | 1/96 | $204 |
| AFDC and SSI/SSP 1995-96 temporary statewide grant reduction | No | Yes | 1/96 | 119 |
| AFDC 1994-95 grant reduction | No | Yes | 1/96 | 66 |
| Restrict AFDC eligibility of sponsored immigrants | No | Yes | 1/96 | 28 |
| Eliminate SSI/SSP eligibility based on addiction | No | Yes | 1/96 | 6 |
| AFDC maximum family grant | No | Yes | 1/96 | 4 |
| Make Temporary Savings Permanent | ||||
| Welfare | ||||
| AFDC--1992-93 5.8 percent grant reduction | Yes | No | 7/1/96 | $165 |
| AFDC--1995-96 statewide 4.9 percent grant reduction | Yes | Yes | 7/1/96 | 129 |
| AFDC--no COLA | Yes | No | 7/1/96 | 37 |
| SSI/SSP--1992-93 5.8 percent grant reductions | Yes | No | 7/1/96 | 426 |
| SSI/SSP--1995-96 statewide 4.9 percent grant reduction | Yes | Yes | 7/1/94 | 335 |
| Medi-Cal | ||||
| Medi-Cal--continue supplementary drug rebates | Yes | No | 7/1/96 | $35 |
| Renters' Credit | ||||
| Eliminate renters' credit | Yes | No | 1996a | $520 |
| Federal Assumptions | ||||
| Welfare Reform--block grant funds | No | Yes | 1/96 | $353 |
| Reimbursements for illegal immigrant costs | No | Yes | --b | 1,075 |
| New Welfare and Health Reductions/Savings | ||||
| AFDC--new 4.5 percent grant cut | Yes | Yes | 5/96 | $111 |
| SSI/SSP--limit noncitizen and child eligibility | No | Yes | 1/97 | 96 |
| Medi-Cal--eliminate prenatal services for illegal immigrants | Noc | Yesc | 3/1/96 | 87 |
| Medi-Cal--eliminate some optional services | Yes | No | 10/1/96 | 34 |
| Medi-Cal--revise drug ingredient rates and medical supply rates | Yes | No | 10/1/96 | 18 |
| Medi-Cal--reduce "distinct part" nursing facility rates | Yes | Yes | 8/1/96 | 26 |
| Medi-Cal--reduce provider rates; require copayments for optionals | Yes | No | 10/1/96 | 23 |
| Shifts to Special Funds | ||||
| Proposition 99--revise allocations | Yes | No | 7/96 | $40 |
| GAIN--continue use of ETP funds | Yes | No | 7/96 | 20 |
| Augmentations/New Programs | ||||
| Student Aid Commission--increase Cal Grants for private schools | No | No | 7/96 | -$10 |
| Buy out UC and CSU fee increases | No | No | 7/96 | -57 |
| Medi-Cal--family planning project | Yes | No | 1/97 | -20 |
| Public Health--Expand teenage pregnancy prevention | Yes | No | 7/96 | -46 |
| Public Health--augment domestic violence prevention | No | No | 7/96 | -5 |
| Local public safety tax check-off | Yes | No | 1996a | -150 |
| Taxes | ||||
| Governor's tax reduction proposal (net of Proposition 98 offset) | Yes | No | --a | -$222 |
| Offset delinquent state taxes against federal refunds | No | Yes | 1996d | 85 |
| a Assumes enactment in time to affect 1996 tax year liabilities. | ||||
| b Assumes appropriations to provide $449 million in 1995-96 and $627 million in 1996-97. | ||||
| c Assumes federal welfare reform legislation requires termination of this state-only program. | ||||
| d Assumes enactment in time to provide 1996-97 revenue accrual. | ||||
Return to LAO P&I Table of Contents
Return to LAO Home Page