Figure 1 (see page 6) shows the budget from all fund sources for K-12 education for the budget year and the two previous years. Proposition 98 funding constitutes about three-fourths of overall K-12 funding. In 1997-98, Proposition 98 funding is projected to increase by $190 per student to $5,010. This is a 3.9 percent increase from the revised 1996-97 per-student amount.
The budget also proposes to spend $836.9 million from prior-year Proposition 98 funds in 1997-98. As a result of increases in the minimum amounts guaranteed to schools in 1995-96 and 1996-97 (due primarily to higher tax revenues and increased ADA), the state owes schools $629.5 million more for those years (referred to as "settle-up" funds). An additional $207.4 million results primarily from unspent prior-year Proposition 98 funding.
Figure 1 also shows that the budget includes expenditures of $3.2 billion in federal funds in 1997-98. This is $478 million, or 18 percent, more than estimated federal expenditures in the current year. Major changes in federal K-12 funding include the following additional amounts: $226 million for child development, $95 million for Goals 2000, $89 million for child nutrition and $78 million for special education.
School Districts by Type and Enrollment. A total of 5.4 million pupils attended school in California's 999 school districts in 1995-96. Figure 2 (see page 7) provides enrollment data by size of school district. Enrollment levels vary significantly among school districts. For example, the state's largest school district, Los Angeles Unified, enrolled 647,600 students in 1995-96, which is more than the combined enrollment of over 600 of the state's smallest school districts.
| Figure 1 | |||||
| K-12 Education Budget Summary
1995-96 Through 1997-98 | |||||
| (Funding in Millions) | |||||
| Actual
1995-96 |
Estimated 1996-97 | Proposed
1997-98 |
Change From
1996-97 | ||
| Amount | Percent | ||||
| K-12 Proposition 98 | |||||
| State (General Fund) | |||||
| Cash | $16,086.8 | $17,542.7 | $18,919.8 | $1,377.1 | 7.9% |
| Loan repayment | 100.0 | 150.0 | 200.0 | 50.0 | 33.3 |
| Local property tax revenue | 8,574.9 | 8,727.2 | 9,027.5 | 300.3 | 3.4 |
| Subtotals, Proposition 98 | ($24,761.7) | ($26,419.9) | ($28,147.3) | ($1,727.4) | (6.5%) |
| Other Funds | |||||
| General Fund | |||||
| Teachers retirement | $775.4 | $809.4 | $848.7 | $39.3 | 4.9% |
| Bond payments | 721.6 | 762.9 | 812.1 | 49.1 | 6.4 |
| Other programs | 106.8 | 162.4 | 155.5 | -6.9 | -4.2 |
| State Lottery funds | 691.5 | 582.0 | 582.0 | -- | -- |
| Other state funds | 40.4 | 64.1 | 57.5 | -6.6 | -10.2 |
| Federal funds | 2,590.8 | 2,695.0 | 3,173.1 | 478.1 | 17.7 |
| Other local | 2,188.2 | 2,166.4 | 2,161.8 | -4.7 | -0.2 |
| Totals | $31,876.3 | $33,662.2 | $35,938.0 | $2,275.8 | 6.8% |
| K-12 Proposition 98 | |||||
| Average Daily Attendance (ADA) | 5,320,064 | 5,450,480 | 5,578,346 | 127,866 | 2.3% |
| Amount per ADA | $4,636 | $4,820 | $5,010 | $190 | 3.9% |
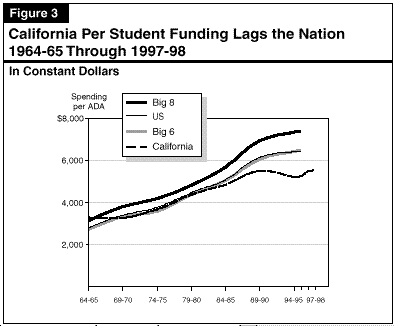
Expenditures per ADA in Comparison to Other States. Figure 3 compares expenditures per ADA in constant dollars (that is, adjusted for inflation) for selected states, the nation as a whole, and California. The states selected for comparison are the eight largest states, which we refer to as the "Big Eight": Florida, Illinois, Michigan, New Jersey, New York, Ohio, Pennsylvania, and Texas. We also show an average for the "Big Six," which includes the eight states less New Jersey and New York. As shown in Figure 3, including New Jersey and New York in the calculation significantly increases the average. New Jersey and New York spent approximately $9,900 per ADA in 1995-96.
Figure 3 shows expenditures per ADA projected through 1997-98 for California. Data for the other states was available through 1995-96. Be-
| Figure 2 | ||||||
| Distribution of School Districts by Enrollment
October 1995 | ||||||
|
Enrollment Level |
Number of Districts | Enrollment | ||||
| Elem | High School | Unified | Total | Total | Percent of Total | |
| More than 200,000 | -- | -- | 1 | 1 | 647,612 | 12.0% |
| 100,000 to 199,999 | -- | -- | 1 | 1 | 130,360 | 2.4 |
| 50,000 to 99,999 | -- | -- | 6 | 6 | 373,113 | 6.9 |
| 40,000 to 49,999 | -- | -- | 3 | 3 | 136,085 | 2.5 |
| 20,000 to 39,999 | 2 | 5 | 33 | 40 | 1,093,180 | 20.2 |
| 10,000 to 19,999 | 21 | 10 | 55 | 86 | 1,214,070 | 22.4 |
| 5,000 to 9,999 | 45 | 17 | 61 | 123 | 877,224 | 16.2 |
| 2,500 to 4,999 | 65 | 18 | 50 | 133 | 478,208 | 8.8 |
| 1,000 to 2,499 | 95 | 25 | 50 | 170 | 303,237 | 5.6 |
| 500 to 999 | 89 | 18 | 22 | 129 | 93,471 | 1.7 |
| Less than 500 | 269 | 11 | 27 | 307 | 63,327 | 1.2 |
| Totals | 586 | 104 | 309 | 999 | 5,409,887 | 100.0% |
| Data exclude county offices of education. Grand total including county offices is 5,467,224. | ||||||
tween 1964-65 and 1984-85 California's spending per ADA was roughly equal to both the US average and the average for the "Big Six." Starting in about 1985, California's spending began to increase at a slower rate, and it actually fell during the early 1990s. In 1995-96 California's expenditures per ADA began to increase again. Even with this turn-around, California expenditures per ADA are about $1,000 lower per student than the U.S. and the Big 6 averages.
The minimum funding levels are determined by one of three specified formulas. Figure 4 briefly explains the workings of Proposition 98, its "Tests," and other major funding provisions. The five major factors involved in the calculation of each of the Proposition 98 "Tests" include: (1) General Fund revenues, (2) state population, (3) personal income, (4) local property taxes and (5) K-12 ADA.
Because these factors change during the year, the minimum guarantee under Proposition 98 also changes. Any additional amount needed to fund any increase in a previous year's guarantee is referred to as Proposition 98 "settle-up" funding. As noted above, the Governor's budget includes $629.5 million related to "settle-up" for prior years ($225.7 million from 1995-96 and $403.8 million from 1996-97).
Figure 4 shows that currently "Test 1" is equal to 34.5 percent of General Fund revenues plus local property tax revenues. This percentage was
originally calculated to be about 40 percent. In recognition of shifts in
property taxes to K-14 schools from cities, counties and special districts,
the rate was adjusted to the current rate of approximately 34.5 percent.
| Figure 4 | ||
| Proposition 98 at a Glance | ||
Proposition 98 guarantees K-14 school agencies an annual amount of funding equal to
the greater of:
This minimum guaranteed amount is determined by the steps below. | ||
| Step 1: Compute "Test 1" | ||
| Test 1. Multiply 34.5 percent times state General Fund revenues and add local property taxes. | ||
| Step 2: Compare Inflation Factors | ||
Compare the annual change in:
The lower of these factors determines which "Test" is compared to Test 1. |
||
| Step 3: Calculate Either Test 2 or Test 3 | ||
| If the per capita personal income change is lower, calculate Test 2. | ||
| Test 2 = Proposition 98 amount provided in prior year (combined state aid and local property taxes) adjusted for change in K-12 ADA and annual change in per capita personal income. Subtract current-year property taxes to yield the General Fund amount under Test 2. | ||
| If the per capita General Fund revenue change is lower, calculate Test 3. | ||
| Test 3 = Same as Test 2 except that the inflation factor used is the annual change in per capita General Fund revenues plus 0.5 percent. | ||
| Step 4: Compare Test 1 to Either Test 2 or Test 3 | ||
| The higher General Fund amount is the "Test" in effect for that year and is the minimum guaranteed by Proposition 98. | ||
| Suspension | ||
| Proposition 98 also includes a provision allowing the state to suspend the minimum funding level for one year through urgency legislation other than the budget bill. | ||
| Restoration ("Maintenance Factor") | ||
| Proposition 98 includes a provision to restore prior-year funding reductions (due to either suspension or the "Test 3" formula). The overall dollar amount that needs to be restored is referred to as the "maintenance factor." | ||
The budget proposes $31.4 billion for Proposition 98 in 1997-98. The shares allocated to the three components remain virtually unchanged from the 1996-97 revised shares. Community College Proposition 98 funding issues are discussed in the Higher Education section of the Analysis (please see Section F).
| Figure 5 | |||||
| Proposition 98 Allocations
1996-97 and 1997-98 | |||||
| (Dollars in Millions) | |||||
| 1996-97 |
1997-98 Proposed |
Change
From
1996-97
Revised | |||
| Budget Act | Revised | Change | |||
| Proposition 98 | |||||
| "Test" | Test 3 | Test 3 |
-- |
Test 3 |
-- |
| Total Proposition 98 | $29,063.8 | $29,516.1 | $452.3 | $31,428.9 | $1,912.7 |
| K-12 Education | |||||
| Amount | $26,016.1 | $26,419.9 | $403.8 | $28,147.3 | $1,727.4 |
| Share | 89.5% | 89.5% |
-- |
89.6% |
-- |
| Community Colleges | |||||
| Amount | $2,956.5 | $3,004.7 | $48.2 | $3,193.3 | $188.6 |
| Share | 10.2% | 10.2% |
-- |
10.2% |
-- |
| Other Agencies | |||||
| Amount | $91.2 | $91.4 | $0.3 | $88.2 | -$3.3 |
| Share | 0.3% | 0.3% |
-- |
0.3% |
-- |
| Figure 6 | ||
| K-12 Education
Governor's Budget Proposals For Prior-Year Revenue | ||
| (In Millions) | ||
| Revenue Limits | ||
| Equalization and deficit reduction | $304.2 | |
| Additional growth in ADA | 264.4 | |
| Subtotal | $568.6 | |
| Program Expansions | ||
| Facilities for class size reduction | $151.0 | |
| CTC alternative credentialing | 9.0 | |
| Standardized account code | 9.0 | |
| Statewide assessments | 6.0 | |
| Single gender schools | 5.0 | |
| Oxnard HSD extended year program | 3.9 | |
| Other | 1.0 | |
| Subtotal | $184.9 | |
| New Programs | ||
| High school technology | $50.0 | |
| Child care facilities | 15.0 | |
| California Student Information System | 10.0 | |
| Angel Gate Academy (at-risk students) | 6.4 | |
| Kern telecommunications | 2.0 | |
| Subtotal | $83.4 | |
| Total | $836.9 | |
| Sources | ||
| Proposition 98 "Settle-Up" | $629.5 | |
| Unspent class size reduction | 140.0 | |
| Proposition 98 Reversion Account | 42.8 | |
| Other sources | 24.6 | |
We discuss the proposals shown in Figure 6 later in this Analysis.
We discuss the details of these proposals later in this Analysis.
| Figure 7 | ||
| Governor's K-12 Budget Proposals
1997-98 Proposition 98 | ||
| (In Millions) | ||
| 1996-97 (revised) | $26,419.9 | |
| Enrollment Growth | ||
| District revenue limits | $438.6 | |
| County offices of education | 13.5 | |
| Special education growth | 74.5 | |
| Summer school growth | 3.7 | |
| Subtotal | $530.3 | |
| Cost-of-Living Increases | ||
| Revenue limits | $490.9 | |
| County limits | 12.4 | |
| Special education | 76.4 | |
| Other | 49.1 | |
| Subtotal | $628.8 | |
| Funding Adjustments | ||
| Class size reduction--base adjustment | $160.1 | |
| School restructuring | -26.4 | |
| Special education adjustments | -51.9 | |
| Other | -6.7 | |
| Subtotal | $75.1 | |
| Program Expansions | ||
| Child care | $26.1 | |
| Mandates | 14.8 | |
| Volunteer mentor | 10.0 | |
| Beginning teacher | 10.0 | |
| Assessment | 4.4 | |
| Early mental health initiative | 3.0 | |
| Subtotal | $68.3 | |
| New Programs | ||
| Class size reduction--additional grade | $296.8 | |
| Special education reform | 76.7 | |
| Ed Tech Center | 1.0 | |
| K-12 fiscal data | 0.5 | |
| Subtotal | $375.0 | |
| Proposition 98 loan repayment | $50.0 | |
| 1997-98 (proposed) | $28,147.3 | |
| Change from 1996-97 (revised) | $1,727.4 | |
Except for revenue limits, the largest K-12 program is special education. Including a proposed General Fund set-aside for funding reform, special education funding is expected to increase by $180 million in 1997-98. The class size reduction program, started in 1996-97, will be the second largest categorical program in 1997-98, with proposed expenditures of $1.3 billion. Funding for most other categorical programs remains flat in 1997-98 because the Governor's budget includes neither COLA nor growth funding for these programs.
| Figure 8 | ||||
| Major K-12 Education Programs
Funded by Proposition 98 1996-97 and 1997-98 | ||||
| (Dollars in Millions) | ||||
| Estimated
1996-97 |
Proposed
1997-98 |
Change From
1996-97 | ||
| Amount | Percent | |||
| Revenue Limits | ||||
| Schools | $10,558 | $11,201 | $643 | 6.1% |
| Counties | 174 | 191 | 17 | 9.5 |
| Property tax revenue | 8,512 | 8,808 | 296 | 3.5 |
| Subtotals, revenue limits | ($19,244) | ($20,199) | ($955) | (5.0%) |
| Special Education | ||||
| State General Fund | $1,860 | $1,959 | $99 | 5.3% |
| GF set-aside for reform | -- | 77 | 77 |
-- |
| Property tax revenue | 215 | 220 | 5 | 2.2 |
| Subtotals, special education | ($2,075) | ($2,256) | ($180) | (8.7%) |
| Mega-Item--
Categorical Programs |
||||
| Desegregation | $546 | $496 | -$49 | -9.0% |
| Economic impact aid | 366 | 416 | 49 | 13.5 |
| Home to school transportation | 480 | 478 | -2 | -0.4 |
| School improvement | 360 | 360 | -- |
-- |
| Instructional materials | 157 | 157 | -- |
-- |
| Other programs | 551 | 534 | -17 | -3.1 |
| Subtotals, Mega Item | ($2,461) | ($2,442) | (-$19) | (-0.8%) |
| Other Programs | ||||
| Class size reduction | $771 | $1,259 | $488 | 63.3% |
| Child development | 517 | 556 | 40 | 7.6% |
| Adult education | 452 | 452 | -- |
-- |
| ROC/P | 272 | 272 | -- |
-- |
| Summer school | 155 | 163 | 8 | 4.9 |
| Mandates | 105 | 120 | 15 | 14.1 |
| Deferred maintenance | 35 | 35 | -1 | -2.4 |
| Early mental health | 12 | 15 | 3 | 25.0 |
| Volunteer mentor | -- | 10 | 10 | -- |
| Other programs | 170 | 170 | -1 | -0.4 |
| Subtotals, other programs | ($2,489) | ($3,051) | ($561) | (22.5%) |
| Proposition 98 loan repayment | $150 | $200 | $50 | 33.3% |
| Totals | $26,420 | $28,147 | $1,727 | 6.5% |