![]() 1996 Economic Performance in Retrospect
1996 Economic Performance in Retrospect
The Budget's Economic Outlook in Brief
Comparison of Recent Economic Forecasts
A Regional Perspective on California's Outlook
California's Demographic Outlook
The impact of the economy on the state's budget condition has been particularly significant in recent years. California's severe recession in the early 1990s contributed to major funding shortfalls in the 1991-92 through 1994-95 General Fund budgets, while the subsequent and ongoing economic expansion has led to noticeable improvements in the budget's condition. The Governor's current budgetary proposal is predicated on continued, though moderating, economic growth through 1998.
In this part, we review the recent performance of the national and California economies, discuss recent demographic trends in the state, summarize the economic and demographic forecasts assumed in the 1997-98 Governor's Budget, and provide our own perspective regarding the economic and demographic outlooks for California.
| Figure 1 | ||
| 1996 Economic Performance in Retrospect | ||
| Economic developments were mostly positive . . . | ||
| However, some problems remained | ||
An especially favorable development was the strong note on which the year ended. Real GDP increased by 4.7 percent during the October-through-December quarter, led by strong growth in exports and consumer spending. Preliminary evidence for January indicates that good economic performance is continuing, with the economy settling into a moderate growth pace.
Inflation. Price inflation remained low in 1996, with the Consumer Price Index (CPI) increasing by about 3 percent during the year. The "core" rate of inflation (which excludes the volatile food and energy sectors) increased by just 2.6 percent--the lowest rate in 31 years. Accelerating gains in hourly earnings during the latter part of 1996 suggest that wage pressures will eventually translate into some increase in the core inflation rate in 1997. However, most forecasters expect the near-term increase in the overall inflation rate to be limited, due to continued softness in prices of food and raw materials, as well as strong competition from abroad.
Financial Markets. Interest rates rose modestly over the past twelve months, but as of early 1997 remain well within the range experienced in recent years. Stock market prices surged to record levels over the past year, led by record inflows of investor funds and continued strong corporate earnings. The dramatic increase in stock prices has boosted the wealth of U.S. households, and has contributed to increasing their incomes through such avenues as stock options and dividend payouts. At the same time, however, the current high ratio of stock prices relative to current corporate earnings has led to concerns about whether the stock market is vulnerable to a major downward correction and, if so, what effect a major setback of this sort would have on the economy at large.
Other Positive Developments. In other developments, personal income increased by over 7 percent, reflecting healthy gains in wages, business earnings, and investment income. Nonresidential construction activity rebounded during the year, led by a nearly 34 percent increase in the San Francisco Bay Area. Finally, international trade through California customs districts increased by 17 percent during the first three quarters of 1996, led by major growth in exports to Pacific Rim countries and to Mexico. Growth in international trade has had especially positive effects on a number of California industry sectors, including manufacturing, transportation, and wholesale trade.
Restructuring--Still Taking a Toll. A second area of concern involves the further consolidations taking place in certain key industries, such as aerospace. For example, there have been recent mergers involving major California aerospace-related companies such as Hughes Electronics, McDonnell Douglas, and Rockwell. Presumably, these restructurings make economic sense to the companies involved, and may even boost California's economic health in the longer term. However, they also produce various economic dislocations, at least in the near term. Thus, even though the worst of aerospace job losses are over, the job outlook for many workers remains uncertain. The finance sector is another area where ongoing uncertainty persists regarding continued restructuring. Although such restructuring is aimed at making the companies involved more efficient and thus competitive in the longer term, it produces a variety of negative economic outcomes in the shorter term, including job losses.
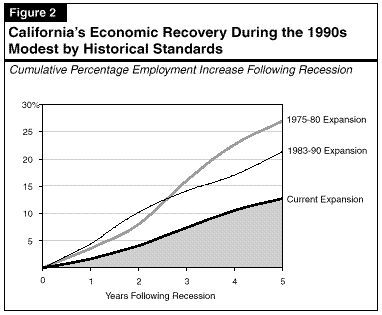
This "half-speed" recovery has had significant implications for California's fiscal condition. It has resulted in a slower improvement in the state's fiscal balance sheet than was the case following past recessions. It also implies that future budgets cannot count on rapid revenue growth to ease fiscal pressures.
The Budget's Economic Outlook in Brief
| Figure 3 | |||
| Summary of Department of Finance's Economic Outlook | |||
| Percent Changesa | |||
| Projected | |||
| Preliminary 1996 | 1997 | 1998 | |
| United States forecast | |||
| Real GDP | 2.3% | 2.4% | 2.5% |
| Pre-tax corporate profits | 4.8 | 2.4 | 8.1 |
| Unemployment rate (%) | 5.4 | 5.2 | 5.2 |
| Federal funds interest rate (%) | 5.3 | 5.1 | 5.0 |
| California forecast | |||
| Personal income | 7.2% | 6.6% | 5.9% |
| Wage and salary jobs | 2.7 | 2.6 | 1.9 |
| Consumer prices | 2.0 | 2.7 | 2.7 |
| Taxable sales | 6.8 | 5.0 | 4.3 |
| Unemployment rate (%) | 7.3 | 6.8 | 6.9 |
| New housing permits (000) | 94 | 110 | 121 |
| a Unless otherwise indicated. | |||
| Figure 4 | ||||
| Summary of the LAO's Economic Outlook | ||||
| Percent Changesa | ||||
| 1996 | 1997 | 1998 | 1999 | |
| United States | ||||
| Real GDP | 2.5% | 2.2% | 2.3% | 2.0% |
| Personal income | 5.5 | 5.1 | 4.9 | 4.9 |
| Wage and salary jobs | 2.0 | 1.5 | 1.4 | 1.5 |
| Consumer Price Index | 2.9 | 2.8 | 2.9 | 3.1 |
| Unemployment rate (%) | 5.4 | 5.5 | 5.6 | 5.7 |
| Housing starts (000) | 1,474 | 1,359 | 1,307 | 1,318 |
| California | ||||
| Personal income | 7.3% | 6.3% | 5.6% | 5.5% |
| Wage and salary jobs | 2.8 | 3.1 | 2.3 | 2.4 |
| Consumer Price Index | 2.1 | 2.9 | 2.9 | 3.0 |
| Unemployment rate (%) | 7.3 | 6.7 | 6.1 | 5.9 |
| New housing permits (000) | 96 | 108 | 122 | 137 |
| a Unless otherwise indicated. | ||||
| The CPI Controversy . . .
For some time, there has been concern that the Consumer Price Index (CPI) overstates inflation, and that this in turn drives up the cost of government expenditures in entitlement programs whose recipients receive cost-of-living adjustments (COLAs) tied to the CPI (for example, the California Necessities Index [CNI], which is used for adjusting welfare benefits). Recent Commission Findings In December, a bipartisan advisory commission reported to Congress that the Consumer Price Index overstates inflation by slightly over 1 percentage point per year, and made several recommendations regarding how to deal with this bias. The report cites two principal factors as being responsible for the inflation overstatement. The first is a substitution bias, which occurs because the CPI is a "fixed-weight" index that fails to account for the substitution by consumers from more-expensive to less-expensive goods when relative prices change. The second factor is a quality change bias, which occurs when improvements in the quality of products are not fully accounted for in measuring their prices or when new products are not included in the CPI's calculation at all. The commission recommended a two-track approach to adjusting for the bias. Methodological Changes. The first track involves implementation of specific changes to the way the Bureau of Labor Statistics (BLS) calculates the CPI. These changes include continuous updating of the spending weights in the CPI (the weights have been updated only periodically in the past), and the more frequent inclusion of new products in the CPI's price surveys. Separate Inflation Adjustments. The second track involves subtracting part or all of the estimated bias remaining in the CPI at |
| . . . Recent Developments
given points in time for purposes of making cost-of-living adjustments to federal expenditure programs. Effect on State Programs Methodological Changes. To the extent that the Commission's recommended methodological changes are adopted by the BLS, any resulting reduction in the CPI's inflation measure could affect state COLAs that are tied to--or influenced by--the CPI or its components. (For example, even though the weights in the CNI are different from the CPI, changes in the inflation rates of certain CPI components could affect overall CNI inflation.) Any such changes could also affect state personal income taxes (through their impact on the annual indexing adjustment), and local property taxes (through their effects on assessed valuation growth under Proposition 13). However, it is important to note that some of the methodological changes would require federal legislation and additional funding for the BLS. Even if the changes are made, it is unlikely that they would eliminate all of the bias inherent in the current index. Thus, the timing, magnitude, and scope of future changes to BLS methodologies resulting from the commission's recommendations currently are uncertain. Separate Inflation Adjustments. The establishment of a separate cost-of-living adjustment for federal programs (whether by simply adjusting the CPI downward or using an entirely new alternative adjustment factor), if approved by Congress, would not directly affect state programs, although the Legislature could choose to make similar adjustments to state COLAs. However, the reduction in federal COLAs could affect federal contributions to some jointly funded programs, such as SSI/SSP. Exactly what steps the federal government will be taking regarding the CPI bias and how to deal with it in the context of federal expenditure programs will likely become clearer later this year. |
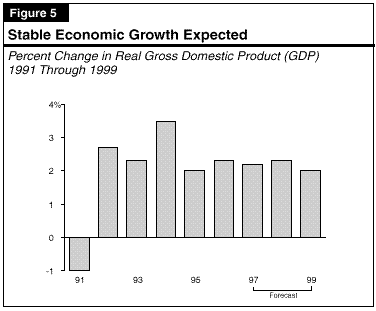
Business Investment Leading the U.S. Expansion. We project that the U.S. economy will be led by gains in business investment, as firms continue to modernize and expand their use of high-technology innovations. We anticipate that consumer spending will grow no faster than the overall economy, as high consumer debt levels restrain household expenditures through the forecast period. Federal government spending is pro-jected to grow slowly, due to continued pressure to reduce the deficit.
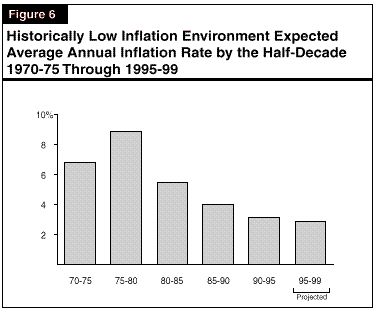
Inflation to Remain Low. As Figure 6 (see next page) shows, we expect inflation to remain at historically low levels, with the CPI increasing by slightly less than 3 percent annually between 1996 and 1999. Increases in wage rates are expected to put some upward pressure on price levels; however, increases in product prices in many industries likely will be restrained by strong international competition.
Reflecting the moderate growth and stable inflation environment, we project that interest rates will remain near current levels during the forecast period.
As Figure 7 shows, however, California has regained its "growth margin" over the nation. It indicates, for example, that economic growth in California in terms of job gains surpassed the rest of the U.S. in 1996, and we expect this trend to continue through 1999. Our forecast that the state will out-perform the nation over the next several years reflects the relatively favorable outlook for this state's key manufacturing and services industries, as well as the fact that California remains in an earlier stage of its economic expansion than the rest of the country.
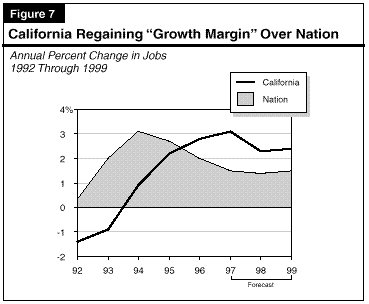
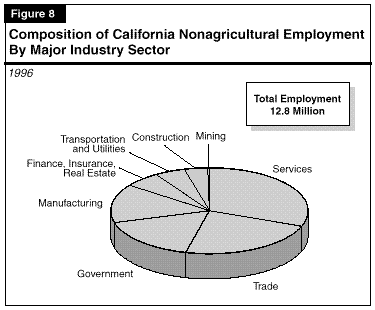
Figure 8 also indicates that about one-fourth of the workforce is in the trade sector, which includes retail stores, wholesalers, and import-export businesses. Another one-sixth of jobs is in manufacturing industries, including aerospace and commercial computers and electronics. (This sector's share of output in the economy significantly exceeds its share of employment, due to its high degree of automation.) The remaining jobs are in government, construction, finance-related, transportation, utilities, and various other smaller industry sectors.
Services to Lead California's Economy. Figure 9 shows our outlook for job growth in individual industry sectors in California. It indicates that in both numeric and percentage growth terms, services will continue to lead the state's expansion over the next three years--accounting for over one-half of the 1 million in total new jobs projected to be created during this period. As in recent years, we expect that a large number of the new services jobs will be in high-paying, high-skilled job categories, including computer services, software design, and motion picture-related occupations.
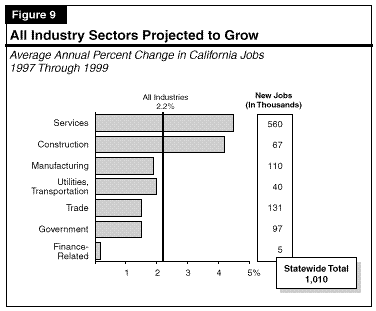
Construction Gains Expected. Construction employment is forecast to increase by an average annual rate of 4.2 percent over the forecast period, due to anticipated gains in both residential and nonresidential construction activity. Although this outlook is favorable given the stagnant growth thus far experienced in this sector since the recession, total employment in this industry will still remain below prerecession levels.
Positive Outlook for Manufacturing. Manufacturing employment is expected to grow at an average annual rate of about 1.9 percent over the next three years. While Figure 9 shows that the increase for this sector is modest compared to the gains projected for services and construction, the outlook is quite favorable when compared to the rest of the nation, where manufacturing is expected to decline slightly. California's more favorable expected performance is due to the presence of a large number of fast-growing computer and electronic firms, as well as continued growth in the apparel and textile industries in the state.
Figure 10 shows that aerospace and finance-related industries combined lost 264,000 jobs between 1990 and 1995. These declines added to the depth of the state's recession during the 1990 through 1993 period, and held down economy-wide growth during the early stages of the recovery.
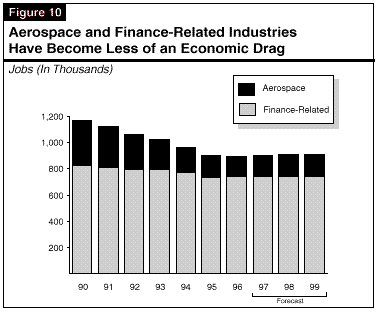
However, the job losses subsided sharply in 1996, and our forecast assumes that the two industries will grow marginally over the next three years. While the net increases will be extremely limited due to further consolidations, at least the two industries will no longer be as significant a drag as previously on California's economic growth.
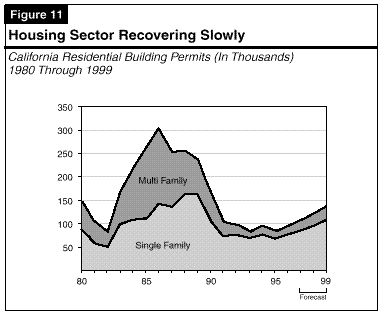
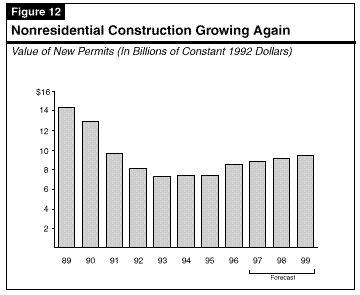
Figure 13 compares our current forecast to the budget's economic projection, as well as UCLA's December 1996 projections and our November 1996 outlook. It shows that compared to the budget's economic forecasts, we project slightly less growth in personal income, but more growth in taxable sales. The difference between the taxable sales forecasts have significant revenue implications, as discussed in Part III.
| Figure 13 | ||||
| Comparison of Economic Forecastsa | ||||
| Percent Changes | ||||
| 1996
b |
1997 | 1998 | 1999 | |
| United States Real
Gross Domestic Product: |
||||
| LAO November | 2.4% | 2.2% | 1.9% | 2.2% |
| UCLA December | 2.3 | 2.5 | 2.4 | 2.4 |
| DOF January | 2.3 | 2.4 | 2.5 | -- |
| LAO February | 2.5 | 2.2 | 2.3 | 2.0 |
| California Wage and
Salary Employment: |
||||
| LAO November | 2.7% | 2.8% | 2.3% | 2.1% |
| UCLA December | 2.8 | 3.1 | 2.3 | 1.9 |
| DOF January | 2.7 | 2.6 | 1.9 | -- |
| LAO February | 2.8 | 3.1 | 2.3 | 2.4 |
| California Personal Income: | ||||
| LAO November | 7.4% | 6.1% | 5.5% | 5.3% |
| UCLA December | 7.9 | 5.7 | 5.6 | 5.6 |
| DOF January | 7.2 | 6.6 | 5.9 | -- |
| LAO February | 7.3 | 6.3 | 5.6 | 5.5 |
| Taxable Sales: | ||||
| LAO November | 7.7% | 6.1% | 5.5% | 5.1% |
| UCLA December | 6.9 | 5.5 | 6.1 | 6.5 |
| DOF January | 6.8 | 5.0 | 4.3 | -- |
| LAO February | 7.0 | 5.8 | 5.5 | 5.3 |
| a Acronyms used apply to Department of Finance (DOF); Legislative Analyst's Office (LAO); and University of California, Los Angeles (UCLA). | ||||
| b All 1996 estimates are preliminary. | ||||
Figure 13 also shows that, relative to our November 1996 forecasts, we are now projecting slightly faster increases in employment and income, but slower gains in taxable sales. These adjustments primarily reflect the incorporation of more-recent historical revisions to employment, sales, and income data, rather than any fundamental reassessment of the basic economic outlook.
Finally, the figure shows that our current projections, particularly of employment growth, are generally similar to UCLA's December forecast.
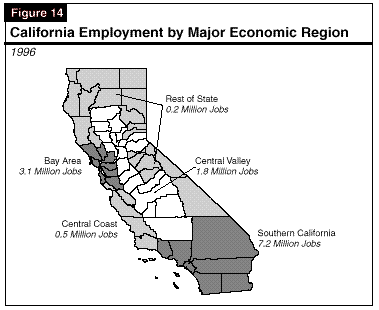
The nine-county San Francisco Bay Area accounts for about 3 million, or about one-fourth, of the state's total jobs. This region includes the high technology industries of Silicon Valley, as well as a large number of businesses involved in services, wholesale and retail trade, tourism, multimedia activities, and international trade.
The Central Valley region accounts for about 1.8 million of California's job totals. It has long been the state's major agricultural region. In more recent years, however, it has seen growth in manufacturing and services industries, as people and firms have migrated out of the heavily populated coastal regions of Northern and Southern California.
The remaining two regions--the Central Coast and the rest of the state--account for a relatively small share of California's jobs. However, they have experienced significant growth in recent years and should continue to do so in the future.
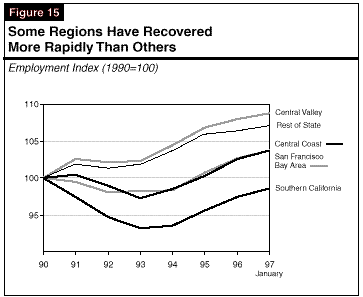
The figure shows that the recession that hit Northern California was comparatively mild, with the San Francisco Bay Area experiencing job losses of less than 2 percent between 1990 and 1993, and the Central Valley actually adding jobs during the period.
In contrast, the downturn in the south was severe, with employment falling by nearly 7 percent during the same interval. And, within Southern California, Los Angeles County lost over 11 percent of its total jobs during this three-year period.
Figure 15 also shows that while four of the state's five economic regions have now surpassed their prerecession employment peaks, Southern California has yet to fully recover its job losses from the recession. The continued weakness in the south is, again, concentrated in Los Angeles County, which is still down over 250,000 jobs from 1990.
A third (and more fundamental) factor is that the recession coincided with more basic underlying changes taking place in Southern California's economy--particularly in Los Angeles County. These changes have involved a shift away from manufacturing activities and toward a more services-based and trade-based economy. Such changes have been painful for the region, especially in terms of the permanent job losses they have caused in many of the region's shrinking industries. However, the emerging growth in movie production, entertainment, multimedia, and international trade-related businesses is leading to a more diversified economy than in the past--and thus one which is less vulnerable to economic malaise caused by downturns in just one or a few industries.
Given these factors, we expect the Southern California region to continue expanding in line with the state's overall economy during the next three years.
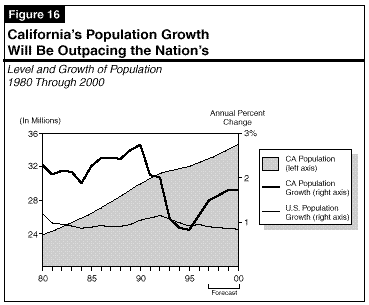
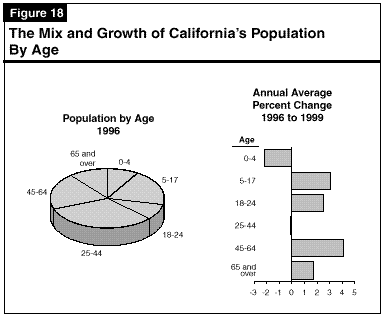
The figure also shows that the state's population growth rate fell below the nation's during the first half of the 1990s, largely reflecting the effects of the recession. However, this situation has reversed itself, and we expect California's population growth rate to outpace the nation's during the next three years.
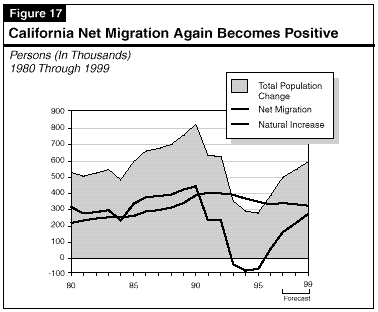
Net Migration Behavior. Net migration itself can be broken down into two categories--domestic (movement between California and the other 49 states) and foreign (movement between California and other countries).
Substantial numbers of both domestic and foreign migrants made their way into California during the 1980s. California continued to experience a sizable in-flow of population from other countries during the first half of the current decade, but this gain was offset by a large-scale net out-migration of Californians to other states. While most demographers expect net foreign migration to remain stable in the next few years, projecting future domestic migration flows into and out of the state is the topic of some controversy (see shaded box on pages 48 and 49).
Our demographic forecast assumes that net domestic out-migration will slow
during the next two years and reverse completely by the end of the decade, as the
state's improving economy reduces the exodus of existing residents seeking economic
opportunities elsewhere.
Controversies Regarding California Demographic DataThe U.S. Bureau of the Census disagrees with the Department of Finance (as well as various other state demographers) regarding both their estimates of California's current population and their forecasts about net domestic migration that the state will experience in coming years. For instance, Census estimates that there were 31.6 million residents in California as of July 1, 1995; in contrast, the department estimates that the number is slightly above 32 million. With respect to net migration, Census projects large net domestic out-migration from California well into the next century; in contrast, the department believes that the outflow is declining and soon will reverse itself. These divergent views regarding the future course of net domestic migration are in large part rooted in differences in the statistical methodology and underlying demographic data that are used to produce migration forecasts. Basic Data Problems. Unfortunately, no single data source provides estimates of California migration flows that are both dependable and timely. The Internal Revenue Service (IRS) maintains change-of-address data (based on tax returns) which are relatively reliable, but are published with a time lag. Conversely, address changes from the California Department of Motor Vehicles (DMV) driver's license records provide a more timely, but less reliable, measure of domestic migration flows. The raw DMV data, for example, significantly understate the population outflow from California in any given year, because not all members of a household possess a driver's license and because of incomplete reporting by other states of these data. Methodological Issues. Census utilizes the IRS data and models future migration as a function of past migration, placing heavy em phasis on the most recent observations. Because the IRS data are available only with a time lag, the most recent observations available are from the years when net domestic migration outflows peaked (1993 through 1995). Census assumes that the large out-migration that California experienced during these years will continue throughout the remainder of the decade. The main reason why so many Californians left the state during its peak domestic out-migration years appears to have involved the state's especially severe recession and delayed recovery. Now that California's recovery seems firmly established and reasonably good job growth is again occurring, however, it seems appropriate to assume that the outflow of Californians moving to other states should slow, thereby reducing net out-migration. The department and various other state demographers have concerns that Census is not taking sufficient account of the fact that California's domestic migration flows are affected by differences in economic opportunity between California and other states. As a result, they believe that Census projections overstate California's domestic out-migration and thus understate its population. However, there is no consensus among these demographers regarding what the domestic migration assumptions should be. The Department of Finance is assuming that out-migration is slowing dramatically, and thus has significantly higher population estimates for California than does Census. Our own estimates (beginning with 1996) lie between these two extremes, but are closer to the department's. When Will the Issue Be Resolved? A full reconciliation of California's population estimates from Census and the department will not be feasible until the next actual population count, scheduled for the year 2000. There will, however, be additional information available in the meantime, such as new IRS tax return data. The extent to which these and other interim data will clarify California's true population trends remains to be seen. |
