![]()
Table of Contents
Perspectives on State Revenues
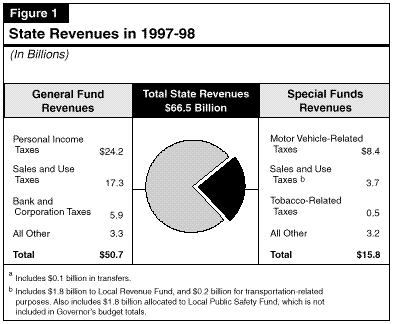
California's state government will collect an estimated $66.5 billion in
taxes and other revenues in 1997-98. These collections fall into two
broad categories--General Fund revenues and special funds revenues.
Revenues deposited into the General Fund are allocated through the budget process each year and support a variety of state programs, including education, criminal justice, and health and welfare. In contrast, special funds revenues are generally earmarked for specific purposes, such as transportation-related activities, targeted health programs, and support to local governments. Some taxes, such as the sales and use taxes and tobacco taxes, are allocated among both the General Fund and special funds.
Figure 1 (see next page) shows that slightly over three-fourths of the total $66.5 billion in state revenues will go into the General Fund, while slightly less than one-fourth will go to special funds.
The figure also shows that following three years of virtually no growth in the early 1990s, total revenue collections resumed an upward path in 1994-95 and 1995-96, reflecting the positive effects of California's economic recovery on tax receipts. We expect the positive trends to continue in 1996-97 through 1998-99, in line with the continued growth we are projecting for California.
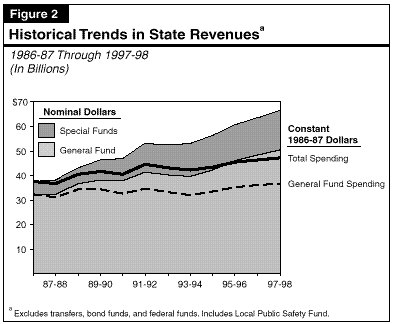
General Fund Versus Special Funds Growth. The annual average growth in revenues (excluding transfers and including Local Public Safety Fund revenues) over the past decade has been faster for special funds (11 percent) than for the General Fund (4.1 percent). The difference partly reflects the impact of the recent recession on the General Fund's income and sales taxes during the early years of the 1990s. The difference also is due, however, to legislative and voter-approved tax-law changes which have raised various special fund taxes. These include the voter approval of gasoline tax increases in 1990, the creation of the one-half cent Local Revenue Fund sales tax in 1991, and voter approval of a one-half cent sales and use tax for local public safety in 1993.
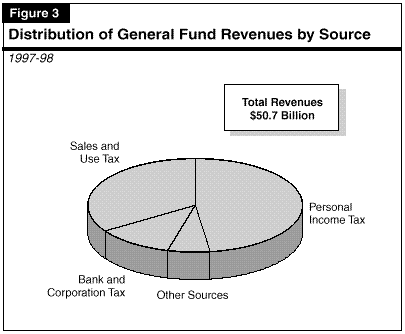
The remaining 6 percent of total General Fund receipts is primarily attributable to various other taxes, a variety of fees, and investment earnings. The larger components within the "other taxes" category include the insurance, estate, cigarette, and alcoholic beverage taxes.
An important feature of the state's General Fund is that all three of its major revenue sources are highly sensitive to changes in California's economic performance. Personal income taxes are significantly affected by the level of and growth in wages, business earnings, and investment income. Sales and use taxes are affected by changes in consumer spending, housing construction, and business investment. And bank and corporation taxes are highly dependent on California corporation profits. For these reasons, changes in California's economy have major impacts on the performance and outlook for General Fund revenues.
Figure 4 summarizes the 1997-98 Governor's Budget revenue forecast. It shows that General Fund revenues and transfers are projected to increase from $46.3 billion in 1995-96 to $48.4 billion in 1996-97 (a 4.6 percent growth) and $50.7 billion in 1997-98 (a 4.7 percent growth).
1996-97 Revenues. The 4.6 percent 1996-97 growth rate understates the underlying revenue trend, due to several factors which have affected the revenue totals in both the current and prior years. These include the expiration of the 10 percent and 11 percent marginal income tax brackets at the end of 1995, the corporation tax rate reduction enacted in 1996, and a large one-time estate tax payment which was received during 1996-97 but accrued back to 1995-96.
1997-98 Revenues. The budget-year's revenue growth will again be led by personal income taxes, which are projected to increase by 7 percent during the year. As in the current year, budget-year General Fund revenues will be affected by a variety of factors in addition to the underlying revenue trend. These factors include the phasing-in fiscal impact of the corporation tax rate reduction for 1997, the Governor's proposed additional corporate tax rate reductions for 1998 and 1999 (discussed below), and the Governor's trial court realignment proposal. Eliminating the effects of these factors, the budget's forecasted growth rate for 1997-98 would be about 5.7 percent. This underlying growth is modestly lower than the gains the administration is projecting for statewide personal income during the forecast period.
| Figure 4 | ||||||
| Summary of Department of Finance's
General Fund Revenue Forecast | ||||||
| (Dollars in Millions) | ||||||
| 1996-97 Estimated | 1997-98 Forecast | |||||
| Revenue Source | Actual 1995-96 | Amount | Percent
Change |
Amount | Percent
Change | |
| Personal Income Tax | $20,875 | $22,660 | 8.6% | $24,240 | 7.0% | |
| Sales and Use Tax | 15,753 | 16,485 | 4.6 | 17,325 | 5.1 | |
| Bank and Corporation Tax | 5,862 | 5,795 | -1.1 | 5,860 | 1.1 | |
| Insurance Tax | 1,132 | 1,124 | -0.7 | 1,196 | 6.4 | |
| Other taxes | 1,203 | 1,162 | -3.4 | 1,160 | -0.2 | |
| Other revenues | 1,211 | 1,112 | -8.2 | 784 | -29.5 | |
| Transfers | 261 | 68 | -- | 93 | -- | |
| Totals | $46,296 | $48,405 | 4.6% | $50,657 | 4.7% | |
Bank and Corporation Tax Reduction Proposal. Last year, legislation was enacted which provides for a 5 percent reduction in the bank and corporation tax rate (from 9.3 percent to 8.84 percent), beginning in 1997. The 1997-98 budget proposes to reduce corporate tax rates by an additional 10 percent over the next two years. The tax rate would decline by 5 percent (to 8.40 percent) for income years beginning in 1998, and another 5 percent (to 7.96 percent) for income years beginning in 1999. In addition, the budget proposes partial conformity to federal provisions for Subchapter S corporations, by expanding the allowable number of shareholders in such corporations from 35 to 75. The budget estimates that the Governor's proposed corporation tax reduction would reduce General Fund tax revenues by $93 million in 1997-98, $336 million in 1998-99, $562 million in 1999-00, and $654 million in 2000-01 (the full-year, ongoing impact). A more detailed analysis of this proposal is provided in Part V of this volume.
Trial Court Funding Proposal. The Governor's budget contains a proposal to consolidate and restructure the trial court program, similar to last year's proposal, which includes the redirection of certain fines and penalties from the General Fund to the Trial Court Trust Fund. This would result in an annual General Fund revenue reduction (and a corresponding expenditure reduction) of $290 million beginning in 1997-98.
| Figure 5 | ||||||||
| Summary of Legislative Analyst's
General Fund Revenue Forecast | ||||||||
| (Dollars in Millions) | ||||||||
| Revenue Source | 1996-97 | 1997-98 | 1998-99 | |||||
| Estimated
Amount |
Percent
Change |
Forecast
Amount |
Percent
Change |
Estimated
Amount |
Percent Change | |||
| Personal Income Tax | $22,950 | 9.9% | $24,650 | 7.4% | $26,200 | 6.3% | ||
| Sales and Use Tax | 16,620 | 5.5 | 17,560 | 5.7 | 18,540 | 5.6 | ||
| Bank and Corporation Tax | 5,450 | -7.0 | 5,470 | 0.4 | 5,480 | 0.2 | ||
| Insurance Tax | 1,120 | -1.1 | 1,180 | 5.4 | 1,245 | 5.5 | ||
| Other taxes | 1,159 | -3.7 | 1,160 |
-- |
1,172 | 1.0 | ||
| Other revenues | 1,115 | -7.9 | 810 | -27.4 | 830 | 2.5 | ||
| Transfers | 68 |
-- |
93 |
-- |
96 |
-- | ||
| Totals | $48,482 | 4.7% | $50,923 | 5.0% | $53,562 | 5.2% | ||
Forecast for 1996-97. We forecast that General Fund revenues and transfers will total $48.5 billion in 1996-97, a 4.7 percent increase from the prior year. As shown in Figure 5, we expect the fastest growing revenue source to be the personal income tax, which we project to increase by 9.9 percent from 1995-96. We expect sales and use taxes to increase more moderately, while bank and corporation tax receipts are projected to experience an actual decline from the prior year.
Forecasts for 1997-98 and 1998-99. We project that revenues will continue to grow in line with the increases in the California economy forecast for the next two years, with revenues reaching $50.9 billion in 1997-98 (5.0 percent growth) and $53.6 billion in 1998-99 (5.2 percent growth). As in the current year, personal income taxes are expected to experience the largest gains, followed by increases in sales and use taxes. Bank and corporation tax receipts are forecast to remain flat through the end of the forecast period, due to the recently enacted and proposed bank and corporation tax cuts.
One Implication--Increased Uncertainty. As discussed in more detail below, the precise causes of these developments are unknown at this time, and we will not have a clear picture of their full implications for the state's revenue outlook until final tax payments for both corporations and personal income taxpayers are remitted this spring. For example, we do not know at this time whether the strong PIT receipts will be offset, in whole or part, by lower-than-expected final tax payments or higher-than-expected refunds. These divergent trends have contributed an additional element of uncertainty to the revenue outlook.
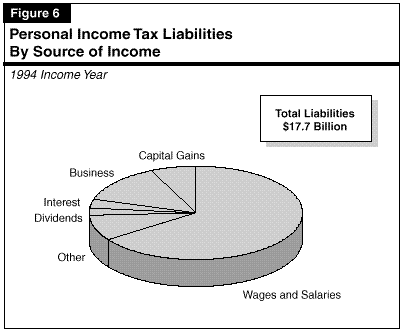
Importance of Different Types of Income. Figure 6 shows that wages and salaries are responsible for the largest single component of PIT liabilities, accounting for about two-thirds of the total. The source of the next largest single component is business income, which includes income from partnerships and sole proprietors. The remaining four major income components--capital gains, interest, dividends, and all other income sources--together account for one-fifth of total state PIT liabilities.
Recent Liability Growth. In 1994, PIT liabilities expanded by a moderate 4.8 percent and then jumped by over 13 percent in 1995. This especially strong 1995 growth appears to have been due to a variety of factors, including well-above-average growth in capital gains (25 percent). Strong 1995 growth also occurred in investment and business-related income, and in wages and salaries of high-income individuals. Due to the high marginal income tax rates that generally apply to these income components, they gave an extra "upward kick" to 1995 liability growth.
With regard to 1996, we estimate that PIT liabilities again experienced strong growth--9.4 percent. This is despite the fact that nearly $0.8 billion essentially "disappeared" from the 1996 liability amount, due to the expiration at the end of 1995 of the temporary 10 percent and 11 percent marginal income tax brackets put in place in 1991. In the absence of this factor, 1996 liability growth would have been even stronger and on a par with 1995--over 13 percent. Our estimates of strong liability growth in 1996 partly reflects recent healthy increases in withholding and quarterly estimated tax payments, which suggest that 1996 was another good year for wages, business earnings, and investment income.
Moderate Liability Growth Forecast for 1997 Through 1999. We project continued growth in PIT liabilities for 1997 (7.7 percent), 1998 (7.1 percent), and 1999 (6.9 percent). This moderate though somewhat slowing growth reflects our projected path for California's economy--continued though somewhat tapering growth.
Our projected growth in PIT liabilities somewhat exceeds our projected growth in California personal income, primarily because of the state's progressive income tax structure. Figure 7 summarizes our growth assumptions for the components of taxable income, from which our forecasts for tax liabilities are derived.
| Figure 7 | |||||
| California Taxable Income Components
1995 Through 1999 | |||||
| Percent Growth | |||||
| Taxable
Income Component |
1995 | 1996 | 1997 | 1998 | 1999 |
| Wages | 5.4% | 7.1% | 6.5% | 5.3% | 5.3% |
| Dividends | 12.1 | 10.7 | 9.5 | 8.7 | 6.8 |
| Interest | 13.6 | 4.7 | 7.4 | 5.5 | 4.6 |
| Business income | 7.7 | 8.9 | 5.5 | 4.9 | 5.5 |
| Capital gains | 25.0 | 17.0 | 6.3 | 5.6 | 5.5 |
| Other | 6.6 | 7.3 | 6.3 | 5.6 | 5.5 |
| Totals, taxable income | 6.3% | 7.4% | 6.5% | 5.4% | 5.4% |
Key Assumption About January's Cash Gain. As noted earlier, PIT-related cash collections in January 1997 exceeded the budget's estimate for the month by roughly $300 million. This money primarily relates to payments toward 1996 PIT liabilities. Our liability and revenue forecasts assume that this is a "real" gain as opposed to a temporary "cash-flow" gain, and, thus, that it will not be offset by lower-than-expected final tax payments and higher-than-expected refunds when 1996 tax returns are filed in April.
Our forecast also incorporates the budget assumption of additional PIT revenues of $86 million in 1996-97 and $154 million annually thereafter due to several budget proposals that would increase auditing and improve automation technology at agencies that administer and collect personal income taxes.
The "use" tax is imposed on products bought from out-of-state-firms by California residents for use in the state. Such purchases are difficult to monitor, and the state is prohibited by the federal government from requiring out-of-state mail-order firms to collect the use tax for California. As a result, only a small percentage of total sales and use tax revenues is from this source.
| Figure 8 | |
| Sales and Use Tax Rates in California | |
| Current Rate | |
| State | |
| General Fund | 5.00% |
| 1991 program realignment
(Local Revenue Fund) |
0.50 |
| Local Public Safety Funda | 0.50 |
| Total | (6.00%) |
| Local | |
| Uniform local taxesb | 1.25% |
| Optional local taxes | 1.50c |
| Total | (2.75%) |
| Statewide maximum rate | 8.75% |
| a These revenues are not shown in the Governor's budget totals. | |
| b Levied in all counties. | |
| c Maximum allowable rate, except maximum rate is 1.75 percent in San Francisco County and 2 percent in San Mateo County. | |
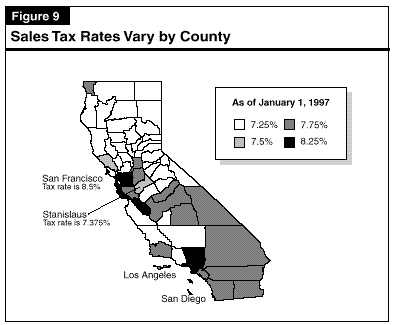
Combined State and Local Tax Rates. The combined state and local tax rates vary significantly across California. As shown in Figure 9, the combined rate currently ranges from 7.25 percent for counties that impose no optional sales taxes, up to 8.5 percent in the City and County of San Francisco. No county currently imposes the maximum allowable 8.75 percent rate.
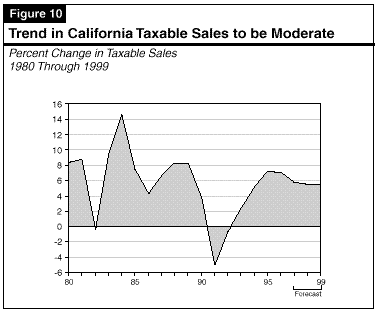
Late 1996 Developments. Taxable sales grew strongly in early 1996, before easing in the third quarter of the year. Reports from retailers suggest that the 1996 Christmas shopping season was somewhat stronger in California than the rest of the nation, and our forecast assumes that taxable spending ended the year on a reasonably strong note. Overall, we estimate that taxable sales totaled $321.7 billion in 1996, a 7 percent increase from 1995. This gain represents the largest increase since 1989.
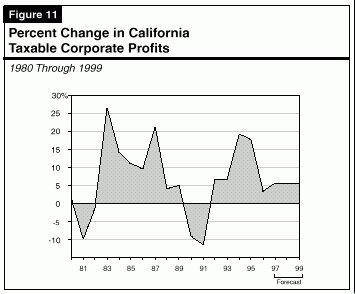
Recent cash payment trends indicate that this acceleration of profits did not occur in 1996. Rather, growth in California taxable profits appears to have slowed sharply. However, we are forecasting that profit growth will partially rebound over the forecast period, accelerating modestly from its 1996 level in the 1997-through-1999 period. This reflects the continued growth in output and sales of California businesses that we expect.
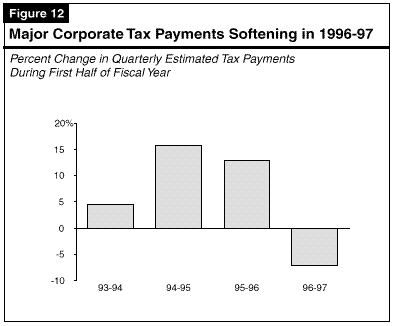
Year-End Trends in Prepayments Are Often an Indicator of Liabilities. In general, corporations tend to file their earliest prepayments based on prior-year tax liabilities, then make upward or downward adjustments in their later prepayments once their full-year profit situation becomes clearer. For example, calendar-year corporations tend to make these adjustments in September and December. Thus, the September and December quarterly payments often provide the first good indication of current profit trends, and are often followed by similar increases or decreases in final payments later on when final tax returns are filed.
Recent Prepayments Have Been Weak. Figure 12 shows the percent change in corporate tax estimated payments for the July-through-December period of each fiscal year from 1993-94 through 1996-97. It shows that these payments increased consistently during the first three years of this period. In 1996-97, however, collections fell by 7 percent, reflecting especially soft payments during September and December 1996.
Implications for Revenues. At this point, it is not possible to identify with certainty the factors responsible for the weakness in prepayments, and thus its revenue implications. The softness does not appear to be occurring nationally, as federal corporation tax receipts in late 1996 were up moderately from the prior year. It also is unlikely that the softness is due to the state corporation tax rate cut enacted in 1996, since the first income year to which this reduction applies is 1997.
The prepayments weakness may be due to special factors, such as unusually large depreciation charges by certain California companies, or larger-than-expected use of the state's investment tax credit and carry-over net operating loss (NOL) deductions. It is also possible that tax-related strategies pursued by businesses are resulting in a shift in the allocation of income from corporate earnings to personal earnings--in the form of large year-end bonuses to employees. If so, this income would be reported on individual personal income tax returns, not corporate tax returns. This latter factor could account not only for some of the corporate payments weakness, but also some of the recent strength in year-end personal income tax payments noted earlier.
We will not know the exact cause(s) of the slowdown in receipts until tax return information is tabulated for 1996. For purposes of our projections, however, we have incorporated what we believe is a reasonable assumption in the absence of any information to the contrary--namely, that the slowdown is "real," and reflective of underlying factors like those discussed in the preceding paragraph. We have accordingly lowered our bank and corporate revenue forecast for 1996-97 and beyond to take account of the recent cash trends.
1997-98 and 1998-99 Revenues. We forecast that corporate tax receipts will grow only marginally in 1997-98 and 1998-99. As shown in Figure 11 above, our projections assume that California profits will grow at an average rate of 5.4 percent annually between 1996 and 1999. However, revenues themselves will grow more slowly because of the impacts of the recently enacted 5 percent tax cut (which lowers revenues by $230 million in 1997-98 and $290 million in 1998-99), as well as the Governor's proposed additional tax reduction (which would reduce collections by an additional $93 million in 1997-98 and $336 million in 1998-99).
We forecast that these other sources will decline from $3.5 billion in 1996-97 to $3.2 billion in 1997-98, and then increase to $3.3 billion in 1998-99. The decline between the current year and the budget year is due to the Governor's proposed redirection of trial court revenues from the General Fund to the Trial Court Trust Fund. Excluding the effects of this proposal, the underlying trend for the nonmajor revenue sources is modest growth between 1996-97 and 1998-99, reflecting increases in insurance and estate taxes, and decreases in cigarette, alcoholic beverage, and horse racing taxes.
Income Taxes. We estimate that PIT revenues will exceed the budget forecast by $290 million in 1996-97 and by $410 million in 1997-98, for a two-year difference of $700 million. Part of the difference is related to the strong PIT performance in January, when quarterly estimated payments exceeded the budget forecast by $300 million.
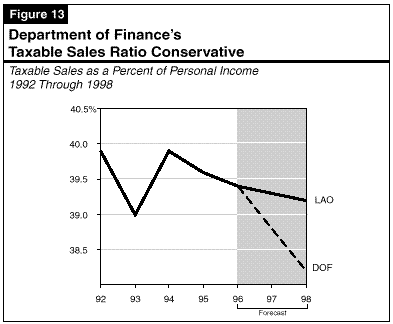
Sales and Use Taxes. We forecast that sales and use tax receipts will exceed the administration's forecast by $135 million in the current year and $235 million in 1997-98, for a two year total of $370 million. As was the case last year, our higher estimate reflects our view that the share of personal income devoted to spending on taxable items will remain stable over the next two years, whereas the administration assumes that the ratio will fall during this period (see Figure 13).
Bank and Corporation Taxes. In contrast to our higher estimates for personal income and sales taxes, our forecast for bank and corporation taxes is down from the administration's--by $345 million in the current year and $390 million in the budget year, or $735 million for the two years combined. As indicated above, our lower estimate is related to our assessment of recent cash trends, which suggests that bank and corporation taxes are coming in well below the administration's projections.
It is also important to note that both the LAO and the budget revenue estimates are predicated on the assumption of continued, though tapering, economic growth. Unexpected weakening or strengthening of the economy could easily translate into revenue adjustments far greater than the current differences between the LAO and administration estimates.
The budget projects that special funds revenues will grow from $14.6 billion in 1995-96 to $15.2 billion in 1996-97 and to $15.8 billion in 1997-98. The modest 4.3 percent budget-year growth rate reflects three main factors:
| Figure 14 | ||||
| Special Funds Revenues and Transfers | ||||
| (Dollars in Millions) | ||||
| 1997-98 Forecast | ||||
| Revenue Source | Actual
1995-96 |
Estimated
1996-97 |
Amount | Percent
Change |
| Motor Vehicle Revenues | ||||
| License fees (in lieu) | $3,339 | $3,525 | $3,713 | 5.3% |
| Fuel taxes | 2,774 | 2,878 | 2,946 | 2.4 |
| Registration, weight,
and miscellaneous fees |
1,616 | 1,637 | 1,716 | 4.8 |
| Subtotals | ($7,729) | ($8,040) | ($8,375) | 4.2% |
| Other Sources | ||||
| Sales and use taxesa | $3,374 | $3,521 | $3,731 | 6.0% |
| Cigarette and tobacco taxes | 496 | 488 | 487 | -0.2 |
| Interest on investments | 112 | 116 | 110 | -5.2 |
| Other revenues | 2,991 | 3,026 | 3,130 | 3.4 |
| Transfers and loans | -127 | 7 | 12 | -- |
| Totals | $14,575 | $15,198 | $15,845 | 4.3% |
| a Includes Local Public Safety Fund revenues. These amounts are not included in the Governor's budget presentation. | ||||
Special Funds Revenues Could Exceed the Budget Forecast. As with the General Fund revenue outlook, we believe that there is some upside potential to the administration's revenue forecast for special funds. Specifically, assuming that the economy continues to grow as we expect during the next two years, we believe that special funds revenues relating to sales and use taxes could exceed the budget forecast by approximately $75 million during 1996-97 and 1997-98 combined.
Definitional Issues. Given this general definition, TEPs have meaning only within the context of what the "basic tax structure" is perceived to be, and this can be a source of considerable controversy. Indeed, disagreement is not uncommon among economists and public policymakers regarding exactly what the basic tax structure is, and thus whether or not individual tax provisions are or are not TEPs. The more all-encompassing your definition of the basic tax structure, the more TEPs you tend to have. Alternatively, the more narrowly the basic tax structure is defined, the fewer TEPs you tend to have. The appropriateness of classifying a specific tax provision as a TEP is most commonly questioned when the provision is broadly available to all taxpayers and benefits most everyone (such as the sales tax exemption on general food products). In contrast, consensus is more common regarding tax provisions that apply to only a limited number of taxpayers in special circumstances (such as certain targeted tax credits).
In recognition of the fact that individual legislators have differing views regarding which tax provisions should be classified as a TEP versus as a part of the state's basic tax structure, the information provided below takes a fairly broad view of what constitutes a TEP. This will enable individual members to have a full array of data regarding potential TEPs available from which they can "pick and choose" in their policy deliberations, based on their own viewpoints regarding how TEPs should be defined.
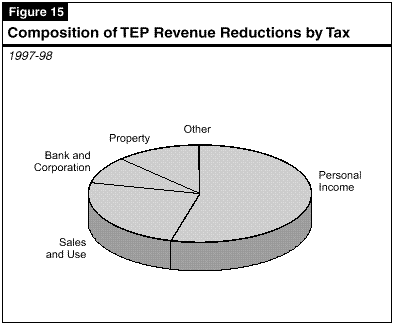
Effects on Revenues. Based upon the most recent data provided to us by the tax agencies, the total revenue cost of TEPs exceeds $30 billion. Figure 15 summarizes the composition of these costs by type of tax. It indicates that personal income tax provisions account for the single largest dollar share of the revenue effects of TEPs--over half. The largest personal income tax TEPs are the exclusion from taxation of employer contributions to pension plans and the home mortgage interest deduction. Sales and use tax TEPs are the next largest category, accounting for about a quarter of total TEP costs. The largest sales and use tax TEPs are the tax exemption for utilities delivered through mains, lines, or pipes, and the exemption for food products. The remaining TEPs--those relating to bank and corporation taxes, other state taxes, and local property taxes--account for the remaining one-fifth of TEP-related state revenue costs.
We will be issuing a detailed compendium of all TEPs later this year.
This report will provide the Legislature with a comprehensive TEP listing
by type of tax, and discussions of the specific tax provisions, rationales,
and revenue effects of each individual program.