Table of Contents
Perspectives on State Expenditures--An Overview of State Expenditures
The 1997-98 Governor's Budget proposes spending a total of $64.6 billion from the General Fund and state special funds in 1997-98, as shown in Figure 1 (see next page). This expenditure level is about $2.6 billion, or 4.2 percent, more than estimated current-year spending of $62 billion.
Proposed General Fund spending is $50.3 billion in 1997-98, or 78 percent of total spending. This is $1.9 billion, or 3.8 percent, above estimated current-year General Fund spending.
Proposed spending for state special funds, as shown in the budget, is $14.3 billion in 1997-98, a growth of $751 million, or 5.5 percent.
Adjustment for Local Public Safety Fund--$1.8 Billion. The budget does not include in its totals for state special funds any expenditures from the Local Public Safety Fund (LPSF). As in past years, we include these amounts in our spending totals. Our rationale is that LPSF revenues are state tax receipts expended for public purposes. This treatment is consistent with how the budget treats other dedicated state funds, such as the Motor Vehicle License Fee Account (which, like the LPSF, is also constitutionally dedicated to local governments) and the Cigarettes and Tobacco Products Surtax Fund (Proposition 99), both of which the budget does include in its spending totals.
As Figure 1 indicates, including this LPSF adjustment adds approximately $1.7 billion to the budget spending totals in 1996-97 and $1.8 billion in 1997-98, raising them to $63.7 billion and $66.4 billion, respectively. We use these adjusted figures in our discussions which follow.
| Figure 1 | ||||
| Governor's Budget
Proposed and Adjusted Spending 1996-97 and 1997-98 | ||||
| (Dollars in Millions) | ||||
| 1996-97 | 1997-98 | Change From 1996-97 | ||
| Amount | Percent | |||
| Budgeted Spending | ||||
| General Fund | $48,443 | $50,301 | $1,858 | 3.8% |
| Special funds | 13,593 | 14,343 | 751 | 5.5 |
| Totals shown in budget | $62,036 | $64,644 | $2,608 | 4.2% |
| Adjustments | ||||
| Add Local Public Safety Fund | $1,678 | $1,769 | $91 | 5.4% |
| Adjusted totals | $63,713 | $66,413 | $2,700 | 4.2% |
| Detail may not add to totals due to rounding. | ||||
General Obligation Bonds. General obligation bonds pledge the full faith and credit of the state and must be approved by voters. Proceeds of general obligation bonds are the major source of financing for state capital outlay and infrastructure programs, other than transportation. The budget proposes appropriating a total of $2 billion from general obligation bond proceeds in 1997-98--about half for transportation-related purposes and roughly one-quarter for construction or renovation of educational facilities. (The actual level of spending for 1997-98 will differ from the amount appropriated because the spending of bond proceeds in any year includes amounts appropriated in both the current year and prior years.) Expenditures of bond proceeds in 1996-97 are an estimated $2.2 billion.
Lease-Payment Bonds. In addition to general obligation bonds, the state also uses lease-payment bonds (supported almost entirely from the General Fund) to finance the construction and renovation of facilities. Lease-payment bonds do not require voter approval. They are backed by annual appropriations for lease payments to the departments using the facilities constructed with the bond proceeds. These monies are, in turn, used to pay the debt-service to the investors who bought the bonds.
For 1997-98, the budget proposes appropriating $343 million in proceeds from lease-payment bonds. Most of this amount is for prison construction and other previously authorized projects of the Department of Corrections.

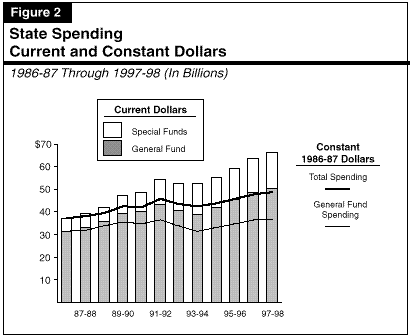
The figure indicates that, since 1986-87, total spending has grown at an average annual rate of 5.4 percent in current dollars and 2.5 percent in constant dollars. Over this same period, the state's population has grown at an average annual rate of 1.9 percent. Consequently, spending measured in terms of constant dollars per capita in both the current year and budget year is slightly higher than it was in 1986-87. (For 1997-98, the budget's constant dollar spending per capita remains unchanged from 1996-97.) However, as Figure 2 shows, the pace of spending growth has varied considerably from year-to-year within this period.
Spending Grew Sharply Through 1991-92. Spending grew relatively rapidly from 1986-87 through 1991-92, when it reached $54.5 billion. Total spending grew at an average annual rate of 8 percent during this period. Even after adjusting for the effects of inflation, annual spending growth averaged 4.3 percent. During this period, dollar spending from special funds grew more than twice as rapidly as General Fund spending (15 percent versus 7 percent annually), which reflected increases in earmarked special funds revenues and the creation of new programs with their own funding sources. Two major contributors to this trend were the approval of Proposition 99 in 1988 (which increased cigarette taxes and earmarked the associated revenues primarily to augment health programs) and Proposition 111 in 1990 (which authorized increases in the gasoline tax and various other transportation-related revenues).
General Fund spending also grew significantly from 1986-87 through 1991-92. In part, this reflected rapid growth in caseloads and costs in health and welfare programs. A strong economy facilitated this spending growth through healthy revenue performance until 1990-91, when the recession caused a drop in General Fund revenues. In response, the Legislature cut spending relative to current-law requirements. However, anticipating that the recession would not be prolonged, the state continued to fund spending growth for most programs through 1991-92. The recession proved far deeper and more prolonged than expected, and a large budget deficit resulted despite the funding actions, and the tax increases and other revenue enhancements.
Spending Fell During the Recession. From 1991-92 through 1993-94, revenues were essentially unchanged, and a portion of those revenues was used to reduce the accumulated budget deficit. As a result, total spending declined at an annual rate of 1.9 percent during this period (or 3.8 percent in real terms). The decline in General Fund spending was greater, averaging 5.2 percent annually (6.9 percent in real terms). However, a variety of cost deferrals and accounting adjustments that occurred over this period exaggerate this decline somewhat. Meanwhile, spending from special funds continued to grow, offsetting a portion of the General Fund decline. This difference in spending growth partly resulted from property tax shifts from localities to schools (see discussion on page 87), and the associated creation of the LPSF (a special fund) in 1993-94 to assist these localities.
Spending Growth Returned With the Recovery. With the resumption of economic growth in California following the recession, spending growth has resumed, although at a slower pace than in the pre-recession period. Between 1993-94 and the current year, total spending will have grown at an annual rate of 6.7 percent (4 percent in real terms), based on the budget's spending estimates. Nevertheless, General Fund spending in the current year remains slightly beneath the level of spending in 1991-92 after removing the effects of inflation.
As noted previously, proposed total spending increases by 4.2 percent during 1997-98; however, because of inflation and population growth, 1997-98 spending per capita in constant dollars will remain unchanged from the current year under the budget proposal. General Fund spending in 1997-98 is slightly above 1991-92 in real terms, but still below in real per capita terms.
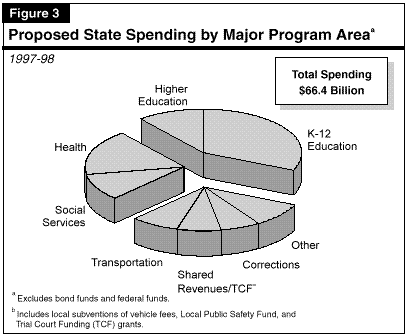
As Figure 3 shows, education receives the largest single share of proposed state spending--a total of 43 percent (32 percent for K-12 education and 11 percent for higher education). Education's share of General Fund spending is considerably greater than its share of total spending--55 percent. Health and social services programs account for another 27 percent of proposed total spending. Thus, on a combined basis, more than two-thirds of proposed total state budget spending is for these three program areas alone. Their combined share is even higher of General Fund spending--over four-fifths.
During the past decade, there have been significant changes in the shares of the budget devoted to different major program areas. Below we briefly discuss these past shifts in order to provide a context for viewing the proposed 1997-98 spending changes.
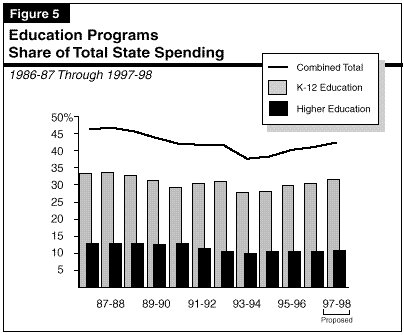
Property Tax Shifts--An Important Factor. Property tax shifts enacted in 1992-93 and 1993-94 contributed significantly to this decline in education's share of total spending. These shifts replaced a portion of the state's education funding with an equivalent amount of local property tax revenues that were shifted from local governments to schools and community colleges. Consequently, the abrupt drop in education's share of the state budget that Figure 5 shows occurred in 1993-94 primarily reflected a restructuring of school funding, instead of a significant reallocation of total resources away from education.
Higher Education Funding Dropped During the Recession. Higher education's share of spending fell from 13 percent in 1986-87 to 10 percent in 1993-94. Much of the decline in General Fund spending was offset by increased student fees.
Education's overall share of the budget stayed more or less constant during the recession (excluding the impact of the property tax shifts). This is because the decline in higher education's share was offset by an increase in the K-12 share of spending, which was driven by rising school enrollments and the funding requirements of Proposition 98.
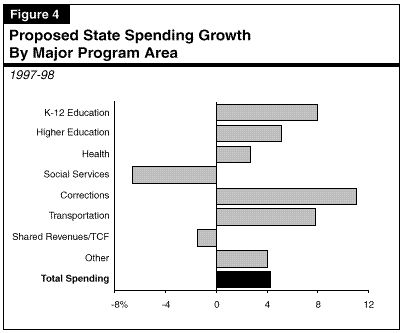
Budget Continues Recent Trend of Increased Funding for Education. Since 1993-94, Figure 5 shows that education's share of the budget has grown and would exceed 42 percent of total spending in 1997-98 under the Governor's budget proposal. As shown in Figure 4, the budget proposes spending increases for K-12 education and higher education of 7.9 percent and 5.2 percent, respectively, in 1997-98. These growth rates both exceed the proposed overall spending increase of 4.2 percent in the budget. The following two factors are primarily responsible for the growth in education's share of total state spending.
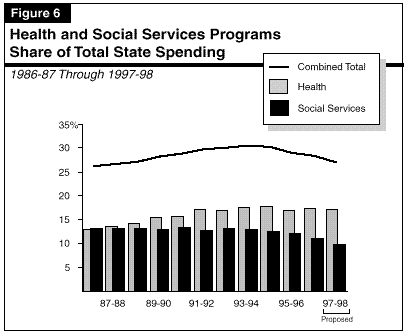
Between 1991-92 and 1996-97, the state adopted a series of reductions in both AFDC and SSI/SSP grants levels. In addition, caseload growth (which had peaked at 11 percent for AFDC in the early 1990s) slowed substantially in the latter part of this period, due in part to the end of the recession and a variety of demographic, social, and policy-related factors. In the current year, AFDC caseloads are declining significantly, although SSI/SSP caseloads continue to experience moderate growth. The combination of grant reductions and slowing caseload growth now has reduced social services' share of the budget from just over 13 percent in 1992-93 to just under 11 percent in the current year.
Under the budget proposal, state spending for social services programs in 1997-98 declines by $460 million, or 7 percent, compared with estimated spending for the current year. Social services' share of total spending would decline to 9.8 percent. The budget proposes to make permanent the temporary statewide welfare grant reductions and cost-of-living-adjustment (COLA) suspensions.
For 1997-98, the budget proposes to eliminate prenatal care for illegal immigrants (pursuant to federal welfare reform legislation). Moreover, the budget assumes that federal funds will be appropriated in the 1997-98 federal budget to offset some of the state costs of providing emergency care to illegal immigrants in the Medi-Cal program, resulting in a savings to the state of $216 million. Proposed state spending for health care programs increases by 2.7 percent ($118 million) in 1997-98, as indicated previously in Figure 4.
Shared Revenues/Trial Court Funding. For 1997-98, the budget proposes a small decline in spending for the shared revenues/trial court funding portion of the budget. Modest growth in shared revenues would be offset by a reduction of $290 million due to the proposed redirection of trial court fines and penalties to a trust fund.
Transportation. Support for transportation, including subventions for local streets and roads, has grown on average slightly faster than overall state spending for all programs during the last decade. Generally speaking, however, its share of total spending has been in the range of 7 to 8 percent. The budget proposes growth in transportation-related spending of 7.9 percent in 1997-98, which would correspond to a 7.4 percent share of total proposed state spending.
Figure 7 lists the major budget proposals which require state legislation or federal action to implement, as well as the timing of the actions assumed by the budget. The figure includes both budget savings actions and proposed spending increases for new programs. The savings and costs shown in Figure 7 represent the amounts estimated in the budget as submitted. They also represent two-year totals in those cases where the budget proposal or assumption affects the current year as well as 1997-98.
| Figure 7 | ||||
| 1997-98 Governor's Budget
Requirements for Legislation or Federal Action | ||||
| (In Millions) | ||||
| Proposal/Assumption | State
Legislation Required? |
Federal
Action Required? |
Assumed
Effective Date |
Budget
Savings |
| Implement Previous Budget Savings Actionsa | ||||
| SSI/SSP | ||||
| Regional 4.9 percent grant reduction | No | Yes | 10/1/97 | $66 |
| Statewide 4.9 percent (October 1997 only) | No | Yes | 10/1/97 | 24 |
| Make Temporary Savings Permanent | ||||
| SSI/SSP | ||||
| Statewide 4.9 percent grant reductionb | Yes | Yes | 11/1/97 | $205 |
| No statewide COLA | Yes | No | 1/1/98 | 7 |
| Continued | ||||
| AFDC/TANF | ||||
| Statewide 4.9 percent grant reduction | Yes | No | 11/1/97 | 160 |
| No COLA | Yes | No | 11/1/97 | 85 |
| Eliminate grant reduction exemptions | Yes | No | 1/1/98 | 48 |
| Eliminate renters' creditc | Yes | No | 1997 | 525 |
| Federal Assumptions | ||||
| Reimbursements for illegal immigrant
incarceration costsd |
No | Yes | -- | $299 |
| Reimbursements for Medi-Cal costs of
illegal immigrants |
No | Yes | 10/1/97 | 216 |
| New Health and Welfare Proposals | ||||
| Reduce payments for drug ingredient costs | Yes | No | 11/1/97 | $10 |
| Impose spending limits for certain laboratory
services and medical equipment and supplies |
Yes | No | 1/1/98 | 9 |
| AFDC/TANF--eliminate $50 child support
disregard |
Yes | No | 1/1/98 | 21 |
| Infant Health and Protection Initiative--
augmentation |
Yes | No | 7/1/97 | -22 |
| CalTAP Welfare Reform Initiative | ||||
| Modify grant structure | Yes | No | 1/1/98 | $156 |
| Paternity establishment requirements | Yes | No | 1/1/98 | 19 |
| County training | Yes | No | 1/1/98 | -79 |
| SAWS reprogramming | Yes | No | 1/1/98 | -13 |
| Employment services (GAIN) augmentation | Yes | No | 1/1/98 | -80 |
| Shifts to Special Funds | ||||
| GAIN--continue use of ETP funds | Yes | No | 7/1/97 | $20 |
| Revenue/Fee Proposals | ||||
| Increase court fees to support trial courts | Yes | No | 7/1/97 | -$88 |
| Motor Vehicle Account--unspecified fee increases | Yes | No | 7/1/97 | 50 |
| Governor's tax reduction program (net of
Proposition 98 offset)c |
Yes | No | -- | -35 |
| Offset delinquent state taxes against
federal refundse |
No | Yes | 1997 | 85 |
| a Part of current law. | ||||
| b $16 million does not require federal action. | ||||
| c Assumes enactment in time to affect 1997 tax liabilities. | ||||
| d Assumes $63 million from an existing federal appropriation and $236 million from future federal funds. | ||||
| e Assumes enactment in time to provide 1997-98 revenue accrual. | ||||