![]()
General Fund revenues are allocated each year through the budget process and support a wide variety of state expenditure programs, including education, criminal justice, and health and social services. Revenues deposited into special funds are earmarked for specific purposes, such as transportation, and targeted health and welfare programs. Some taxes, such as the sales tax, are allocated among both the General Fund and a variety of special funds.
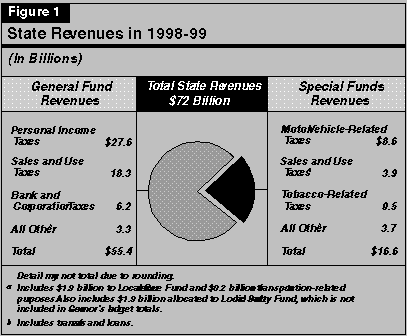
Figure 1 (see next page) shows that slightly over three-fourths of total state revenue collections are deposited into the General Fund, while the remaining one-fourth are received by special funds.
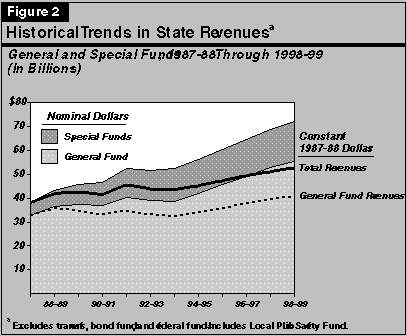
The figure also indicates that the rate of revenue growth has fluctuated significantly during this ten-year period, reflecting both tax law changes and the impact of the states economy on tax receipts. After growing strongly in the late 1980s, revenues remained relatively flat during the early 1990s' recessionary period. Revenues resumed an upward path from 1994-95 through 1996-97, roughly in line with Californias expanding economy. We expect that revenues will grow at a healthy pace in the current year, before moderating somewhat in 1998-99.
General Fund Versus Special Funds Revenue Growth. Despite large dollar increases in General Fund receipts during the past two years, the annual rate of growth over the entire past decade has been higher for special funds (11 percent) than for the General Fund (5 percent). This is largely a result of tax law changes affecting the special funds. The voter approval of gasoline tax increases in 1990, the creation of the one-half cent Local Revenue Fund sales tax in 1991, and voter approval of a one-half cent sales and use tax for local public safety in 1993, have significantly added to the special funds revenue totals. In contrast, most of the General Fund tax increases enacted during the early 1990s have since expired, and the state has recently enacted income tax decreases. Thus, the net impact of state tax law changes on General Fund revenues has been modest when the period is viewed in its entirety.
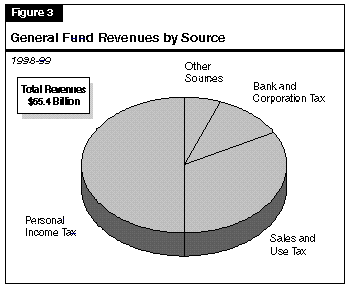
The remaining 7 percent of General Fund receipts is related to numerous smaller taxes, fees, interest earnings, and other sources. These include taxes on insurance premiums, alcoholic beverages, and cigarettes.
General Fund Revenues Closely Mirror States Economic Fortunes. The single largest factor affecting General Fund revenues is the performance of the state's economy. This reflects the fact that changes in wages, employment, consumer spending, and business earnings directly affect state receipts from the personal income, sales and use, and bank and corporation taxes.
As indicated in the figure, the majority of the fiscal impact is attributable to the provision raising
the dependent exemption credit claimed on personal income returns from $68 in 1997 to $120 in
1998 and $222 in 1999. Other significant provisions include those conforming California to
federal tax law in the areas of capital gains on sales of principal residences, Subchapter "S"
corporations, research and development tax credits, and individual retirement accounts. The
measure also reduces the alternative minimum tax by raising its exemption amounts and
indexing them in the future to changes in the California Consumer Price Index.
| Figure 4 | |||
| Revenue Effects of California's
1997 Tax Relief Package | |||
| 1997-98 Through 1999-00
(In Millions) | |||
| Provision | 1997-98 | 1998-99 | 1999-00 |
| Increase in PIT dependent exemption | -$15 | -$295 | -$780 |
| Increase in and indexing of AMT exemption | -44 | -74 | -85 |
| Federal conformity: | |||
| Capital gains/home sales | -25 | -110 | -70 |
| Subchapter "S" corporations | -18 | -21 | -22 |
| Research and development credit | -63 | -58 | -48 |
| Individual retirement accounts | -4 | -14 | -31 |
| Other | -20 | -21 | -50 |
| Totals | -$189 | -$593 | -$1,086 |
Beyond these changes, the Governor' budget contains no new proposed tax law changes. (The only change from current law assumed in the revenue forecast is a $1 million reduction in horse racing revenues relating to legislation that would repeal certain fees collected on out-of-state wagering. The budget also proposes permanent elimination of the renters' tax credit, although we view this not as a tax program per se, but rather akin to an expenditure program which uses the tax structure as a convenient means of disbursing its benefits.)
1997-98 Revenues. The administration's projected healthy revenue increase for the current year is
lead by an 11.6 percent growth in personal income taxes. Sales tax receipts are projected to
increase by 5.9 percent, and bank and corporation taxes are forecast to rise just 0.8 percent. The
small increase in the latter partly reflects the impact of the 5 percent corporate tax rate reduction
passed last year. Collections from the state's smaller revenue sources are affected by a variety of
one-time anomalies and policy changes. For example, the decline in "other revenues" and
transfers reflect agreements reached between the Governor and the Legislature on trial court
funding and other subjects.
| Figure 5 | |||||
| Summary of Department of Finance's
General Fund Revenue Forecast | |||||
| 1996-97 Through 1998-99
(Dollars in Millions) | |||||
| Revenue Source | Actual 1996-97 | 1997-98 Forecast | 1998-99 Forecast | ||
| Amount | Percent Change | Amount | Percent Change | ||
| Personal Income Tax | $23,273 | $25,980 | 11.6% | $27,640 | 6.4% |
| Sales and Use Tax | 16,566 | 17,545 | 5.9 | 18,290 | 4.2 |
| Bank and Corporation Tax | 5,787 | 5,835 | 0.8 | 6,175 | 5.8 |
| Insurance Tax | 1,200 | 1,224 | 2.0 | 1,281 | 4.7 |
| Other taxes | 1,129 | 1,246 | 10.3 | 1,270 | 2.0 |
| Other revenues | 1,194 | 911 | -23.7 | 720 | -21.0 |
| Transfers | 70 | 149 |
-- |
7 |
-- |
| Totals | $49,220 | $52,890 | 7.5% | $55,383 | 4.7% |
1998-99 Revenues. The 4.7 percent increase in revenues projected for the budget year assumes moderate increases in the state's major taxes, along with declines in some of the smaller revenue and transfer categories. The slowdown in personal income tax growth (from 11.6 percent in the current year to 6.4 percent in the budget year) partly reflects the impact of the increase in the dependent credit exemption that will take place in 1998. As in the current year, the decline projected for the "other revenues" and transfers categories partly reflects the impact of the trial court funding agreement reached last year.
| Figure 6 | ||||||
| Summary of LAO's
General Fund Revenue Forecast | ||||||
| 1997-98 Through 1999-00
(Dollars in Millions) | ||||||
| Revenue Source | 1997-98 | 1998-99 | 1999-00 | |||
| Forecast Amount | Percent Change | Forecast Amount | Percent Change | Forecast Amount | Percent Change | |
| Personal income tax | $26,600 | 14.3% | $27,800 | 4.5% | $29,100 | 4.7% |
| Sales and use tax | 17,570 | 6.1 | 18,560 | 5.6 | 19,580 | 5.5 |
| Bank and
corporation tax |
5,850 | 1.1 | 6,120 | 4.6 | 6,300 | 2.9 |
| Insurance tax | 1,220 | 1.7 | 1,280 | 4.9 | 1,330 | 3.9 |
| Other taxes | 1,235 | 9.4 | 1,266 | 2.5 | 1,290 | 1.9 |
| Other revenues | 911 | -23.7 | 710 | -22.1 | 735 | 3.5 |
| Transfers | 149 | -- | 7 | -- | 100 | -- |
| Totals | $53,535 | 8.8% | $55,743 | 4.1% | $58,435 | 4.8% |
1997-98 Revenues. We forecast that General Fund revenues and transfers will reach $53.5 billion in the current year, an 8.8 percent increase from 1996-97. As shown in Figure 6, we project that personal income tax receipts will increase by 14.3 percent in the current year. This reflects the combination of healthy economic growth, an assumed increase in capital gains realizations associated with the rise in the stock market, and reductions in federal tax rates on capital gains. We assume that the sales and use tax will increase 6.1 percent, or slightly less than the rate of growth projected for statewide personal income. Bank and corporation taxes are projected to increase by 1.1 percent, reflecting modest growth in California taxable profits and the impact of the 5 percent tax rate reduction enacted in 1996.
1998-99 Revenues. We forecast that General Fund revenues will increase to $55.7 billion in 1998-99, a 4.1 percent rise from the current year. Growth in personal income taxes is expected to decline sharply in the budget year, reflecting the impact of California's 1997 tax relief agreement and our assumption that tax receipts from capital gains will fall from current-year levels. Other factors holding down the growth rate in forecasted revenues next year include sluggish gains in corporation tax receipts and a decline in "other" revenues related to recently enacted trial court legislation.
1999-00 Revenues. We forecast that General Fund revenues and transfers will be $58.4 billion in 1999-00, a 4.8 percent increase from 1998-99. Our estimates assume continued moderate growth in sales taxes. As in the budget year, growth in personal income tax receipts will be affected by the phasing in of the 1997 tax cuts.
Our forecasts for the individual major General Fund revenue sources are discussed in greater detail below.
Sources of PIT Taxes. As indicated in Figure 7, as of 1995 (the most recent year for which detailed tax return information is available), about two-thirds of total state income tax liabilities was attributable to wages and salaries. The remaining one-third was due to nonwage sources such as business earnings, interest, dividends, and capital gains.
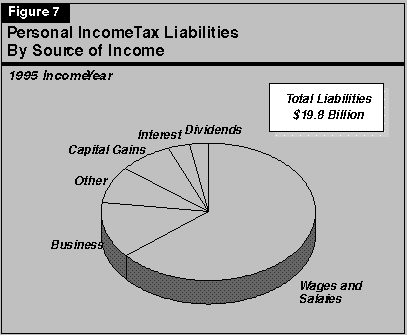
The Special Importance of Nonwage Income Behavior. Although only accounting for one-third of total tax liabilities in 1995, the performance of nonwage earnings can have a disproportionate impact on the change in tax liabilities from year to year. This is partly because (1) nonwage earnings are more volatile than wages and (2) they accrue to higher-income taxpayers, who are subject to higher marginal tax rates (thus, their impacts on revenues tend to be proportionately greater). These factors are particularly true for capital gains, which in the past have risen and fallen by more than 50 percent from one year to the next. For these reasons, the outlook for nonwage income--and in particular, capital gains--is extremely important to the PIT revenue forecast and thus the state's overall revenue picture.
Capital Gains a Major Factor. The especially strong growth in PIT liabilities in recent years has
reflected widespread increases in earnings. As indicated in Figure 9, wages increased at a solid
pace in both 1996 and 1997. However, nonwage income--and particularly, capital gains--soared
during this period. Based on preliminary tax return information, it appears that capital gains
increased by 60 percent in 1996, accounting for more than $1 billion of the growth in overall
state tax liabilities in that year. Based on the continued strength of estimated payments in 1997,
we estimate that capital gains jumped an additional 30 percent last year.
| Figure 9 | |||||
| Growth in California PIT Components
Subject to Taxation | |||||
| 1996 Through 2000 | |||||
| Income Component | 1996 | 1997 | 1998 | 1999 | 2000 |
| Wages | 8.2% | 7.4% | 7.5% | 6.0% | 5.4% |
| Dividends | 15.7 | 12.4 | 6.4 | 6.0 | 5.0 |
| Interest | 9.8 | 8.4 | 4.4 | 2.0 | 2.5 |
| Business income | 14.1 | 7.6 | 6.0 | 5.5 | 5.3 |
| Capital gains | 60.0 | 30.0 | -10.0 | 0.0 | 5.0 |
| Other | 11.8 | 6.9 | 6.0 | 5.8 | 6.0 |
| Totals, Adjusted Gross Income | 11.5% | 8.8% | 5.8% | 5.4% | 5.4% |
These increases in capital gains are partly related to the major rise in stock prices that has occurred over the past two years. This stock price appreciation has contributed to growth in capital gains reported by company shareholders and mutual fund investors. The stock market increases have also contributed to growth in earnings from stock options granted to employees of companies in California. We also believe that some of the 1997 strength in capital gains was related to the "unlocking" of gains that had been held in anticipation of the federal capital gains tax rate reduction, which was enacted last summer.
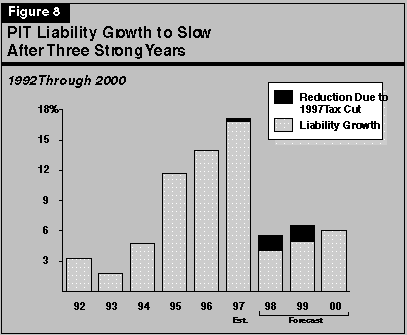
PIT Outlook--Slower Growth. Despite a positive outlook for California's economy generally, we are projecting a slowdown in the growth in PIT liabilities during the next three years. As indicated in Figure 8, we project that PIT liabilities will increase by between 5 percent and 6 percent during the next two years, or slightly more slowly than statewide personal income growth. This is in marked contrast to the past two years, when PIT liabilities grew by more than double the rate of statewide personal income.
Our projected slowdown in PIT receipts reflects two key factors:
Personal Income Tax Revenue Forecast. Based primarily on our forecast for PIT liabilities, we
estimate that fiscal-year PIT revenues will be $26.6 billion in 1997-98, $27.8 billion in 1998-99,
and $29.1 billion in 1999-00.