![]()
The term "sales and use tax" actually refers to two separate levies--the sales tax and the use tax. The sales tax is applied primarily to the retail sales of tangible goods purchased in California. Key components of taxable sales include retail spending by consumers, purchases of motor vehicle fuel, building materials that go into the construction of both residential and nonresidential structures, and business investment in physical plant and equipment (such as computers and other machinery). Services are generally exempt from the sales tax, as are goods purchased for resale. The law also provides specific exemptions from the sales tax , the largest of which is for food.
The use tax is imposed on products purchased from out-of-state sources by California residents for use in the state. Such purchases are difficult to monitor, and the state is prohibited by the federal government from requiring out-of-state mail-order firms to collect the use tax for California. Given the above, the use tax accounts for a relatively small amount of collections each year.
| Figure 10 | |
| Sales and Use Tax Rates in California | |
| Current Rate | |
| State | |
| General Fund | 5.00% |
| 1991 program realignment
(Local Revenue Fund) |
0.50 |
| Local Public Safety Funda | 0.50 |
| Total | (6.00%) |
| Local | |
| Uniform local taxesb | 1.25% |
| Optional local taxes | 1.50c |
| Total | (2.75%) |
| Statewide maximum rate | 8.75% |
| aThese revenues are not shown in the Governor's budget totals. | |
| bLevied in all counties. | |
| cMaximum allowable rate, except maximum rate is 1.75 percent in San Francisco City and County, 2 percent in San Mateo County, and 1 percent in San Diego County. | |
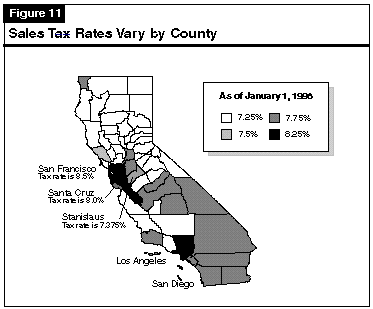
Combined State and Local Tax Rates. As shown in Figure 11, the combined state and local tax rates vary significantly across California--ranging from 7.25 percent in areas that impose no optional sales taxes, up to 8.5 percent in San Francisco County. No county currently imposes the maximum allowable 8.75 percent rate.

Our forecast was prepared before taxable sales for the fourth quarter of calendar-year 1997 were known. However, based on generally positive industry reports for the western region of the United States, it appears that sales during the important Christmas shopping season were up by about 6 percent from the prior year.
Sales and Use Tax Revenue Forecast. Based on our projections for moderate growth in taxable sales, we project that sales tax receipts to the General Fund will be $17.6 billion in 1997-98, $18.6 billion in 1998-99, and $19.6 billion in 1999-00.
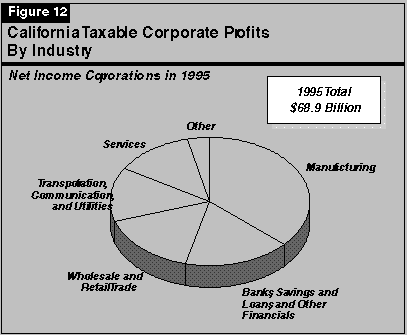
Figure 12 shows the distribution of California's corporate tax base, by industry. It shows that about one-third of total profits are related to manufacturing. The other major shares of total profits are attributable to: financial institutions; wholesale and retail trade; and the combined transportation, communications, and public utilities industry sectors.

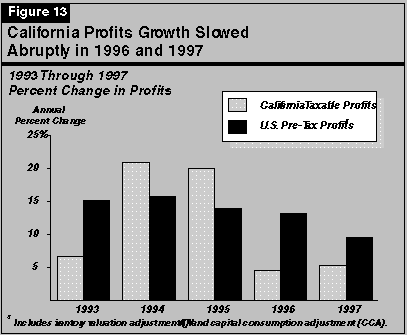
Based on preliminary tax return data for 1996 (the most recent year for which data are available), it is evident that much of the unexpected softness has been due to an abrupt slowdown in California taxable profit growth in 1996, which appears to have carried over into early 1997.
Figure 13 compares growth in California and U.S. pretax earnings from 1993 though 1997 (estimated). It indicates that after lagging the U.S. in the early stages of the current economic expansion, California profits jumped by about 20 percent in both 1994 and 1995, outperforming the nation during those years. In 1996 and 1997, U.S. earnings growth slowed but still registered good growth. In contrast, however, profit growth in California fell abruptly, to just 4.5 percent in 1996 and an estimated 5.2 percent in 1997. The slowdown in California is especially striking in view of the otherwise healthy performance in California's high-technology services and manufacturing industries during this period.

The preliminary tax data for 1996 suggest that part of California's weakness was due to a sharp decline in profits in the transportation, communications, and public utilities industry sector, which fell by nearly one-half during the year. Absent the decline in this industry, overall 1996 profit growth in California would have been much higher--11 percent. Tax-related payments attributable to this industry in 1997 remained soft. The declines appear to be related to restructurings and mergers taking place in the utility and communications industries.
Corporate Tax Revenue Forecast. Based on our assumption of moderate increases in taxable profits, we estimate that bank and corporation tax receipts will be $5.9 billion in the current year, up slightly from 1996-97. We project that revenues from this source will increase to $6.1 billion in 1998-99, and to $6.3 billion in 1999-00. Our estimates include the ongoing impacts of the 5 percent rate reduction enacted in 1996, as well as the expansion of the research and development tax credit and other provisions of the state's 1997 tax relief package.
We forecast that these other sources will be declining from $3.6 billion last year to $3.5 billion in the current year and $3.3 billion in 1998-99, followed by minor growth to $3.5 billion in 1999-00. The declines in the current year and budget year are partly related to the financial restructuring of the trial courts, which resulted in the redirection of penalty and fee revenues from the General Fund to a trial court trust fund. Specifically, General Fund receipts of trial-court-related revenues are estimated to fall from $316 million last year to $158 million in the current year (a half-year effect) and to zero in the budget year and beyond. Other factors contributing to the decline include lower net transfers, the reallocation of tidelands oil revenues to special funds, and continued falling per-capita consumption of cigarettes and alcoholic beverages.
A second factor accounting for the difference is the sales tax. As indicated in Part II of this
volume, our forecast of employment and income growth is generally similar to the
administration's. However, the administration's forecast of taxable sales is significantly more
conservative than our own. We believe that taxable sales will continue to grow at roughly the
same pace as personal income during the next two years, rising by 5.8 percent in 1998 and
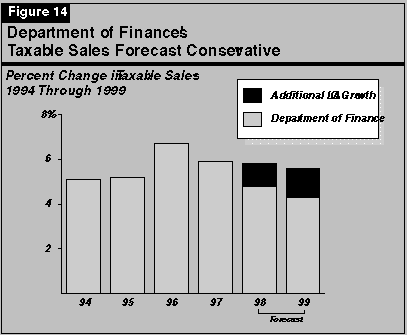
5.6 percent in 1999 (see Figure 14--next page). (As a result, the share of statewide personal
income that is devoted to taxable spending should remain relatively stable.) In contrast,
Figure 14 shows that the administration's forecast assumes that taxable sales growth will taper off
significantly in the next two years, increasing by 4.8 percent in 1998 and just 4.3 percent in 1999.
(This would cause the ratio of taxable sales-to-income to fall significantly.) The differences in
our projections for taxable sales growth translate into $295 million in revenues over the current
and budget years combined.

On the upside, our forecast could prove to be conservative if the economy does not moderate in 1998 and 1999 as we expect, and/or if the 1997 growth in taxable capital gains does not fall off as much as we project from 1996's extraordinary performance.
On the downside, there is a risk that the economy could underperform, due to greater-than-expected adverse impacts associated with Asia's problems or other factors. And, given the difficulty of projecting capital gains in future years, this volatile source could underperform if, for example, the stock market weakens.
As an indication of how sensitive revenues are to these upside and downside risks, each 1 percentage point change in the rate of statewide income growth translates into over $600 million in collections, while each 10 percentage point change in the growth rate of capital gains translates into about $300 million in receipts.
| Figure 15 | ||||
| Special Funds Revenues and Transfers | ||||
| 1996-97 Through 1998-99
(Dollars in Millions) | ||||
| Revenue Source | Actual 1996-97 | Estimated 1997-98 | 1998-99 | |
| Forecast Amount | Percent Change | |||
| Motor Vehicle Revenues | ||||
| License fees (in lieu) | $3,636 | $3,709 | $3,895 | 5.0% |
| Fuel taxes | 2,806 | 2,907 | 2,994 | 3.0 |
| Registration, weight, and
miscellaneous fees |
1,653 | 1,692 | 1,727 | 2.1 |
| Subtotals | ($8,095) | ($8,308) | ($8,616) | 6.4% |
| Other Sources | ||||
| Sales and use taxesa | $3,554 | $3,750 | $3,905 | 4.1% |
| Cigarette and tobacco taxes | 497 | 486 | 479 | -1.4 |
| Interest on investments | 156 | 142 | 157 | 10.6 |
| Other revenues | 2,963 | 3,314 | 3,656 | 5.5 |
| Transfers and loans | 32 | -66 | -73 |
-- |
| Totals | $15,297 | $15,934 | $16,580 | 4.1% |
| aIncludes Local Public Safety Fund revenues. These amounts are not included in the Governor's budget totals. | ||||
The budget projects that special funds revenues will grow from $15.3 billion in 1996-97 to $15.9 billion in 1997-98 and $16.6 billion in 1998-99. The modest 4.1 percent growth between the current year and budget year is largely the result of:
Special Funds Revenues Could Exceed Budget Forecast. We believe that there is some upside
potential to the administration's special funds revenue forecast for sales taxes. Specifically, our
higher estimate for taxable sales during 1998 and 1999 (discussed above) would translate into
increases in special fund sales tax receipts of approximately $55 million during the current and
budget years combined.