![]()
The Governor's Budget proposes spending $72.4 billion from the General Fund and state special funds in 1998-99, as shown in Figure 1 (see next page). Of this total, General Fund spending accounts for about 77 percent. The level of proposed total spending is about $3.2 billion, or 4.7 percent, more than estimated current-year spending. The proposed 1998-99 budgetary amount translates into $2,159 for every man, woman and child in California, or $198 million per day.
The state's General Fund is primarily funded through tax revenues and thus is highly dependent on the state's economic condition. As indicated in Parts Two and Three of this volume, the budget projects that the state's economy will continue to grow at a moderate pace in 1998 and 1999. This, in turn, will generate moderate revenue growth. The General Fund accounts for about $2.4 billion, or 75 percent, of the $3.2 billion increase in total 1998-99 state spending proposed by the Governor.
| Figure 1 | ||||
| Governor's Budget
Proposed and Adjusted Spending |
||||
| 1997-98 and 1998-99
(Dollars in Millions) |
||||
| 1997-98 | 1998-99 | Change From 1997-98 | ||
| Amount | Percent | |||
| Budgeted spending | ||||
| General Fund | $53,022 | $55,416 | $2,394 | 4.5% |
| Special funds | 14,383 | 15,150 | 767 | 5.3 |
| Totals shown in budget | $67,405 | $70,566 | $3,161 | 4.7% |
| Adjustments | ||||
| Add Local Public Safety Fund | $1,776 | $1,859 | $84 | 4.7% |
| Adjusted totals | $69,180 | $72,426 | $3,245 | 4.7% |
| Detail may not total due to rounding. | ||||
The budget proposes special funds expenditures of $15.2 billion in 1998-99, which is an increase of $767 million, or 5.3 percent, over estimated current-year expenditures. Special funds are used to allocate certain tax revenues (such as gasoline and certain cigarette tax receipts) and various other income sources for dedicated purposes. In this way, they differ from General Fund revenues, which are allocated among competing programmatic needs based on the priorities of the Governor and Legislature.
Adjustment for Local Public Safety Fund Expenditures--$1.9 Billion. The budget does not include in its totals for state special funds any expenditures from the Local Public Safety Fund (LPSF). As in previous years, we include these amounts in our spending totals because LPSF revenues are state tax receipts expended for local public purposes. This treatment is consistent with how the budget treats other dedicated state funds, such as the Motor Vehicle License Fee Account (which, like the LPSF, is constitutionally dedicated to local governments) and the Cigarette and Tobacco Products Surtax Fund (Proposition 99). The budget includes spending from both of these funds in its totals. As Figure 1 indicates, including the LPSF adjustment adds roughly $1.8 billion to the budget spending totals in 1997-98 and $1.9 billion in 1998-99. We use this adjustment to special funds spending in all our subsequent discussions that follow.
In addition to the $72.4 billion of proposed spending from the General Fund and state special funds discussed above, the budget also proposes $34.4 billion of spending from federal funds, and another $3.2 billion in bond proceeds used for capital outlay purposes. Including bond funds and federal funds, spending proposed in the budget for 1998-99 totals $110.1 billion--an increase of $4.6 billion from the current year.
The budget proposes to spend a total of $34.4 billion of federal funds in 1998-99. The largest portion of these budgeted federal funds is for federal contributions to health and welfare programs ($22.7 billion), education ($7.9 billion), and transportation ($2.1 billion). These three program areas combined account for 95 percent of total federal funds. There is one state agency whose federal funding is proposed to drop sharply--the Office of Emergency Services (OES). Its spending declines from $446 million in the current year to $273 million in the budget year (a decrease of 39 percent), reflecting a reduction in state claims processed for prior disasters.
Budgetary Treatment. The state makes debt-service payments for principal and interest on general obligation bonds and lease-payment bonds. These payments are included in the budget's spending figures, as are expenditures on capital outlay projects financed through direct appropriations. In contrast, the spending of bond proceeds does not represent a current state cost and, therefore, is not reflected in the General Fund and special funds figures until the associated debt-service costs are incurred.
General Obligation Bonds. The budget estimates that the state will expend $3.2 billion in general obligation bond proceeds in 1998-99. The majority of these bond fund expenditures (about $2 billion) are for the School Facilities Aid Program, to build additional classrooms. Other significant anticipated bond fund expenditures involve facilities for higher education ($460 million) and transportation projects ($536 million).
The budget also proposes $7 billion in new bond authorizations, most of which are general obligation bonds, to support infrastructure spending in several program areas. Before these bond sales associated with this proposal can occur, however, such bonds must be approved by both the Legislature and the state's voters. The budget assumes that about $2.5 billion of the proposed $7 billion in bond authorizations will be appropriated in 1998-99. This amount consists of the aforementioned $2 billion for construction of K-12 education facilities, in addition to $450 million to support the construction of higher education facilities.
Lease-Payment Bonds. In addition to general obligation bonds, the state also uses lease-payment bonds to finance the construction and renovation of facilities. Lease-payment bonds do not require voter approval. Their debt service is paid from annual lease payments by state agencies (funded for the most part through General Fund appropriations) for the facilities they use that have been constructed with the bond proceeds.
The budget proposes $174 million in new authorizations of lease-payment bonds, primarily for the construction of new laboratory facilities. This figure is down sharply from the $343 million that was proposed in the 1997-98 Governor's Budget. Most of that proposed $343 million was for prison construction, which was rejected by the Legislature. In addition, the Governor is also proposing another $1 billion in new authorizations (presumably lease-payment bonds, primarily to build prisons) in separate legislation.
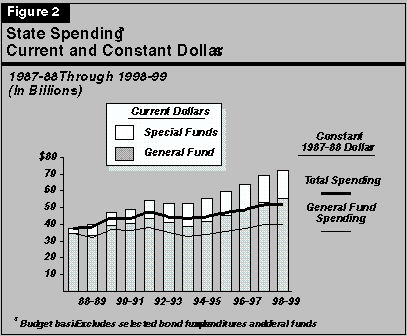
Figure 2 illustrates the trend in state General Fund and special funds expenditures from 1987-88 through 1998-99 (as proposed). The figure presents expenditures in both "current dollars" (amounts as they appear in the budget) and "constant dollars" (that is, "real" dollars--current dollars adjusted to remove the effects of inflation). We have used the Gross Domestic Product (GDP) implicit price deflator for state and local government purchases of goods and services in making these inflation adjustments. This GDP deflator is a good general measure of the price increases faced by state and local governments, and allows comparisons of the "purchasing power" of state resources over time.
Recession Caused Sharp Decline in Spending. As indicated in Figure 2, total spending grew fairly rapidly from 1987-88 through 1991-92--averaging 9.7 percent annually in current dollars and 6 percent after removing the effects of inflation. Then, during the subsequent two years, real General Fund spending fell sharply at a 7.3 percent average rate due to the emergence of severe budgetary problems associated with the recession. Although special funds spending continued to increase during this period, this growth only partially offset the General Fund decline. Indeed, the decline in total spending from 1991-92 through 1993-94 was unprecedented in the post-World War II period, and reflected the severity and longevity of the recession.

It also should be remembered that there were a wide variety of budget-related anomalies occurring during the early 1990s which underlie the spending trends shown in Figure 2 and complicate their interpretation--things such as General Fund Proposition 98 loans, General Fund loans from the state's retirement system, property tax shifts, and temporary tax increases.
Spending Rebounded With Onset of Recovery. Once the economic recovery in California began, General Fund spending growth in both current and constant dollars resumed. Between 1993-94 and 1997-98, total spending grew at an average annual rate of 7.2 percent, or 4.3 percent in real terms. There are two reasons for the increase in real spending between 1993-94 and 1997-98. First, California has experienced an economic expansion, producing healthy revenue growth supportive of expenditure increases. Second, inflation has slowed markedly, increasing the purchasing power of state spending.
Moderate Budget-Year General Fund Spending Growth Proposed. As can be seen from Figure 2, the proposed rates of growth in General Fund and total spending for 1998-99 (4.5 percent and 4.7 percent, respectively) represent a slight moderation from the growth rates experienced during the past five years.
No Growth in Real Per Capita Spending. In addition, when population changes and inflation effects are considered jointly, proposed total state spending for 1998-99 is slightly below the estimate for the current year. Moreover, in spite of the economic recovery and ongoing economic expansion, total real per capita spending proposed in 1998-99 is only slightly above its 1991-92 level. This is also essentially the case for General Fund spending.
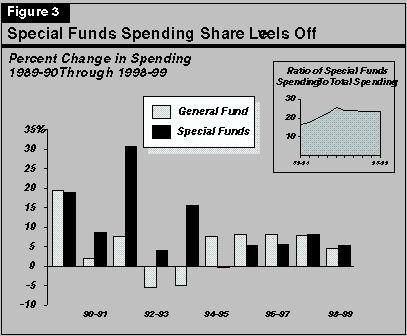
Over the last ten years, the special funds share of total state spending has increased, as shown in Figure 3. This figure also compares annual growth in special funds expenditures with the growth in General Fund spending since 1989-90. Between 1989-90 and 1993-94, the portion of state spending financed by special funds increased from 17 percent to 26 percent. During this interval, the percentage increase in special funds spending exceeded that of General Fund spending (except for the initial year)--and by a significant margin.

Prior to 1991-92, rapid growth in special funds spending reflected increases in revenues earmarked for programs that had not been traditional General Fund responsibilities. Major examples of this include Proposition 99 in 1988 (which imposed additional cigarette and tobacco taxes) and Proposition 111 in 1990 (which increased the gasoline tax and other transportation revenues).
Since 1991-92, however, spikes in the rate of special funds spending growth largely reflect restructuring within the budget, involving shifts of General Fund costs to counties along with shifts of state special funds revenues to counties to offset those costs. Specifically:
As California's economic recovery and subsequent expansion proceeded, the improved state economy produced increasingly healthy General Fund revenue performance. Consequently, the change in General Fund spending annually exceeded that from special funds over the three-year period 1994-95 through 1996-97. This caused the special funds share of total state spending to decline slightly from 26 percent in 1993-94 to 23 percent in the current year. Based on the budget's revenue projections, the rate of increase in special funds spending during the budget year is expected to exceed that of the General Fund, causing their share to rise slightly to 24 percent.
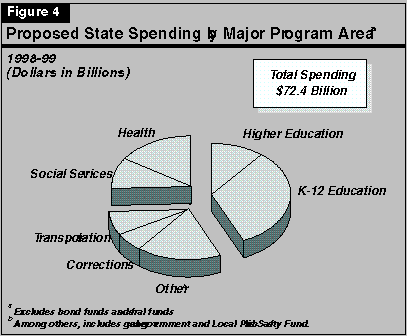
Figure 4 shows the allocation of the proposed $72.4 billion of total state spending in 1998-99 among the state's major program areas. Both General Fund and special funds expenditures are included in order to provide a meaningful comparison among broad program areas, since special funds provide the bulk of the support in some areas (such as transportation). Also, funding shifts between the General Fund and special funds would distort comparisons that did not include all budgeted funds (for example, the aforementioned shift of a portion of health and welfare spending to a special fund for state-local program realignment).
Figure 4 shows that K-12 education receives the largest share of proposed total state spending--nearly one-third. (It should be noted that K-12 education also receives funding from local sources.) When higher education is included, education's total rises to 43 percent. (In terms of just General Fund spending, education's share actually exceeds 50 percent.) Health and social services programs account for 26 percent of proposed total spending, while transportation and corrections together account for another 14 percent. In the "all other" category (17 percent), the largest shares are $2.7 billion of general-purpose assistance provided to local governments in the form of vehicle license fees, and $1.9 billion dedicated to localities from the Local Public Safety Fund.

Return to 1998-99 Perspectives and Issues Table
of Contents
Return to LAO Home Page