![]()
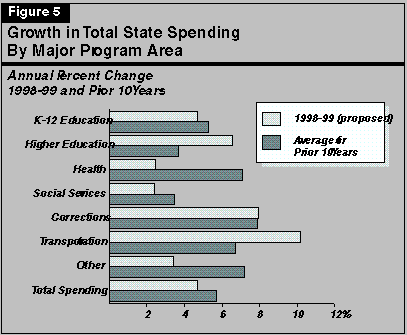
Although the Governor's budget proposes to increase total spending by 4.7 percent in 1998-99, changes for individual program areas vary widely. Figure 5 shows proposed changes in support for major program areas in 1998-99. It also provides an historical perspective by showing the average annual growth over the previous 10 years for major programs.

Proposed 1998-99 Growth. The greatest percentage growth proposed in the budget year is in the areas of transportation (over 10 percent) and corrections (nearly 8 percent). Moderate growth is proposed for education, including 4.7 percent for K-12 education and 6.6 percent for higher education. Health and social services grow relatively slowly--a bit over 2 percent.
Growth Over the Past Decade. Over the past decade, total spending growth has averaged 5.7 percent annually, compared with the 4.7 percent 1998-99 proposed increase. Thus, the proposed budget-year rate of growth is below the average over the past decade. With regard to individual program areas, Figure 5 indicates that corrections and transportation have experienced the highest average rates of growth over the past ten years.
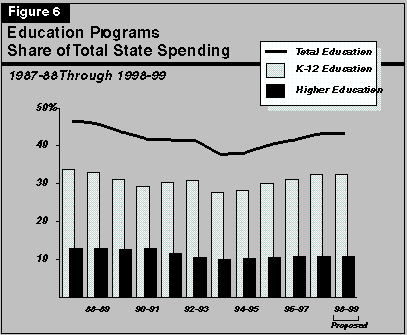
Figure 6 shows education programs' share of the budget since 1987-88. In 1987-88, almost half of total state spending was devoted to either K-12 or higher education programs. By 1993-94, however, education's percentage of total state spending had fallen to 38 percent. Since then, though, education's share has trended back up. Under the Governor's proposal, it would reach 43 percent in 1998-99, a slight rise from the current year.

Factors Involved in the 1993-94 Drop Off. Property tax shifts enacted in 1992-93 and 1993-94 contributed significantly to the decline in education's share of total spending through 1993-94. These shifts replaced a portion of the state's education funding with an equivalent amount of local property tax revenues that were diverted away from local governments to schools and community colleges. Consequently, the abrupt drop in education's share of the state budget from 1992-93 to 1993-94 primarily reflected a restructuring of school funding, instead of a significant reallocation of total resources away from education.
What Was the Recession's Impact? With respect to the early 1990s' recession, its impact on education's share of the budget was mixed. Higher education's share of spending fell from 13 percent in 1987-88 to a low of 10 percent in 1993-94. Much of this decline was offset by increased student fees. However, education's overall share of the budget stayed relatively constant during the recession (excluding the impact of the property tax shifts). This is because the decline in higher education's share was offset by an increase in K-12 spending, which was driven by school enrollments and the funding requirements of Proposition 98.
Proposed K-12 Funding. The budget proposes $23.6 billion in K-12 spending during 1998-99, an increase of about $1.1 billion, or 4.7 percent. This growth rate is less than that of recent years. For example, between 1993-94 and 1997-98, the economic recovery and increases resulting from Proposition 98 contributed to an average annual growth rate of nearly 12 percent. Moreover, the funding formula which produces the Proposition 98 minimum funding guarantee has allowed K-12 education to capture an increasing share of the budget, rising five full percentage points in only five years. This increase allowed the state to undertake new K-12 education initiatives, such as class size reduction. The budget proposes spending new K-12 funds in a variety of ways, such as increasing the school year to 180 days.
Higher Education--The Compact. The 1998-99 budget proposes an increase of $484 million for higher education. It implements the fourth and final year of the funding plan for the University of California (UC) and California State University (CSU). It also provides funding for additional enrollment at UC and CSU, and the "buy-out" of the 5 percent student fee reduction for both systems as required by legislation passed in 1997. The UC budget also includes planning funds for a 10th campus at Merced. With respect to community colleges, the budget includes funding for enrollment growth, as well as investments in technology and infrastructure.
Support for health programs would grow by 2.5 percent in 1998-99 based on the budget proposal. As shown in Figure 5, this compares with an annual growth of 7.1 percent over the past decade--a period that reflected high rates of caseload growth and significant increases in the cost of medical care. In numerical terms, the budget increase for health programs amounts to $277 million. The budget estimates that spending on the state's largest health program, Medi-Cal, will be close to flat--up 0.6 percent from the current year. Increases in costs and utilization of benefits are partially offset by a projected 2.9 percent reduction in caseloads. The moderating growth in Medi-Cal spending is also due to the planned elimination of prenatal care for undocumented women. This action would lower Medi-Cal spending by about $105 million in the current and budget years combined. In addition, the budget reflects the first full year of funding for the new Healthy Families program ($59 million, including related Medi-Cal charges).
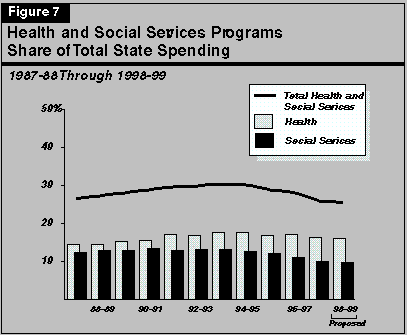
Over the past decade, the health programs share of state spending rose from 14 percent to a peak of almost 18 percent in 1993-94, then stabilized and subsequently has drifted down a bit. The proposed share for 1998-99 is slightly under 16 percent (see Figure 7). Rising welfare-linked caseloads and rapid increases in the cost of providing health care were the main causes of the share's increase prior to 1993-94. The falling off of the share since that time reflects such factors as declining welfare caseloads and a stabilization of other components of the Medi-Cal caseload.

Most state spending in the social services area is for grants to low-income persons in families with children under the CalWORKs program (formerly AFDC/TANF), or who are elderly, blind or disabled under the Supplemental Security Income/State Supplementary Programs (SSI/SSP). Caseloads in these programs grew sharply during the early 1990s in part due to the recession. Consequently, the social services share of total spending grew to over 13 percent in 1992-93, as shown in Figure 7.
Starting in the early 1990s, however, the state began to adopt a series of grant reductions thereby somewhat slowing the growth of welfare spending. That year, AFDC grants were reduced by 4.4 percent and automatic COLAs were suspended. Additional grant reductions in 1992-93 and 1993-94 that also applied to SSI/SSP grants brought the cumulative reduction in grant levels to more than 10 percent for AFDC and about 7 percent for SSI/SSP. Annual caseload growth, which peaked at 11 percent for AFDC in the early part of the decade, slowed substantially, partly in response to the end of the recession and also due to changing demographic factors. In the current year, CalWORKs caseloads are declining significantly, and SSI/SSP caseloads are experiencing a slight growth.
The Budget Proposal. Under the budget proposal, state spending for social services programs in 1998-99 increases by $165 million, or 2.4 percent, compared with estimated spending in the current year. Since 1991-92, social services share of the budget has declined to less than 10 percent. The budget proposal marks the first time since 1993-94 that social services spending would increase in dollar terms. Specifically, the budget proposes $96 million in increased spending for SSI/SSP, although it does not assume increases in state spending on CalWORKs. On the contrary, a large carryover of unexpended federal TANF block grant funds allows state support for CalWORKs to decline by $88 million. The budget proposes to make permanent the temporary statewide CalWORKs grant reductions and COLA suspensions enacted in prior years, for a General Fund cost avoidance of $151 million and $97 million, respectively. Elsewhere, the budget proposes increases for other programs such as In-Home Supportive Services, whose spending totals reflect the loss of $47 million in federal funds. It also should be noted that, despite the Governor's proposed increased spending in the overall social services area, Figure 7 shows that its share of total state spending would decline slightly compared to the current year.
Corrections Spending Continues on Growth Path. Youth and adult corrections will continue to experience robust spending growth under the proposed budget. Over the last decade, corrections support increased at an annual rate of 7.9 percent. The budget proposes an increase of 8.0 percent, almost identical to the historical trend. The high rate of growth of corrections spending is largely driven by the continuing growth in the inmate population--estimated at 6 percent in the budget year.
Transportation Share of Funding Increases. Transportation's share of overall state spending has been relatively stable since the mid 1980s, falling within a range of 7 percent to 8 percent of total spending (this includes state subventions for local streets and roads).
Under the Governor's budget proposal, transportation funding would experience the most rapid growth of any of the major program areas. This would cause transportation's share of total spending to rise by roughly half a percentage point; however, it still would remain below 8 percent. The increased spending primarily reflects capital outlay spending from prior-year appropriations.
Figure 8 lists the major proposals and assumptions in the
1998-99 Governor's Budget which require state
legislation or federal actions to implement, as well as the
timing of the actions assumed by the budget. The fiscal effects
identified in Figure 8 represent the amounts estimated in
the budget as submitted.
| Figure 8 | ||||
| 1998-99
Governor's Budget Requirements for Legislative or Federal Action |
||||
| (Dollars in Millions) | ||||
| Proposal | State Legislation Required? | Federal Action Required? | Assumed Effective Date | Budget Savings |
| Make Temporary Savings Permanent | ||||
| SSI/SSP | ||||
| No statewide COLA | Yes | No | 1/1/99 | $39 |
| CalWORKs/TANF | ||||
| Statewide 4.9 percent grant reduction |
Yes | No | 11/1/98 | 151 |
| No COLA | Yes | No | 11/1/98 | 97 |
| Eliminate renters' credit | Yes | No | 1998 | 540 |
| Federal Assumptions | ||||
| Reimbursement for illegal immigrant incarceration costsa | No | Yes | -- | 286 |
| Revenue Proposals | ||||
| Offset delinquent state taxes against federal refundsb | No | Yes | 1998 | 85 |
| Other | ||||
| Opportunity scholarships in K-12 educationc | Yes | No | 7/1/98 | 39 |
| aAssumes $71 million from an existing federal appropriation and $215 million from future federal funds. | ||||
| bAssumes enactment in time to provide 1998-99 revenue accrual. | ||||
| cWould allow students to attend private schools and lower the Proposition 98 guarantee. | ||||
In his 1998 State of the State Address, the Governor expressed a desire to adjust the state appropriations limit (SAL) so as to make it more of a constraint on state spending. (Apparently, his changes would not affect local limits). Thus far, however, the administration has not released a specific proposal. As estimated in the budget, the limit is projected to exceed proposed appropriations by nearly $8 billion in 1998-99. This section explains what the appropriations limit is, how it is calculated, and its past and current budget-related implications.
Article XIIIB was added to the State Constitution when the voters approved Proposition 4 on the November 1979 special election ballot. In short, Article XIIIB does three things:
Thus, Article XIIIB seeks to constrain the spending of California's governmental entities by establishing a limit on the level of tax-supported appropriations that can be made in each fiscal year. The measure designated the 1978-79 fiscal year as the "base year" for purposes of computing the initial appropriations limit. The initial appropriations limit in 1978-79 was set equal to the amount of "appropriations subject to limitation" for that year. As originally drafted, the figure for appropriations subject to limitation was essentially the amount of appropriations financed by the proceeds of taxes, less:
Transfers of Financial Responsibility. The appropriations limits for beyond the base year are calculated by adjusting the base-year limit for cost-of-living and population changes, and for "transfers of financial responsibility." These transfers occur when one level of government assumes the burden of financing a service from another level of government, or when the source of program financing is shifted from tax proceeds to fees or other nontax proceeds. The appropriations limit of each entity which is a party to a service transfer must be adjusted by a corresponding amount, so that in the aggregate, the total amount of their appropriations limits is no larger after the transfer than it was before. Thus, adjustments must be made to the limit when such a transfer results in an increase or decrease in costs to the state.
Proceeds of Taxes. As noted above, the limit applies only to appropriations financed from "the proceeds of taxes" (such as revenues from property, sales, personal income and corporation taxes). Article XIIIB defines the term "proceeds of taxes" to include:
Appropriations financed by other sources of revenue, such as tidelands oil and gas revenues, federal funds, and bond funds are not subject to the appropriations limit. Nor does the appropriations limit for the state apply to certain specific categories of appropriations, even though these appropriations are financed by tax proceeds. These exempt categories include:
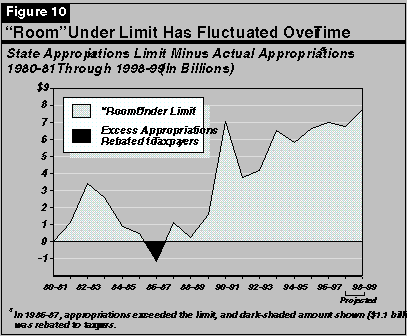
Limit Not a Constraint in Early Years. Figure 9
(see next page) shows the state's appropriations limit, and
amount of appropriations subject to limitation, for each year
since the limit became effective in 1980-81. It also shows the
amount of unused appropriations (that is, "room" under
the limit) for the same period. (Figure 10, see page 89,
shows this graphically.) As the data indicate, the
"room" between the limit and the amount of
appropriations subject to limitation increased significantly
during the first three years the limit was in effect. These
increases, in part, reflected the economic conditions of the
time--the recession of the early 1980s restrained the growth of
state revenues. Because tax revenues grew slowly, the state
lacked the funds to support appropriations that could fully
realize the room below the limit. Moreover, these three years
were a period of high inflation. Partly because the limit is
adjusted for the increase in inflation, it grew by almost
21 percent between 1980-81 and 1982-83.
| Figure 9 | |||||||
| State Appropriations and the SAL Over Time | |||||||
| 1980-81 Through
1998-99 (Dollars in Billions) |
|||||||
| Appropriations Limit (SAL) | Appropriations Subject to Limit | "Room" Under Limit a | |||||
| Level | Percent Change | Level | Percent Change | ||||
| 1980-81 | $16.2 | -- | $15.5 | -- | -- | ||
| 1981-82 | 18.0 | 11.0% | 16.9 | 8.6% | $1.2 | ||
| 1982-83 | 19.6 | 8.7 | 16.2 | -4.3 | 3.4 | ||
| 1983-84 | 20.4 | 4.0 | 17.7 | 9.8 | 2.6 | ||
| 1984-85 | 21.7 | 6.7 | 20.8 | 17.4 | 0.9 | ||
| 1985-86 | 23.0 | 5.6 | 22.5 | 7.9 | 0.5 | ||
| 1986-87 | 24.3 | 5.9 | 25.4 | 13.3 | -1.1 | ||
| 1987-88 | 25.2 | 3.7 | 24.0 | -5.6 | 1.2 | ||
| 1988-89 | 27.1 | 7.4 | 26.8 | 11.5 | 0.3 | ||
| 1989-90 | 29.3 | 8.3 | 27.7 | 3.3 | 1.6 | ||
| 1990-91 | 32.2 | 9.7 | 25.1 | -9.5 | 7.1 | ||
| 1991-92 | 34.2 | 6.4 | 30.4 | 21.4 | 3.8 | ||
| 1992-93 | 35.0 | 2.3 | 30.8 | 1.2 | 4.2 | ||
| 1993-94 | 36.6 | 4.5 | 30.1 | -2.5 | 6.5 | ||
| 1994-95 | 37.6 | 2.6 | 31.7 | 5.5 | 5.9 | ||
| 1995-96 | 39.3 | 4.7 | 32.7 | 3.1 | 6.6 | ||
| 1996-97 | 42.0 | 6.9 | 35.0 | 7.0 | 7.0 | ||
| 1997-98 | 44.8 | 6.6 | 38.0 | 8.7 | 6.8 | ||
| 1998-99 | 48.1 | 7.4 | 40.3 | 6.1 | 7.8 | ||
| aDefined as the state appropriations limit (SAL) minus appropriations subject to this limit. | |||||||
Gap Narrowed as Economy Improved. In 1983-84, the gap between the limit and appropriations subject to the limit began to narrow, as the state's economy recovered from the recession and began to generate additional tax revenues. These tax revenues, in turn, were used to expand programs, particularly in the area of education. This is evidenced by the fact that appropriations subject to limitation grew by almost 10 percent in 1983-84. Simultaneously, the rate of growth of inflation and per capita personal income declined sharply, causing the limit to grow by only 4 percent.
In 1984-85, the amount of unused "room" within the limit fell dramatically, as appropriations subject to the limit climbed by more than $3 billion. This increase reflected the dramatic improvement in the condi- tion of the General Fund brought about by a healthy economy. Fiscal year 1984-85 also marked the second straight year that the inflation rate remained below 5 percent, causing the state's limit to grow at a rate less than half the rate of growth in appropriations subject to the limit. Thus, although relatively high rates of inflation and population growth when the limit first went into effect meant that the appropriations limit initially had little real impact on the budget process, this situation quickly reversed itself.
Revenues Exceeded the Limit in 1986-87. As the rate of inflation and population growth slowed in the mid 1980s, the SAL began to have a direct and important impact on the budget. In 1986-87, an unexpected surge in revenues occurred, largely the result of changes in federal tax law. As a result, revenues exceeded the SAL, meaning that not all of these revenues could be appropriated. This led to debate over how to deal with the extra dollars--either return them to the taxpayers or appropriate them for SAL-exempt purposes. A consensus was not arrived at in sufficient time and, with the close of the fiscal year on June 30, the funds reverted to the taxpayers. This resulted in a $1.1 billion tax rebate during the Christmas season of 1987 (checks were mailed directly to taxpayers). Thus, in that year, the SAL played a role in determining spending levels.
Efforts to Amend the Limit's Computation Resulted. The SAL's impact on the budgetary process in 1986-87 prompted efforts to change its methodology. This took several forms. One included directly exempting certain appropriations from it. Specifically, Proposition 99 (passed in November 1988) placed an additional tax on cigarettes of 25 cents per pack. Normally, an additional tax such as this would have counted as revenue subject to the limit. This proposition, however, specified that these additional tax proceeds are not subject to the limit. Moreover, Proposition 98 (passed in November 1988) modified the allocation of any excess SAL revenues. Specifically, it required any excess revenues to be distributed to public schools and community colleges, up to an amount equivalent to 4 percent of the Proposition 98 minimum school funding level. In 1988-89, this 4 percent amount was about $500 million. Any amount in excess of this was to be returned to taxpayers.
Proposition 111. A more comprehensive modification, however, occurred with Proposition 111 (June 1990). Proposition 111 changed the appropriations limit in several ways. First, it provides that tax revenues received in excess of the state appropriations limit in one fiscal year may be carried over to the subsequent fiscal year. The portion of the carryover that cannot be appropriated in the subsequent fiscal year would then be considered "excess revenues." Proposition 111 also stipulates that 50 percent of any such excess revenues must be diverted to Proposition 98-funded programs, with the balance being returned to taxpayers.
Proposition 111 also made two significant changes regarding limit calculations. First, it modified the inflation factor which entered into the formula. Previously, the factor used was the lower of the change in the U.S. Consumer Price Index (CPI) and state per capita personal income. For most of the 1980s (especially in the latter half of the decade), the growth rate of state per capita personal income exceeded that of national inflation. Thus, national inflation drove growth in the limit. Proposition 111 amended Article XIIIB by removing the CPI from consideration altogether. Thus, since 1990-91, the inflation measure used to determine the SAL is state per capita personal income. Given that the 1990s has been a period of low inflation nationally, the effect of this change has been to allow the limit to rise faster than it otherwise would have. Moreover, Proposition 111 calculated how much "limit room" was "lost" due to using the U.S. inflation rate between 1986-87 and 1989-90, and adjusted the 1990-91 limit upward by a commensurate amount. This explains the upward "spike" in limit in that year (refer to Figure 10).

Second, Proposition 111 also reworked exactly which appropriations are subject to limitation and which are not. For instance, Proposition 111 excludes from appropriations subject to limitation the costs of natural disasters and qualified capital outlay projects. It also excludes the spending derived from increases in motor vehicle fuel taxes, sales and use taxes on the increased motor vehicle fuel taxes, and weight fees.
Proposition 111's Effect. The most significant factor responsible for there currently being $8 billion in "room" under the SAL involves Proposition 111. As noted above, it both increased the growth rate of the appropriations limit, as well as inhibited the growth rate of appropriations subject to it. We estimate that, had Proposition 111 not occurred, the limit would have grown at a much slower rate, and the amount of "room under the limit" would be considerably less--$2.3 billion in 1998-99 compared to $7.8 billion under current law.
Economic Factors. The recession that California experienced during the 1990s and the delayed recovery which followed significantly reduced state tax revenues, thereby lowering the amount of money available for appropriations. This, too, expanded the "room" under the SAL.
Legislative Actions. In addition, the Legislature has taken certain actions in recent years, some in response to the recession's effects on revenues, that have contributed to increasing the "room" under the limit. These actions have involved reducing both expenditures and revenues. On the expenditure side, for example, the Legislature has adopted certain grant reductions and COLA suspensions in welfare programs, enacted various reductions in Medi-Cal funding, suspended the renters' credit, and made cuts to state operations. On the revenue side, significant actions have included the adoption of the investment tax credit, the 5 percent corporate tax rate cut, and last year's tax relief package.
The voters added the state appropriations limit to the
Constitution in 1979 and amended it significantly in 1990. It is
one of many factors that the Legislature and the Governor must
take into account when fashioning a state budget or realigning
responsibilities and funding between the state and local
governments.
Return to 1998-99 Perspectives and Issues Table
of Contents
Return to LAO Home Page