![]()
California state government will collect an estimated $77.4 billion in taxes and other revenues in 1999-00. These collections fall into two broad categories--General Fund revenues and special funds revenues. Revenues deposited into the General Fund are allocated through the budget process each year to support a variety of state programs, including K-12 education, higher education, criminal justice, and health and social services. In contrast, special funds revenues are earmarked for specific purposes. For example, motor vehicle fuel taxes support transportation programs, most tobacco taxes support a variety of targeted health programs, and vehicle license fees support local governments. Some taxes, such as the sales and tobacco taxes, are allocated among both the General Fund and special funds. Figure 1 (see next page) shows that slightly over three-fourths of total state revenues in 1999-00 will be received by the General Fund, while slightly less than one-fourth will be received by special funds.
The great majority of General Fund revenues are attributable to three major taxes--the personal income tax (PIT), the sales and use tax, and the bank and corporation tax (BCT). Together, these three sources are expected to account for well over 90 percent of the General Fund revenue total in 1999-00, with the PIT alone accounting for over one-half of the total. The remaining General Fund receipts are related to numerous smaller taxes, fees, and investment earnings. The smaller taxes include the insurance, estate, cigarette, and alcoholic beverage taxes.
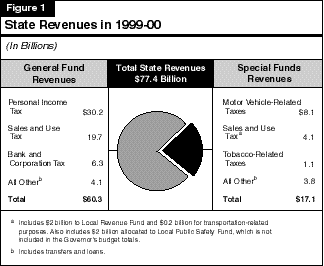
Figure 2 provides a longer term perspective on state revenues, by showing total revenues in both current and constant dollar terms (that is, after eliminating the effects of inflation). It shows that total revenues have increased from $43.3 billion in 1988-89 to $73.3 billion (estimated) in 1998-99, an average annual increase of 5.4 percent. In constant dollar terms, the average annual increase is 2.6 percent. Within this ten-year period, there have been a number of both tax increases (mostly in the early 1990s) and tax decreases (mostly in the late 1990s).
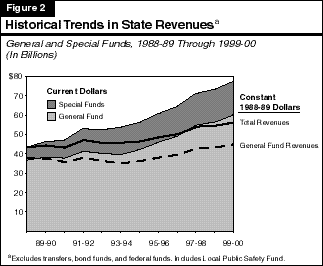
Despite the healthy increases in General Fund revenues in recent years, special funds revenues have increased by more than General Fund revenues during the past decade. The difference is primarily related to legislative and voter-approved changes which have raised various special funds taxes. These include the voter approval of gasoline tax increases in 1990, the creation of the one-half-cent Local Revenue Fund sales tax in 1991, and voter approval of a one-half-cent sales tax for local public safety in 1993.
The figure also shows the effects of the early 1990s' recession and the more recent economic expansion on state revenues. It shows that revenues were flat from 1991-92 through 1993-94, but then resumed an upward trend in 1994-95 as the state's economic recovery took hold. Large revenue increases have occurred in recent years, reflecting the healthy economic expansion and particularly large increases in General Fund personal income tax collections. We expect revenue growth to continue during the current and budget years, albeit at a slower pace than previously, due to recently enacted reductions in state income taxes and the vehicle license fee (VLF).
In both 1997 and 1998, the state enacted significant tax relief legislation. The fiscal impacts of these measures are summarized in Figure 3 (see next page).
The VLF Reduction. Legislation signed into law in 1998 (Chapter 322, Statutes of 1998 [AB 2797, Cardoza]) reduced the VLF by 25 percent beginning on January 1, 1999. This reduction is estimated to lower VLF revenues by $557 million in 1998-99 (half-year effect) and $1,080 million in 1999-00 (full-year effect), and by slowly expanding amounts thereafter. Chapter 322 also specifies that additional VLF reductions could occur beginning in 2000-01 if General Fund revenues exceed the Department of Finance's May 1998 revenue forecast for those years by at least $1.5 billion. Based on our current forecast (discussed below), however, revenues will be well below the amount needed to trigger additional VLF rate cuts in 2000-01. Thus, based on our projections, additional reductions would not occur.
| Figure 3 | |||
| 1997 and 1998 Tax Relief Packages | |||
| (Dollars in Millions) | |||
| 1998-99 | 1999-00 | 2000-01 | |
| 1997 Tax Relief Package | |||
| Increased dependent credit | $295 | $780 | $800 |
| Other changes | 298 | 306 | 263 |
| Totals | $593 | $1,086 | $1,063 |
| 1998 Tax Relief Package | |||
| Revenue Provisions: | |||
| Further increase in dependent credit | $612 | $22 | $23 |
| Renters' credit | 133 | 141 | 144 |
| Targeted tax reductions | 106 | 157 | 172 |
| Totals | $851 | $320 | $339 |
| Expenditure Provisions: | |||
| VLF | $557 | $1,080 | $1,134 |
| Senior citizens | -- | 70 | 71 |
Other Measures. In addition to the VLF reduction, the Governor and Legislature adopted a number of other tax relief measures. These include increases in the personal income tax dependent credit, the restoration of an income-limited renters' credit, various federal income tax conformity items, reduced horse racing fees, and targeted tax relief for senior citizens and businesses. The combined effect of those measures affecting General Fund revenues is $1.4 billion per year beginning in 1998-99.
Figure 4 summarizes the budget's General Fund revenue forecasts for 1998-99 and 1999-00. It shows that revenues are projected to increase from $55 billion in 1997-98 to $56.3 billion in 1998-99 (a 2.4 percent increase), and further to $60.3 billion in 1999-00 (a 7.1 percent increase).
| Figure 4 | |||||
| Summary of Department of Finance's
General Fund Revenue Forecast | |||||
| 1997-98 Through 1999-00
(Dollars in Millions) | |||||
| Revenue Source | Actual 1997-98 | 1998-99 | 1999-00 | ||
| Amount | Percent Change | Amount | Percent Change | ||
| Personal Income Tax | $27,925 | $28,526 | 2.2% | $30,175 | 5.8% |
| Sales and Use Tax | 17,583 | 18,620 | 5.9 | 19,680 | 5.7 |
| Bank and Corporation Tax | 5,837 | 5,926 | 1.5 | 6,295 | 6.2 |
| Insurance Tax | 1,221 | 1,238 | 1.4 | 1,232 | -0.5 |
| Other taxes | 1,293 | 1,307 | 1.1 | 1,301 | -0.5 |
| Other revenuesa | 979 | 793 | -18.9 | 1,482 | 86.9 |
| Transfers | 135 | -117 | -- | 107 | -- |
| Totals | $54,973 | $56,293 | 2.4% | $60,272 | 7.1% |
| a 1999-00 amounts include $562 million in tobacco settlement receipts and $261 million from one-time asset sales. | |||||
The revenue totals for both the current and budget years are affected by the recently enacted tax relief packages discussed above. In addition, while the budget does not include any new tax-related proposals, it does assume new revenues in 1999-00 from (1) the state's receipt of the first two payments related to the tobacco settlement reached late last year ($562 million), (2) the sale of state assets ($261 million), and (3) additional tax assessments from proposed increases in auditing-related activities at the Franchise Tax Board (FTB) and Board of Equalization (BOE).
After adjusting for these and related factors, the budget's projected underlying growth rates are about 5.5 percent in both the current and budget years, or similar to the gains it projects for statewide personal income.
Positive developments relating to the economy, financial markets, and year-end cash receipts suggest that the current revenue trend is significantly above the budget's forecast. As indicated in Part Two of this volume, the economy is currently stronger than anticipated in the budget, and most forecasters are raising their economic projections for this year. In addition, the stock market rally at the end of 1998 will likely raise the amount of capital gains income reported on final 1998 income tax returns filed this spring.
Consistent with these economic and financial developments, recent PIT receipts have been strong. Specifically, as shown in Figure 5, year-end quarterly
PIT prepayments were up again in 1998, by over 13 percent from the prior year. While the rate of increase this year is somewhat less than occurred in
1996 and 1997, it nevertheless has positive implications for the revenue outlook for the balance of 1998-99. This is because much of the year-end
payments are related to capital gains, bonuses, stock options, business earnings, and other volatile sources of income. In recent years, the strength of these
payments has consistently been a very good indication of the strength of final payments that come in during April.
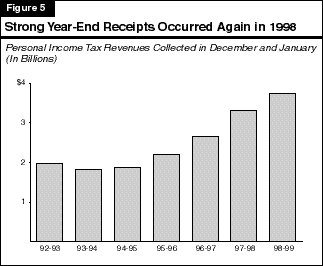
Figure 6 provides the LAO's updated General Fund revenue outlook for 1998-99, 1999-00, and 2000-01. These revenue forecasts are based on our economic forecast presented in Part Two of this volume, and also take into account the recent positive PIT cash revenue trends. Our estimates incorporate the administration's assumptions regarding new revenues in 1999-00, with one primary exception--namely, we have reduced the administration's estimate of revenues from one-time asset sales by $78 million in the budget year, to adjust for the budget's double counting of proceeds from the sales.
Forecast for 1998-99. We forecast that General Fund revenues and transfers will total $57.1 billion in 1998-99, a 3.8 percent increase from the prior year. Our estimate is $758 million above the budget forecast, largely due to our higher estimate of personal income tax receipts. The higher PIT estimate reflects the positive cash trends and economic developments during the past two months.
Forecast for 1999-00. We forecast that General Fund revenues and transfers will increase in the budget year to $60.8 billion, a 6.6 percent increase from the current year. Our forecast is $558 million above the budget projection, reflecting offsetting factors. Specifically, our forecast of PIT revenues is up from the budget forecast by $765 million, reflecting the ongoing effects of the higher current-year revenue trend. Partly offsetting the PIT increase, however, is our estimate that revenues from all other sources will come in $207 million below the budget forecast.
| Figure 6 | ||||||
| Summary of LAO's
General Fund Revenue Forecast | ||||||
| 1998-99 Through 2000-01
(Dollars in Millions) | ||||||
| 1998-99 | 1999-00 | 2000-01 | ||||
| Amount | Percent Change | Amount | Percent Change | Amount | Percent Change | |
| Personal income tax | $29,300 | 4.9% | $30,940 | 5.6% | $32,870 | 6.2% |
| Sales and use tax | 18,630 | 6.0 | 19,625 | 5.3 | 20,705 | 5.5 |
| Bank and corporation tax | 5,880 | 0.7 | 6,195 | 5.4 | 6,525 | 5.3 |
| Insurance tax | 1,240 | 1.6 | 1,250 | 0.8 | 1,280 | 2.4 |
| Other taxes | 1,316 | 1.7 | 1,312 | -0.3 | 1,347 | 2.7 |
| Other revenues | 802 | -18.1 | 1,401 | 74.7 | 1,114 | -20.5 |
| Transfers | -117 | -- | 107 | -- | 100 | -6.5 |
| Totals | $57,051 | 3.8% | $60,830 | 6.6% | $63,941 | 5.1% |
Forecast for 2000-01. We project that total General Fund revenues will increase to $63.9 billion in 2000-01, a 5.1 percent increase from 1999-00. Our estimate for that year is consistent with our forecast for continued moderate economic growth. We also assume that California will receive a single tobacco settlement payment of $442 million (scheduled to be made in 2001) during the 2000-01 fiscal year.
Given that a great majority of General Fund revenues are related to the state's "big three" taxes, the state's fiscal outlook is highly dependent on the performance of these revenue sources. In the following sections we provide a detailed discussion of the outlook for the personal income, sales, and corporation taxes.
The PIT is by far the General Fund's largest revenue source, accounting for about one-half of total receipts in 1998-99. The tax is levied on income that is attributable to California. In general, the tax is patterned after federal income tax law with respect to the definition and treatment of most types of income, deductions, exemptions, exclusions, and credits. Taxable income is subject to marginal tax rates ranging from 1 percent up to 9.3 percent.
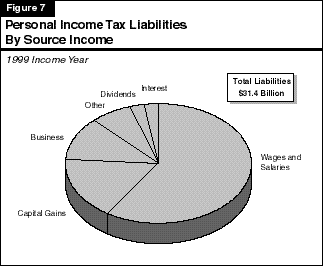
Importance of Different Types of Income. Figure 7 shows that wages and salaries account for the majority of income declared on California PIT returns, representing about 60 percent of the estimated total in 1999. The next largest source is capital gains, which now accounts for about 17 percent of the total. Other significant sources are business income--which includes earnings of partnerships and sole proprietors--interest, and dividends.
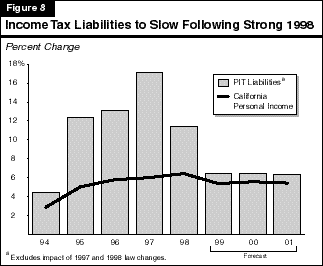
The key factor in the outlook for PIT receipts is the strength in income-year tax liabilities. Figure 8 shows that these liabilities have grown at a very rapid pace in recent years. For example, the average annual increase from 1994 to 1997 (the most recent year for which actual data are available) was nearly 14 percent, or more than double the growth in statewide personal income. Excluding the effects of the scheduled increases in the dependent credit, we estimate that underlying PIT liabilities increased by more than 11 percent in 1998, again a much larger increase than statewide personal income.
