![]()
The Governor's budget proposes spending $78.2 billion from the General Fund and state special funds combined in 1999-00, as shown in Figure 1. Of this total, General Fund spending accounts for about 77 percent and special funds account for 23 percent. The level of proposed total spending is about $3.1 billion, or 4.2 percent, more than the estimated current-year spending of $75.1 billion. Proposed state spending in 1999-00 translates into $2,256 for every man, woman, and child in California.
| Figure 1 | ||||
| Governor's Budget
Proposed and Adjusted Spending | ||||
| 1998-99 and 1999-00
(Dollars in Millions) | ||||
| 1998-99 | 1999-00 | Change From 1998-99 | ||
| Amount | Percent | |||
| Budgeted spending | ||||
| General Fund | $58,271 | $60,475 | $2,204 | 3.8% |
| Special funds | 14,930 | 15,741 | 811 | 5.4 |
| Totals shown in budget | $73,201 | $76,216 | $3,015 | 4.1% |
| Adjustments | ||||
| Add Local Public Safety Fund | $1,862 | $1,968 | $106 | 5.7% |
| Adjusted totals | $75,063 | $78,184 | $3,121 | 4.2% |
| Detail may not total due to rounding. | ||||
The state's General Fund is primarily supported by tax revenues and thus is highly dependent on the state's economic condition. As indicated in Part Two and Part Three of this volume, the budget projects that the state's economy will continue to grow at a moderate pace in 1999 and 2000. This, in turn, will generate a revenue increase of 7.1 percent in the budget year. However, this revenue growth rate reflects a variety of factors, including tax relief enacted in 1997 and 1998, the assumed receipt of tobacco settlement funds, and one-time asset sales. Adjusting for these factors, the budget's 1999-00 underlying revenue growth rate is about 5 percent. These added revenues will permit modest growth in state expenditures. The General Fund accounts for about $2.2 billion, or 71 percent, of the $3.1 billion increase in total 1999-00 state spending proposed by the Governor.
The budget proposes special funds expenditures of $15.7 billion in 1999-00, which is an increase over 1998-99 of $811 million, or 5.4 percent. Special funds are used to hold certain tax revenues (such as gasoline and certain cigarette tax receipts) and various other income sources for dedicated purposes. In this aspect, they differ from General Fund revenues, which are allocated amongst competing programmatic needs based on the priorities of the Governor and Legislature.
Adjustment for Local Public Safety Fund Expenditures$2 Billion. The spending amounts shown in the budget for state special funds do not include spending from the Local Public Safety Fund (LPSF). The LPSF was established by Proposition 172, approved by the voters in November 1993. This measure dedicates a half-cent of the state sales tax to the LPSF for allocation by the Legislature to cities and counties. These public safety allocations, in effect, offset some of the local revenue loss from shifts of property taxes to schools that were enacted in 1992-93 and 1993-94 to reduce the state's school funding obligation.
As in previous years, we include these LPSF amounts in our spending totals. The budget treats the LPSF separately, excluding it from spending totals. Our rationale for inclusion is that LPSF revenues are state tax reAn Overview of State Expenditures ceipts expended for local public purposes. As such, it is not fundamentally different from other dedicated state funds, such as the Motor Vehicle License Fee Account (which, like the LPSF, is constitutionally dedicated to local governments) and the Cigarette and Tobacco Products Surtax Fund (Proposition 99), both of which the budget does include in its spending totals.
As Figure 1 indicates, including the LPSF adjustment adds roughly $1.9 billion to the budget spending totals in 1998-99 and $2 billion in 1999-00. We use this adjustment to special funds spending in all of our subsequent discussions.
In addition to the $78.2 billion of proposed spending from the General Fund and state special funds, the budget also proposes $37 billion of spending from federal funds, and another $1.3 billion in bond proceeds used for capital outlay purposes. When these bond funds and federal funds are included, the budget proposes total spending in 1999-00 of $116.5 billionan increase of $471 million from the current year.
The budget proposes to spend a total of $37 billion of federal funds in 1999-00. The largest portion of these budgeted federal funds are for federal contributions to health and welfare programs ($23.6 billion), education ($8.5 billion), and transportation ($3 billion). These three program areas combined account for 95 percent of total federal funds.
Budgetary Treatment. Debt-service payments for principal and interest on general obligation bonds and lease-payment bonds are included in the budget's spending figures for the appropriate individual programmatic areas, as are expenditures on capital outlay projects financed through direct appropriations. In contrast, the expenditure of bond proceeds is not included in the General Fund and special funds spending figures, but rather is reported in the budget under the heading "selected bond fund expenditures." The spending of bond proceeds themselves is not included because it does not represent a current state cost. (The state incurs costs in later years when it makes debt service payments on the bonds.) Nevertheless, the bond fund expenditures data do give a good indication of the current activity levels involving capital outlay projects.
General Obligation Bonds. The budget estimates that the state will expend $1.3 billion in general obligation bond proceeds in 1999-00, down sharply from the current-year estimate of $5.1 billion. The majority of these bond fund expenditures (about $600 million) are for various capital outlay projects for higher education. Another significant area of anticipated bond fund expenditures involves transportation projects ($470 million).
Lease-Payment Bonds. In addition to general obligation bonds, the state also uses lease-payment bonds to finance the construction and renovation of
facilities. Lease-payment bonds do not require voter approval, and their debt-service is paid from annual lease payments by state agencies (funded
primarily through General Fund appropriations) for the
facilities they use that have been constructed with the bond proceeds.
For 1999-00, the budget proposes appropriating $262 million in proceeds from lease-payment bonds$66 million less than in 1998-99. These funds will be used to fund projects in nine departments, including five crime laboratories for the Department of Justice and health-care related buildings at several state prisons.
Figure 2 illustrates the trend in state General Fund and special funds expenditures from 1988-89 to 1999-00 (as proposed). The figure presents expenditures in both "current dollars" (amounts as they appear in the budget) and "constant dollars" (current dollars adjusted to remove the effects of inflation). This inflation adjustment relies upon using the gross domestic product (GDP) implicit price deflator for state and local government purchases of goods and services. This GDP deflator is a good general measure of the price increases faced by the state and local governments, and allows comparisons of the "purchasing power" of state resources over time.
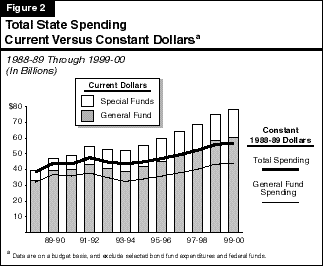
Recession Caused Sharp Decline in Spending. As indicated in Figure 2, total spending grew fairly rapidly from 1988-89 through 1991-92averaging 11 percent annually in current dollars and 7.3 percent after removing the effects of inflation. Then, during the subsequent two years, the emergence of severe budgetary problems associated with the recession caused real General Fund spending to fall sharply at a 7.3 percent average rate. Although special funds spending continued to grow during this period, this growth only partially offset the General Fund decline. Indeed, the decline in total spending from 1991-92 through 1993-94 was unprecedented in the post-World War II period, and reflected the severity and longevity of the recession. An Overview of State Expenditures.
Spending Growth Returned With Economic Recovery. Once the economic recovery began in California, General Fund spending growth in both current and constant dollars resumed, although at a slower pace than during the prerecession period. Between 1993-94 and 1998-99, total spending will have grown at an average annual rate of 7.4 percent, or 5.1 percent in real terms. There are two primary factors behind the increase in "real" spending between 1993-94 and 1998-99. First, California has experienced a strong economic expansion, producing healthy revenue growth. This has allowed not only expenditure increases, but tax relief. Second, inflation has slowed markedly, increasing the purchasing power of state spending.
Modest Budget-Year General Fund Spending Growth Proposed. As shown in Figure 3 (see next page), the proposed rate of growth in General Fund spending for 1999-00 (3.8 percent) represents a significant slowdown from the growth rates experienced during the past five years.
No Growth in Real Per Capita Spending. In addition, when population changes and inflation effects are considered jointly, proposed total state spending for 1999-00 is slightly below the estimate for the current year. Moreover, in spite of the economic recovery and ongoing economic expansion, total real per capita spending in 1999-00 is only slightly above its 1991-92 level.
During the last ten years, special funds have increased their share of total state spending, as shown in Figure 3. This figure also compares annual growth in special funds expenditures with the growth in General Fund spending since 1989-90. Between 1989-90 and 1993-94, the portion of state spending financed by special funds increased from 17 percent to 26 percent. During this interval, the percentage increase in special funds spending exceeded that of General Fund spending (except for the initial year)and by a significant margin.
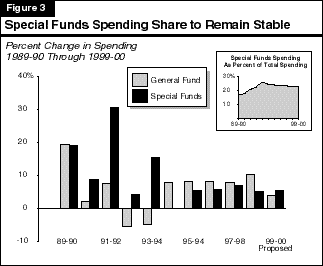
New Special Funds Revenues Earmarked for Programs. Prior to 1991-92, rapid growth in special funds spending reflected increases in revenues earmarked for programs that had not been traditional General Fund responsibilities. Major examples of this include Proposition 99 passed by the voters in 1988 (which imposed additional cigarette and tobacco taxes and used the proceeds for health- and resources-related programs) and Proposition 111 adopted in 1990 (which increased the gasoline tax and other transportation-related revenues).
Budget Restructuring Also Occurred. Since 1991-92, however, spikes in the rate of special funds spending growth largely reflect restructuring within the budget, involving shifts of General Fund costs to counties, along with shifts of state special funds revenues to counties to offset those costs. The realignment of state and county health and welfare responsibilities enacted in 1991-92 placed revenue from a half-cent increase in the state sales tax (traditionally a General Fund revenue source) into a special fund to help counties offset a portion of the costs that were shifted to them. Additionally, counties were provided with additional special funds revenues from increased vehicle license fees (VLFs) to offset the remainder of the costs that were shifted to them. Moreover, as discussed earlier, Proposition 172 (approved in November 1993) imposed an additional half-cent sales tax and dedicated the revenue to the LPSF for allocation to local governments, to partially offset the loss of property tax revenues shifted to schools and community colleges for the purpose of reducing state General Fund spending.
Recent Developments. As California's economic recovery and subsequent expansion have proceeded, the improved state economy has produced increasingly healthy revenue performance. Because General Fund revenue sources tend to be more responsive to the economy than are special funds revenue sources, relatively more funds became available for General Fund purposes. Consequently, General Fund spending growth exceeded that for special funds for every year between 1993-94 and 1998-99, causing special funds' share of total state spending to decline somewhat, from 26 percent in 1993-94 to the 23 percent proposed in the budget year.
The budget-year expenditure growth rates for the General Fund and state special funds reflect two largely offsetting factors. First, special funds spending will increase because of spending associated with an increase in taxes on cigarettes ( Proposition 10, approved in November 1998). Conversely, about $1 billion of spending has been shifted from special funds to the General Fund, a result of the action taken by the Governor and Legislature in 1998 to reduce the VLF by 25 percent and offset the corresponding loss to local government.
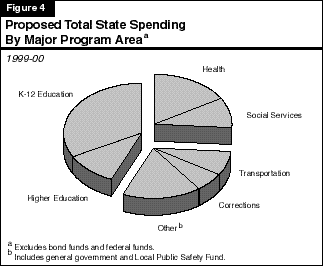
Figure 4 (see next page) shows the allocation of the proposed $78.2 billion of total state spending in 1999-00 among the state's major program areas. Both General Fund and special funds expenditures are included in order to provide a meaningful comparison among broad program areas, since special funds provide the bulk of the support in some areas (such as transportation). Also, funding shifts between the General Fund and special funds would distort comparisons that did not include all budgeted funds (for example, the aforementioned shift of a portion of health and welfare spending to a special fund for state-local program realignment, and the General Fund's VLF offset).
Figure 4 shows that K-12 education receives the largest share of proposed total state spending--nearly one-third. (It should be noted that K-12 education also receives funding from local sources.) When higher education is included, the share for education rises to 44 percent. (In terms of just General Fund spending, education's share actually exceeds 50 percent.) Health and social services programs account for 26 percent of proposed total spending, while transportation and corrections together account for another 14 percent. In the "all other" category (17 percent), the two largest components are $3.3 billion of general purpose assistance provided to local governments in the form of VLFs and $2 billion dedicated to localities from the LPSF.
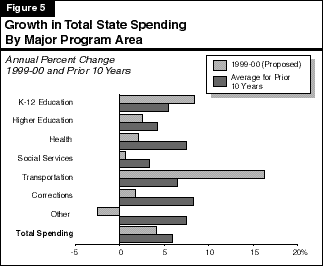
Although the Governor proposes to increase total spending by 4.2 percent in 1999-00, changes for individual program areas vary widely. Figure 5 shows proposed changes in support for major program areas in 1999-00. It also provides a historical perspective by showing the average annual growth over the previous 10 years for major programs.
Proposed 1999-00 Growth. As noted previously, total spending is proposed to increase by 4.2 percent in 1999-00. The greatest percentage growth is proposed in the areas of transportation (over 16 percent) and K-12 education (over 8 percent). The other programmatic areas grow more modestly. For instance, higher education grows 2.6 percent, health and social services grow 2.1 and 0.6 percent, respectively, and corrections grows 1.7 percent. The modest growth rates are due to (1) significant one-time funds appropriated in the current year, and (2) increased reliance on federal funds in the budget year.
Growth Over the Past Decade. Over the past decade, total spending growth has averaged 5.9 percent annually, compared with the 4.2 percent proposed increase for 1999-00. Thus, the proposed budget-year rate of growth is below the average over the past decade. With regard to individual program areas, Figure 5 indicates that corrections and health have experienced the highest average rate of growth over the past ten years. In addition, with respect to the budget year, only transportation and K-12 education will grow at rates exceeding their average for the prior ten years.
Education programs consistently have received the largest share of state spending. However, education's share of total state spending had been declining until 1994-95, as shown in Figure 6. Ten years ago, for example, almost 46 percent of total state spending was devoted to either K-12 or higher education programs. By 1993-94, however, education's percentage of total state spending had fallen to 38 percent. Since then, though, education's share has trended back up.
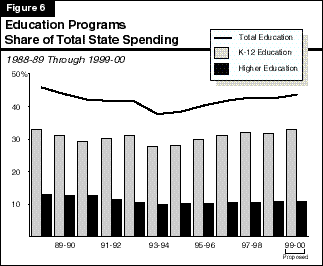
Factors Involved in the 1993-94 Drop Off. Property tax shifts enacted in 1992-93 and 1993-94 contributed significantly to the decline in the state's share of total education spending. These actions replaced a portion of the state's education funding with an equivalent amount of local property tax revenues that were "shifted" from local governments to schools and community colleges. Consequently, the abrupt drop in education's share of the state budget displayed in Figure 6 from 1992-93 to 1993-94 primarily reflects a restructuring of school funding, as opposed to a significant reallocation of total resources away from education.
What Was the Recession's Impact? With respect to the early 1990's recession, its impact on education's share of the budget was mixed. Higher education's share of spending fell from 13 percent in 1988-89 to a low of 10 percent in 1993-94. Much of this decline was offset by increased student fees. However, education's overall share of the budget stayed relatively constant during the recession (excluding the impact of the property shifts). This is because the decline in higher education's share was offset by an increase in K-12 spending, which was driven by school enrollments and the funding requirements of Proposition 98.
Education's Share of Budget Has Risen Sharply in Recent Years. Since 1993-94, Figure 6 shows that education's share of the budget has grown and would approach 44 percent of total spending under the Governor's budget proposal. The increase is largely due to K-12 education, which has experienced a five percentage point increase in its share of the budget in the last five years. The increase has been driven by improvements in the economy, which has in turn boosted the Proposition 98 minimum funding guarantee. In addition, the increase reflects the decision made by the Governor and Legislature last year to over-appropriate the minimum guarantee by what is currently estimated to be about $1 billion. Funding growth in recent years has enabled the state to provide funds for a variety of initiatives, including class size reduction.
Higher education's share of the overall budget has risen slightly over the past five years, reflecting spending increases for University of California (UC), California State University (CSU), and California Community Colleges which have slightly exceeded the overall budget. These recent increases have covered enrollment growth, facility maintenance, program improvements, and student fee reductions.
Budget Proposes Further Education Funding Increases. The budget proposes $25.7 billion in K-12 spending during 1999-00, an 8.4 percent increase over the current year. The increase reflects moderate growth in the Proposition 98 guarantee, as well as increased spending associated with contributions to the teachers' retirement fund. The budget increases include funds for enrollment growth, a cost-of-living adjustment (COLA) and the Governor's READ (Raising Expectations, Achievement, and Development in Schools) initiative.
The 1999-00 budget proposes $8.4 billion in higher education spending in 1999-00, a 2.6 percent increase from the current year. The modest increase is largely due to significant, one-time current-year expenditures for instructional equipment and deferred maintenance in both the UC and CSU budgets.
Support for health programs would grow by 2.1 percent in 1999-00 based on the budget proposal. As shown in Figure 5, this compares with an annual growth of 7.5 percent over the past decade--a period that reflected high rates of caseload growth and significant increases in the cost of medical care. In numerical terms, the budget increase for health programs amounts to $264 million. The budget estimates that spending on the state's largest health programMedi-Cal--will fall slightly, from $7.4 billion in the current year to $7.3 billion in 1999-00. The slight decline in budget-year spending reflects the budget's assumption of savings related to increased federal funds. Most importantly, the administration assumes an increase in the federal medical assistance percentage (FMAP) paid to California. The administration asserts that the U.S. Census Bureau's population estimates for California are too low, and if corrected, would result in increased funding--thereby lowering General Fund costs by $210 million.
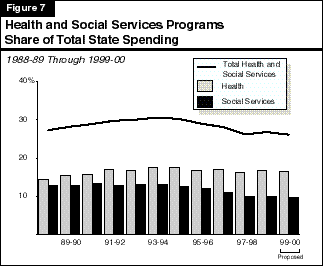
Over the past decade, the share of state spending for health programs rose from 14 percent to a peak of over 17.6 percent in 1994-95, then stabilized and subsequently has drifted down a bit; the proposed share for 1999-00 is slightly over 16 percent (see Figure 7). The share of the budget going to health programs rose primarily because of rising welfare-linked caseloads (due to the automatic qualification of welfare recipients for Medi-Cal) and rapid increases in the cost of medical care. The subsequent decline primarily reflects dropping California Work Opportunity and Responsibility to Kids (CalWORKs) caseloads and a stabilization of other components of the Medi-Cal caseload.
Most state spending in the social services' area is for cash grants to low-income persons in families with children under the CalWORKs program (formerly Aid to Families with Dependant Children [AFDC]), or who are elderly, blind, or disabled under the Supplemental Security Income/State Supplementary Program (SSI/SSP). Caseloads in these programs grew sharply during the early 1990s. Consequently, social services' share of total spending grew to over 13 percent in 1992-93, as shown in Figure 7.
Starting in the early 1990s, however, the state began to adopt a series of grant reductions, thereby contributing to a slowing of the growth of welfare spending. In 1991-92, AFDC grants were reduced by 4.4 percent and automatic COLAs were suspended. Additional grant reductions in 1992-93 and 1993-94 that also applied to SSI/SSP grants brought the cumulative reduction in grant levels to more than 10 percent for AFDC and about 6 percent for SSI/SSP. Caseload growth, which peaked at 11 percent for AFDC in the early part of the decade, slowed substantially, partly in response to the end of the recession and also due to a changing of the state's demographic profile. In the current year, CalWORKs caseloads are declining significantly, and SSI/SSP caseloads are experiencing a slight growth. State costs also have been reduced in the CalWORKs program as a result of federal and state welfare reform.
The Budget Proposal. Under the budget proposal, state spending for social services programs in 1999-00 increases by $44 million, or 0.6 percent, compared with estimated spending in the current year. Specifically, the budget proposes $183 million in increased spending for SSI/SSP. It does not assume increases in state spending on CalWORKs. On the contrary, a large carryover of unexpended federal Temporary Assistance to Needy Families block grant funds allows state support for CalWORKs to decline by $216 million. In contrast to recent years, the budget provides statutory COLAs consistent with current law. Despite the Governor's proposed increases in the overall social services area, Figure 7 shows that its share of total state spending would decline slightly compared to the current year.
Corrections Spending on Modest Growth Path. Although youth and adult corrections will receive additional funding, it will not experience the robust spending growth under the proposed budget that characterized recent years. Over the last decade, corrections support increased at an annual rate of 8.3 percent. The budget proposes an increase of 1.7 percent, well below the historical trend. This reflects slowing growth in projected inmate populations, and the budget's assumed receipt of additional federal funds for undocumented felons.
Transportation Share of Funding Increases. Transportation's share of overall state spending has been relatively stable since the mid 1980s, falling within a range of 7 percent to 8 percent of total spending (this includes state subventions for local streets and roads).
Under the Governor's 1999-00 budget proposal, transportation funding would experience the most rapid growth of any of the major program areas. This would cause transportation's share of total spending to rise by roughly half a percentage point. The increased spending reflects capital outlay spending from prior-year and budget-year appropriations.
Figure 8 lists the major proposals and assumptions in the 1999-00 Governor's Budget which require state legislation or federal actions to implement. The fiscal effects identified in Figure 8 represent the amounts estimated in the budget as submitted.
| Figure 8 | |||
| 1999-00 Governor's Budget
Requirements for Legislative or Federal Action | |||
| (Dollars in Millions) | |||
| State Legislation Required | Federal Action Required | Assumed Budget Savingsa | |
| Federal Assumptions | |||
| Increased reimbursement for illegal immigrant incarceration costs | No | Yes | $100 |
| Increased Medi-Cal sharing ratio | No | Yes | 210 |
| Family planning program waiver | No | Yes | 122 |
| Rescheduling of Expenditures | |||
| Trial courts | Yes | No | $48 |
| Developer fees | Yes | No | 100 |
| Local flood control reimbursements | Yes | No | 44 |
| a Assumed effective in 1999-00. | |||