Health and Social Services
![]() Budget Depends on Risky Federal Assumptions
Budget Depends on Risky Federal Assumptions
![]() Medi-Cal Caseloads Overestimated
Medi-Cal Caseloads Overestimated
![]() CalWORKs County Incentive Payments Should Be Related to Improved Program Performance
CalWORKs County Incentive Payments Should Be Related to Improved Program Performance
![]() CalWORKs Employment Services Overbudgeted
CalWORKs Employment Services Overbudgeted
![]() No General Fund Support for the County Medical Services Program
No General Fund Support for the County Medical Services Program
![]() Need to Control Medi-Cal Mental Health Expenditures
Need to Control Medi-Cal Mental Health Expenditures
Health and Social Services
G eneral Fund expenditures for health and social services programs are proposed to increase by less than 1 percent in the
budget year. This increase is due primarily to a variety of caseload and cost increases and full-year funding of program increases
enacted in the current year, partially offset by savings primarily from welfare caseload reductions and proposals that, if
approved, will result in increased federal Medicaid funds.
The budget proposes General Fund expenditures of $16.4 billion for health and social services programs in 1999-00, which is 27 percent of total proposed General Fund expenditures. The health and social services share of the budget generally has been declining since 1993-94. The budget proposal represents an increase of $74 million, or less than 1 percent, over estimated expenditures in the current year.
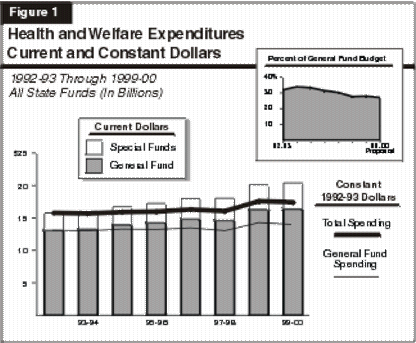
Figure 1 (see next page) shows that General Fund expenditures (current dollars) for health and social services programs are projected to increase by $3.3 billion, or 25 percent, from 1992-93 through 1999-00. This represents an average annual increase of 3.2 percent.
In 1991-92, realignment legislation shifted $2 billion of health and social services program costs from the General Fund to the Local Revenue Fund, which is funded through state sales taxes and vehicle license fees. This shift in funding accounted for a significant increase in special funds starting in 1991-92. Figure 1 shows that General Fund spending has increased since 1992-93, except for a slight reduction in 1997-98 due primarily to a decline in California Work Opportunity and Responsibility to Kids (CalWORKs, formerly Aid to Families with Dependent Children [AFDC]) program caseloads. Spending is estimated to increase in 1998-99, primarily due to welfare grant increases, expansion of the CalWORKs program, Medi-Cal cost increases, and various program enhancements such as the Foster Care initiative.

Combined General Fund and special funds spending is projected to increase by 29 percent from 1992-93 through 1999-00. This represents an average annual increase of 3.7 percent.
Figure 1 also displays the spending for these programs adjusted for inflation (constant dollars). On this basis, General Fund expenditures are estimated to increase by 7 percent from 1992-93 through 1999-00. Combined General Fund and special funds expenditures are estimated to increase by 10 percent during the same period. This is an average annual increase of 1.4 percent.
As noted previously, the 1991 realignment legislation significantly altered the financing of health and social services programs by transferring funding for all or part of several mental health, public health, and social services programs to the counties. The sales tax and vehicle license fee revenues dedicated to realignment amounted to $2 billion in 1991-92, which was $239 million short of the amount that was initially estimated. This shortfall was primarily due to the effects of the recession. The budget estimates that realignment revenues will be $2.8 billion in 1999-00.
Special funds expenditures are estimated to increase in the current and budget years, primarily because of the effect of Proposition 10 which imposes a tax increase on cigarettes and other tobacco products and requires that almost all of the revenues be spent for early childhood development programs. The budget estimates that spending from the new California Children and Families First Trust Fund will amount to $372 million in 1998-99 and $672 million in 1999-00 (excluding monies that are transferred to certain other funds pursuant to the provisions of the proposition). (For a discussion of Proposition 10, please see our report Proposition 10: How Does it Work and What Role Should the Legislature Play in its Implementation?, January 13, 1999.)
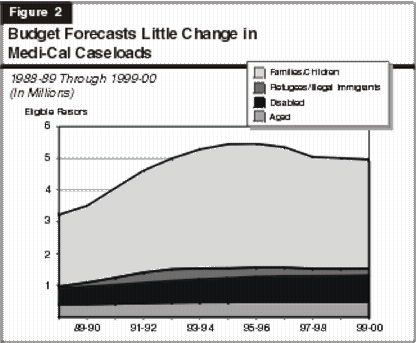
Figures 2 and 3 (see next page) illustrate the caseload trends for the largest health and welfare programs. Figure 2 shows Medi-Cal
caseload trends over the last decade, divided into four groups: families and children (primarily recipients of CalWORKs--formerly AFDC),
the aged and the disabled (primarily recipients of Supplemental Security Income/State Supplementary Program--SSI/SSP), refugees, and
illegal immigrants.
Medi-Cal caseloads increased by 54 percent over the 11-year period shown in Figure 2. As the figure shows, most of this growth occurred during the period from 1989-90 through 1994-95. The growth in the number of families and children receiving Medi-Cal during this period reflects the rapid growth in AFDC caseloads as well as the expansion of Medi-Cal to cover additional women and children with incomes too high to qualify for cash aid in the welfare programs. Coverage of refugees and illegal immigrants also increased caseloads significantly during this period. Since 1994-95, Medi-Cal caseloads have declined, due primarily to a decline in AFDC/CalWORKs caseloads. The figure also shows that the budget forecasts a leveling off of Medi-Cal caseloads in the current and budget years.
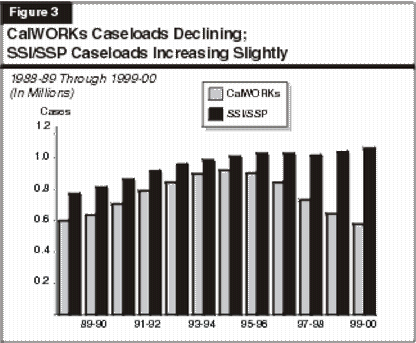
Figure 3 shows the caseload trend for the CalWORKs and SSI/SSP programs. While the number of cases in SSI/SSP is greater than in the CalWORKs program, there are more persons in the CalWORKs program--about 2 million compared to about 1 million for SSI/SSP. (The SSI/SSP cases are reported as individual persons, while CalWORKs cases are primarily families.)

Caseload growth in these two programs is due, in part, to the growth of the eligible target populations. The increase in the rate of growth in the CalWORKs caseloads in 1990-91 and 1991-92 was also due to the effect of the recession. During the next two years, the caseload continued to increase, but at a slower rate of growth. This slowdown, according to the Department of Finance, was due partly to: (1) certain population changes, including lower migration from other states; and (2) a lower rate of increase in "child-only" cases (including citizen children of undocumented and newly legalized persons), which was the fastest growing segment of the caseload until 1993-94.
Figure 3 also shows that since 1994-95, CalWORKs caseloads have declined. As we discuss in our reports, California's Fiscal Outlook (November 1997 and November 1998), we believe that this trend is due largely to various factors affecting welfare caseloads, including the improving economy, lower birth rates for young women, a decline in legal immigration to California, reductions in grant levels, behavioral changes in anticipation of federal and state welfare reform, and--for the current and budget years--the impact of the CalWORKs program interventions (including additional employment services).
The SSI/SSP caseload can be divided into two major components: the aged and the disabled. The aged caseload generally increases in proportion to increases in the eligible population--age 65 or older. This component accounts for about one-third of the total caseload. The larger component--the disabled caseload--has been growing faster than the rate of increase in the eligible population group (primarily ages 18 to 64). This is due to several factors, including (1) the increasing incidence of AIDS-related disabilities, (2) changes in federal policy that liberalized the criteria for establishing a disability, (3) a decline in the rate at which recipients leave the program (perhaps due to increases in life expectancy), and (4) expanded state and federal outreach efforts in the program. We note, however, that in recent years the growth of the disabled caseload has slowed.
Total SSI/SSP caseload growth has also moderated in recent years. This is partly attributable to federal policy changes that (1) eliminated drug or alcohol addiction as a qualifying disability and (2) added restrictions on the eligibility of disabled children.
Figure 4 shows expenditures for the major health and social services programs in 1997-98 and 1998-99, and as proposed for 1999-00. As
shown in the figure, the three major benefit payment programs--Medi-Cal, CalWORKs, and SSI/SSP--account for a large share of total
spending in the health and social services area.
(Dollars in Millions)
Major Budget Changes
Figure 4 Major Health and Welfare Programs Budget Summarya 1997-98 Through 1999-00
Actual
1997-98
Estimated
1998-99
Proposed
1999-00
Change From 1998-99
Amount
Percent
Medi-Cal General Fund
$6,759.1
$7,398.9
$7,329.8
-$69.1
-0.9% All Funds
18,311.8
19,902.4
20,888.5
986.1
5.0 CalWORKs (Grants and Services) General Fund
$2,154.0
$1,999.5
$1,783.2
-$216.3
-10.8% All Fundsb
5,062.4
6,262.5
6,043.8
-218.7
-3.5 AFDC-Foster Care General Fund
$366.6
$425.8
$438.3
$12.5
2.9% All Funds
1,436.4
1,489.5
1,608.3
118.8
8.0 SSI/SSP General Fund
$2,025.4
$2,255.6
$2,439.0
$183.4
8.1% All Funds
5,620.7
6,098.6
6,432.5
333.9
5.5 In-Home Supportive Services General Fund
$370.4
$527.4
$538.8
$11.4
2.2% All Funds
1,195.3
1,405.4
1,482.0
76.6
5.5 Regional Centers/Community Services General Fund
$482.7
$660.5
$776.7
$116.2
17.6% All Fundsc
1,167.9
1,398.4
1,589.5
191.1
13.7 Developmental Centers General Fund
$32.1
$32.5
$33.1
$0.6
1.8% All Fundsc
461.7
480.3
498.1
17.8
3.7 Child Welfare Services General Fund
$451.0
$539.4
$588.0
$48.6
9.0% All Funds
1,198.7
1,371.1
1,431.1
60.0
4.4 State Hospitals General Fund
$276.0
$302.8
$342.6
$39.8
13.1% All Funds
473.7
481.6
505.7
24.1
5.0 Children and Families First Commissionsd General Fund
-
--
--
--
-- All Funds
--
$372.4
$671.5
$299.1
80.3%
a Excludes departmental support, except for state hospitals. b Includes funds for child care reserve and transfers to Child Care Development Block Grant. c Includes General Fund share of Medicaid reimbursements (costs budgeted in Medi-Cal). d Includes state and county commissions.
Figures 5 and 6 (see pages 12 and 13 illustrate the major budget changes proposed for health and social services programs in 1999-00. (We include the federal funds for CalWORKs because, as a block grant, they are essentially interchangeable with state funds within the program.) Most of the major changes can be grouped into the following categories:
1. The Budget Funds Basic Caseload Growth in SSI/SSP and the Healthy Families Program, Reflects Savings From Basic Caseload Reductions in CalWORKs and Medi-Cal, and Funds Other Workload Cost Increases. This includes a projected caseload reduction of 1 percent in the Medi-Cal Program, a decrease of 8.2 percent in the CalWORKs program, an increase of 1.8 percent in SSI/SSP, and an increase of 120 percent in the Healthy Families program (before adjusting for policy changes).
2. The Budget Proposes to Fund Statutory Cost-of-Living Adjustments (COLAs) for CalWORKs and SSI/SSP and the Full-Year Costs of Grant Increases Enacted in the Current Year. This includes a 2.1 percent COLA for CalWORKs and SSI/SSP in 1999-00.
3. The Budget Assumes Federal Approval of Proposals That Would Achieve General Fund Savings by Increasing Federal Medicaid Funds. This amounts to: (1) $210 million to change the Bureau of the Census methodology for counting the state's population, for purposes of calculating the federal matching rate for California; and (2) $122 million for a waiver proposal to make the state-only Family Planning program eligible for federal funds ($60 million of which would be redirected to continue and expand other health programs, including the set-aside discussed below).
4. The Budget Proposes to Keep General Fund Spending for CalWORKs at the Federally-Required Maintenance-of-Effort Level. This would be accomplished primarily by using unexpended federal block grant funds carried over from the current year.
5. The Budget Includes a Set-Aside to Expand Eligibility in the Healthy Families Program and for Other Unspecified Health
Services. This consists of (1) $2.7 million to cover the costs of applying the Medi-Cal income deductions (or "disregards") when
determining family income for Healthy Families applicants and (2) $37.3 million to implement a plan that will be developed by the Secretary
of the state Health and Human Services Agency.
Proposed Major Changes for 1999-00 General Fund Proposed Major Changes for 1999-00 General Fund
Figure 5 Health Services Programs
Medi-Cal
Requested:
$7.3 billion
Decrease:
$69 million
(-0.9%)
+ $297 million due to cost increases and higher utilization of services
- $210 million from a proposed change in the census methodology used in determining the federal
Medicaid match
- $122 million from a proposed federal waiver to make the state-only Family Planning program
eligible for federal Medicaid funds
- $51 million for retroactive recoupment of payments related to Medi-Cal/Medicare "crossover"
claims
Healthy Families
Requested:
$105 million
Increase:
$60 million
(+136%)
+ $60 million for program expansion, due primarily to caseload growth
Public Health
Requested:
$341 million
Decrease:
$43 million
(-11%)
- $20 million by eliminating General Fund support for the County Medical Services Program
Figure 6 Social Services Programs
CalWORKs
Requested:
$1.8 billion
Decrease:
$216 million
(-11%)
+ $101 million (federal Temporary Assistance for Needy Families [TANF] funds) due to termination
of the federal Welfare-to-Work grant
+ $89 million (federal TANF funds) to provide a 2.1 percent cost-of-living adjustment (COLA)
+ $88 million (federal TANF funds) for the full-year costs of current-year grant increases
- $423 million (federal TANF funds) in grants and services due to a reduction in the basic caseload
SSI/SSP
Requested:
$2.4 billion
Increase:
$183 million
(+8.1%)
+ $123 million for full-year cost of current-year grant increases
+ $37 million for basic caseload growth
+ $8 million for 1999-00 COLA (effective January 2000)
Regional Centers
Requested:
$777 million
Increase:
$116 million
(+18%)
+ $113 million for caseload and cost increases
+ $41 million for full-year costs of program increases enacted in current year
Return to 1999-00 Budget Analysis Health and Social Services Table of Contents
Return to 1999-00 Budget Analysis Table of Contents
Return to LAO Home Page