As discussed in "Part One," we are forecasting that General Fund revenues will substantially exceed the Governor's budget forecast by $4.2Ābillion for the current and budget years combined. This dramatic upward adjustment is a continuation of what the state has been experiencing for several years now revenue performance that has repeatedly far surpassed initial expectations, which themselves have been positive from the start.
This part is divided into two basic sections. First, we provide a perspective on the state's recent revenue performance, including the roles of the economic expansion, capital gains, and other factors. Having this perspective is important for understanding our revenue forecast and the logic behind the specific assumptions underlying it. We then discuss our forecast itself, including how it compares to the budget forecast and the outlook for specific individual taxes.
After lagging in the first half of the 1990s, General Fund revenues have soared during the second half of the decade. Since 1994-95, total annual receipts have climbed from $42Ābillion to over $67Ābillion this year. This $25Ābillion increase has occurred despite significant tax relief enacted during the period. After adjusting for law changes, underlying revenues have grown by more than 10Āpercent annually. While there have been times when the state has experienced larger percentage increases in past decades, these have generally been during high-inflation periods. In contrast, the later 1990s' gains occurred in an environment where inflation was very low--only around 2Āpercent yearly. In addition, although the state's economic performance has been very good, revenue growth has outdistanced even what this strong economic growth would suggest.
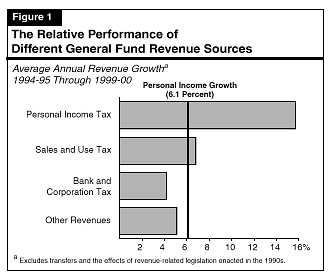
Almost three-fourths of the overall growth in General Fund receipts in this expansion has been from the personal income tax (PIT), which has grown from $18.6Ābillion in 1994-95 to $36.3Ābillion in 1999-00. FigureĀ1 compares the percentage growth in PIT receipts (adjusted for law changes) to that of the state's other two main taxes (the sales and use tax [SUED] and the bank and corporation tax [BCT]), as well as to statewide personal income. It shows that PIT receipts have increased at an average annual rate of about 15Āpercent per year, more than double the pace of statewide personal income during this period.
The figure also shows that growth in the state's other major taxes has been relatively moderate. Despite a large increase in taxable sales last year, SUED receipts during the past five years have averaged 6.8Āpercent, or only slightly more than personal income growth. Growth in the BCT has been even more subdued--just 4Āpercent annually.
The rapid growth in PIT receipts can be attributed to two main factors--aggregate growth in employment and income, and a dramatic shift in the state's income distribution toward the "high" end.
Aggregate Growth in Employment and Income. California's PIT receipts have always been "elastic" with respect to growth in "real" (or inflation-adjusted) personal income. This is a reflection of California's progressive tax bracket structure, where increases in incomes beyond inflation are subject to higher marginal tax rates. We estimate that about 60Āpercent of the PIT growth in the current expansion (that is, about 9Āpercentage points of the 15Āpercent average annual increase in PIT liabilities) can be explained by the "normal" relationship that links personal income growth to PIT liabilities, given the tax-bracket structure and the way in which taxpayers are distributed throughout it.
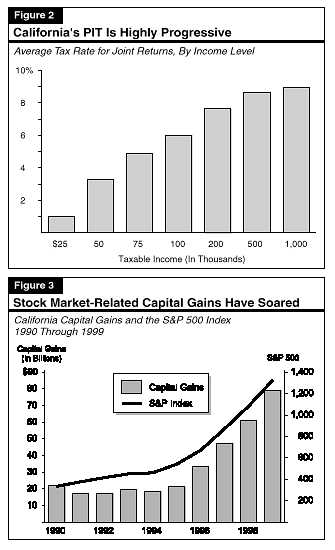
Dramatic Earnings Growth at Top End of Distribution. The remaining 40Āpercent of the PIT increase during the past five years is due to the unusually strong growth in incomes (including capital gains) reported by taxpayers at the top end of the income distribution. Between 1994 and 1999, we estimate that adjusted gross income of the top one-fifth of taxpayers increased roughly twice as fast as that of the bottom four-fifths of returns. This rapid increase had a dramatic impact on tax liabilities, since under California's progressive tax rate structure, earnings at the high end of the distribution are subject to higher tax rates than are earnings at the lower end and middle of the distribution (see FigureĀ2, next page).
Several factors appear to be responsible for this development. One is the increasing returns to education and skill levels in the economy, which is resulting in sharply higher wages for workers in a variety of management, professional, and technical fields. In California, the rapid growth in high-paying computer services industries (discussed in "Part Two" of this volume) also is boosting wages at the high end of the distribution.
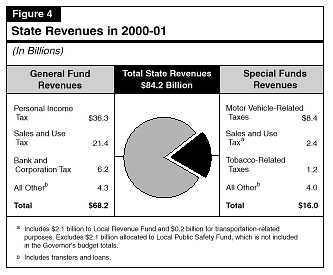
However, the main factor sending high incomes soaring in recent years has been the extraordinary increase in the stock market, which has led to major increases in capital gains and stock option-related income. FigureĀ3 (see next page) shows that capital gains realized on California tax returns have quadrupled in the past five years, from under $20Ābillion in 1994 to nearly $80Ābillion last year. This increase has translated into about $5.5Ābillion, or over 30Āpercent of the total increase in PIT receipts. And even this is an understatement of the stock market's role. This is because the totals in FigureĀ3 do not include stock option income. Although comprehensive direct information on stock option income is not available, indirect information from withholding receipts and certain industry data suggest that stock option income has also risen sharply, perhaps contributing an additional $2Ābillion in new revenues during the past five years.
Overall, we estimate that capital gains now account for as much as 20Āpercent of total PIT receipts, and that stock options income accounts for an additional 5Āpercent to 10Āpercent.
Given the role that capital gains and stock option income have been playing in the state's revenue picture, it is important to consider what we do and do not know about them. This is especially so since the assumptions we make about capital gains in 2000 and beyond are critical to our revenue forecast.
Capital Gains Are Primarily Related to Stocks. In 1997 (the most recent year for which detailed capital gains information is available), over 75Āpercent of California's net capital gains realizations were related to stocks, with the balance related to sales of real estate and other tangible assets. The large share due to stocks partly reflects the tremendous appreciation in stock market valuations in recent years. It also reflects the fact that most capital gains associated with sales of personal residences are excluded from taxation, due to the $500,000 exclusion provided under both the federal and state PIT for such sales.
Gains Reflect a Mix of Short-Term and Long-Term Investments. In 1997, net capital gains realizations related to stocks were associated with a mix of both short-term and long-term investing activity. Data on capital gains by holding period indicate that a majority of transactions in 1997--about two-thirds of the total--were related to stocks held for less than one year. However, these transactions accounted for less than 20Āpercent of the dollar amount of net capital gains realizations. In contrast, stocks held for more than one year accounted for only one-third of the transactions, but 80Āpercent of the dollar gains realized during the year. This is because sales of long-term holdings generally produce much larger gains, given the greater time over which the gains have built up.
Only Small Portion of Gains Are Realized Each Year. There is no direct information on the amount of unrealized capital gains held by households in California. However, national Federal Reserve Bank data on U.S. households' assets and liabilities suggests that total capital gains realized on federal tax returns in 1997 accounted for less than 15Āpercent of the annual appreciation of assets owned by households. Even after accounting for holdings attributable to pension funds, 401 (k) plans, Individual Retirement Accounts, and other tax-deferred investments, the portion of potentially taxable gains which were actually realized appears to be less than one-third. This implies that there is a very large amount of unrealized capital gains that have been "stored up" by households over time.
Substantial Gains Also Are Embedded in Unexercised Stock Options. A comparatively larger share of the stock options annually granted by companies to their employees is exercised each year. Nevertheless, our review of 10-K reports filed by companies with the Securities and Exchange Commission indicates that there is still a large amount of stock options that have yet to be exercised. This is especially the case for many of California's high-tech firms, where the average "exercise" price on outstanding options is often merely a fraction of the stock's current market price.
The state has benefitted enormously in recent years from the boom in the stock market and its associated positive effect on both capital gains realizations and stock option income. These factors have directly raised PIT liabilities, and have indirectly boosted sales and other taxes through their impacts on wealth and confidence in the state's economy.
It is also the case, however, that the rise in stock market values has made the state's revenue stream much less predictable from year to year than in the past. This is because capital gains are inherently far more volatile than, for example, wages or taxable sales. Although capital gains account for only 20Āpercent of PIT receipts and about 10Āpercent of total General Fund revenues, their greater volatility can produce as large, if not larger, a revenue drop-off than other taxes typically experience during times of economic slowdown or recession. For example, capital gains historically have fallen by as much as 50Āpercent in one year, which would translate into a potential reduction of as much as 10Āpercent in PIT revenues and 5Āpercent in total revenues. A decline of this magnitude would amount to about $3.5Ābillion. By comparison, it would take an over 15Āpercent decrease in SUED receipts to produce the same dollar impact--a far larger drop-off than occurred in the severe recession of the early 1990s.
Most of the strong growth in General Fund revenues during the past five years is a reflection of the state's healthy economic expansion, and in particular, the rapid growth in its high-wage, high-value-added computer and software industries. The state has also benefitted enormously from the unprecedented increase in the stock market, which has led to a fourfold increase in capital gains and similar increases in stock option income. While the substantial amount of stored-up gains is clearly a positive factor in the state's fiscal outlook, it is also true that their increased importance makes California's revenue structure more volatile and less predictable than in the past. In addition, it means that the assumptions one makes regarding capital gains realizations are more important than ever in constructing a reliable forecast for General Fund revenues.
With this in mind, we now present our revenue forecast and compare it to the Governor's.
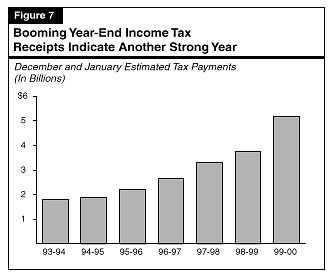
The Governor's budget projects California state government will receive an estimated $84Ābillion in total own-source revenues in 2000-01, a 4.7Āpercent increase from the current year. These revenues are deposited into either the General Fund or a variety of special funds.
FigureĀ4 (see next page) shows that about four-fifths of total state revenues
goes into the General Fund and the remaining one-fifth is received by special
funds. General Fund revenues are allocated each year through the budget process
and support a variety of state programs, including
K-12 and higher education, health and social services, and criminal justice.
In contrast, revenues received by special funds are primarily earmarked for
specific purposes, such as transportation, local governments, or targeted health
programs. Some revenues, such as sales and tobacco taxes, are allocated among
both the General Fund and special funds.
FigureĀ5 (see next page) summarizes the budget's General Fund revenue forecast for 1999-00 and 2000-01. It shows that revenues and transfers are projected to total $65.2Ābillion in the current year, an 11.2Āpercent increase from 1998-99. In 2000-01, revenues and transfers are forecast to increase by 4.7Āpercent compared to 1999-00, reaching $68.2Ābillion.
| Figure 5 | |||||
| Summary of the Budget's General Fund Revenue Forecast | |||||
| 1998-99 Through 2000-01
(Dollars in Millions) |
|||||
| Revenue Source | Actual
1998-99 |
1999-00 | 2000-01 | ||
| Amount | Percent Change | Amount | Percent Change | ||
| Personal Income Tax | $30,891 | $34,461 | 11.6% | $36,319 | 5.4% |
| Sales and Use Tax | 18,957 | 20,236 | 6.7 | 21,396 | 5.7 |
| Bank and Corporation Tax | 5,724 | 6,092 | 6.4 | 6,236 | 2.4 |
| Insurance Tax | 1,254 | 1,277 | 1.8 | 1,304 | 2.1 |
| Other taxes | 1,373 | 1,381 | 0.6 | 1,423 | 3.0 |
| Other revenuesa | 736 | 1,372 | 86.4 | 1,573 | 14.7 |
| Transfers | -319 | 341 | -- | -14 | -- |
| Totals | $58,615 | $65,160 | 11.2% | $68,237 | 4.7% |
| a Includes tobacco settlement receipts of $517 million in 1999-00 and $388 million in 2000-01, plus $191 million from one-time asset sales in 2000-01. In addition, reflects reclassification of child support reimbursements ($96 million in 1999-00 and $282 million in 2000-01) as revenues. | |||||
Compared to the revenue forecast in effect at the time the 1999-00 budget was enacted last summer, the new budget forecast for 1998-99 and 1999-00 combined is up by $2.9Ābillion.
The administration's forecast for the current year reflects the positive economic outlook and strong revenue trends evident during the early months of 1999-00. The 11.2 percent increase reflects healthy gains from each of the major tax sources--particularly the PIT. It also reflects $517Āmillion in added revenues from the tobacco settlement and a net increase in transfers from special funds to the General Fund. Absent these special factors, the underlying General Fund revenue growth rate in the current year would be about 9Āpercent.
The budget forecasts that revenues will increase to $68.2Ābillion in 2000-01, reflecting a comparatively modest growth rate of 4.7Āpercent. This modest increase is partly due to special factors and anomalies--including a decline in receipts of tobacco settlement funds to $388Āmillion, a decline in net transfers, and the impacts of recently enacted and proposed legislation. After taking these factors into account, the underlying budget-year General Fund growth rate is slightly stronger, 5.1Āpercent.
The budget's prediction of a slowdown in underlying revenue growth compared to the current year reflects more moderate increases for all of the major tax sources, especially PIT. This source is projected to grow by under 6Āpercent next year, or about one-half the current-year's pace. The PIT slowdown primarily is due to the administration's assumption about capital gains. Specifically, the administration assumes that capital gains increased by 22Āpercent in 1999, but will fall by 5Āpercent in 2000.
The revenue forecasts by both the administration and our office (see below) incorporate the impacts of recently enacted and proposed tax relief legislation.
1999 Enacted Tax Legislation. Last year, the main tax relief legislation that was enacted involved:
2000 Proposed Tax Changes. The Governor is proposing about $167Āmillion in new tax benefits in the budget year. As indicated in FigureĀ6, the main provisions are (1) a one-time credit for land donations for conservation purposes; (2) a $500 PIT credit for taxpayers who care for elderly or disabled persons in their homes; (3) a state sales tax exemption for qualified investment in rural areas; and (4) a phased-in increase in the net operating loss (NOL) carryover deduction, from 50Āpercent to 60Āpercent.
| Figure 6 | ||
| The Governor's 2000-01 Tax Proposals | ||
| (Revenue Effect in Millions) | ||
| Provision | 2000-01 | Initial
Five Years |
| Long-term care tax credit | $47 | $234 |
| Net operating loss carryover deduction | 1 | 137 |
| Tax credit for land donations | 100 | 100 |
| Exclusion for employer-paid graduate school expenses | 10 | 50 |
| Increased alternative research and development tax credit | 4 | 42 |
| Rural investment tax exemption | 5 | 25 |
| Low-income housing tax credit | -- | 22 |
| Biomass tax credit | -- | 20 |
| Aerospace employment tax credit | Minor | Minor |
| Total reductions | $167 | $610 |
Year-End Developments Necessitate Large Upward Revenue Revision. Economic and revenue developments since the budget was published have been extremely positive. Both the national and state economies ended 1999 on a very strong note, and key revenue receipts have been much more robust than anticipated in the budget. The latter fact is particularly significant because year-end receipts constitute the "spring board" from which the revenue estimates for the remainder of 1999-00 and 2000-01 take off.
Of particular significance is the remarkable increase in year-end PIT estimated payments. These payments were up by 35Āpercent compared to last year (see FigureĀ7). This is a much larger increase than the 17Āpercent increase anticipated in the budget, and is one of the largest year-to-year increases in recent history. These payments are significant since they are attributable to high-income taxpayers with large amounts of capital gains and other forms of volatile nonwage income. In the past, these year-end payments have been a reliable bellwether of the strength in final payments remitted in the following April. If past trends hold, we would expect final payments in April 2000 to once again exceed the budget forecast, by a potentially substantial margin.
As discussed below, the positive year-end cash receipts and economic developments imply that revenues in both the current and budget years will exceed the administration's forecast by a large margin.
FigureĀ8 (see next page) presents our General Fund revenue outlook for 1999-00 and 2000-01. In addition, to help the Legislature in its fiscal planning, we also provide our fiscal projections for an additional year2001-02. Our projections are based on our economic forecast presented in "Part Two," reflect the Governor's proposed tax reductions, and take into account revenue developments through January 2000. For the current and budget years combined, our revenues are up from the budget forecast by $4.2Ābillion.
| Figure 8 | ||||||
| Summary of the LAO's
General Fund Revenue Forecast |
||||||
| 1999-00 Through 2001-02
(Dollars in Millions) |
||||||
| Revenue Source | 1999-00 | 2000-01 | 2001-02 | |||
| Amount | Percent Change | Amount | Percent Change | Amount | Percent Change |
|
| Personal income tax | $36,300 | 17.5% | $38,350 | 5.6% | $40,670 | 6.0% |
| Sales and use tax | 20,340 | 7.3 | 21,480 | 5.6 | 22,680 | 5.6 |
| Bank and corporation tax | 6,120 | 6.9 | 6,280 | 2.6 | 6,530 | 4.0 |
| Insurance tax | 1,280 | 2.1 | 1,310 | 2.3 | 1,369 | 4.5 |
| Other taxes | 1,472 | 15.7 | 1,417 | -3.7 | 1,477 | 4.2 |
| Other revenues | 1,378 | -0.4 | 1,561 | 13.3 | 1,462 | -6.3 |
| Transfers | 341 | -6.8 | -14 | -- | 100 | -- |
| Totals | $67,231 | 14.7% | $70,384 | 4.7% | $74,288 | 5.5% |
1999-00 Revenues. We forecast that General Fund revenues will total $67.2Ābillion in the current year, an increase of $8.6Ābillion (14.7Āpercent) from 1998-99. This estimate is $2.1Ābillion above the budget forecast, mostly reflecting our higher estimate for PIT receipts. As shown in FigureĀ8, the main source of growth in the current year involves income taxes. The SUED and BCT are expected to grow at more moderate, but still healthy, rates.
2000-01 Revenues. We forecast that revenues will total $70.4Ābillion in 2000-01, an increase of $3.2Ābillion (4.7Āpercent) from the current year. This estimate also is up $2.1Ābillion from the budget forecast, primarily reflecting the ongoing effects of the current higher underlying trend in economic and revenue activity.
2001-02 Revenues. We forecast that revenues will total $74.3Ābillion in 2001-02, an increase of $3.9Ābillion (5.5Āpercent) from 2000-01. This projected growth rate is consistent with the moderate expansion in economic activity we are projecting for California through 2002.
The state's three major taxes--the PIT, SUED, and BCT-account for over 93Āpercent of General Fund revenues in 1999-00. Thus, the performance of these taxes dominates the overall revenue outlook. In the following sections, we discuss in more detail recent developments and the outlook for each tax.
The PIT is now the state's largest single revenue source, surpassing collections from the combined state and local SUED this year. With regard to General Fund revenues, it is easily the largest individual source, accounting for 54Āpercent of total receipts in the current year. In general, the PIT is patterned after federal law with respect to reportable types of income, deductions, exemptions, exclusions, and credits. Taxable income is subject to marginal rates ranging from 1Āpercent to 9.3Āpercent, with the top rate applying to incomes in excess of $70,000 for joint returns and $35,000 for single filers in 2000.
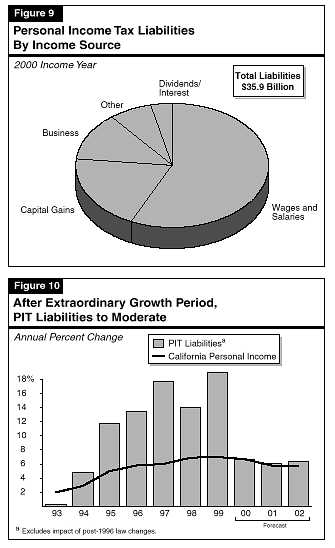
Sources of PIT Liabilities As shown in FigureĀ9 (see next page), as of 1997 (the most recent year for which detailed data are available) almost 60Āpercent of total state PIT liabilities were attributable to wages and salaries. Capital gains and business income accounted for slightly less than 15Āpercent each, with interest, dividends, and other sources accounting for the remaining 10Āpercent. The continued dramatic growth in capital gains has likely boosted its share to nearly 20Āpercent as of 1999.
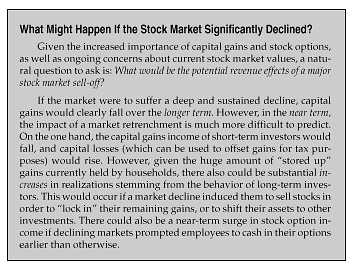
PIT liabilities have been growing at an extraordinary pace in recent years. As shown in FigureĀ10 (see next page), liability growth has averaged 15Āpercent during the 1996 through 1998 period, and based on cash receipts, appears to have increased by approximately 20Āpercent in 1999. These increases are more than double the growth in the statewide economy, as measured by personal income growth.
Part of the PIT liability growth is due to the normal interaction of economic growth and California's progressive PIT tax-bracket structure. However, as noted in the first section of this part, liabilities also are being boosted by extremely rapid growth in the earnings of taxpayers concentrated in the upper end of the income distribution. These rapid high-end increases, which are subject to the state's top marginal PIT rate of 9.3Āpercent, primarily stem from dramatic growth in capital gains, stock options, and other sources of volatile income which are becoming an increasingly important part of California's economy.
Our PIT forecast assumes that after another very strong year in 1999, tax liabilities will grow at more moderate rates in the subsequent three years. Specifically, we estimate that liabilities will grow by 6.6Āpercent in 2000, 6.1Āpercent in 2001, and 6.4Āpercent in 2002.
Most of the individual PIT income components are expected to grow at a healthy clip in 2000, before moderating some in 2001 and 2002. With regard to capital gains, we assume that after jumping by over 30Āpercent in 1999, realizations will stabilize at their all-time high level of $80Ābillion in both 2000 and 2001, before growing 5Āpercent in 2002. Underlying this forecast is the assumption that the stock market will remain relatively flat during the next two years.
Based primarily on our forecast for PIT liabilities, we estimate that PIT revenues will be $36.3Ābillion in 1999-00, up $5.5Ābillion (17.5Āpercent) from the prior year. We forecast that PIT collections will increase to $38.4Ābillion in 2000-01 (a 5.6Āpercent increase), and to $40.7Ābillion in 2001-02 (a 6Āpercent rise). Our estimates for the current and budget years are up from the administration's forecast by $1.8Ābillion and $2Ābillion,respectively, reflecting the recent strength of cash receipts and our more optimistic assessment regarding the near-term outlook for the economy.
The SUED is the General Fund's second largest revenue source, accounting for about 30Āpercent of total collections in 1999-00. The term sales and use tax actually refers to two separate levies:
As indicated in FigureĀ11, the SUED rates paid in California are actually the combination of several individual tax rates levied by the state and individual local governments. These rates can be divided into three general categories:
| Figure 11 | |
| Sales and Use Tax Rates in California | |
| Current Rate | |
| State | |
| General Fund | 5.00% |
| 1991 program realignment (Local Revenue Fund) | 0.50 |
| Local Public Safety Funda | 0.50 |
| Total | (6.00%) |
| Local | |
| Uniform local taxesb | 1.25% |
| Optional local taxes | 1.50c |
| Total | (2.75%) |
| Statewide Maximum Rate | 8.75% |
| a These revenues are not shown in the Governor's budget totals. | |
| b Levied in all counties. | |
| c Maximum allowable rate, except maximum rate is 1.75 percent in San Francisco City and County and 2 percent in San Mateo County. | |
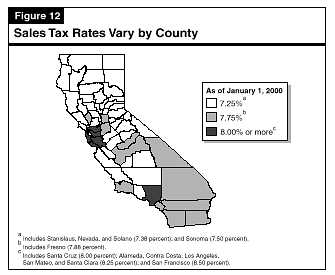
Combined State and Local Tax Rates Differ. As shown in FigureĀ12 (see next page), the combined SUED rate varies significantly across California. Rates range from 7.25Āpercent in the 34 counties that impose no optional sales taxes, up to 8.5Āpercent in San Francisco County. No county currently imposes the maximum allowable rate.
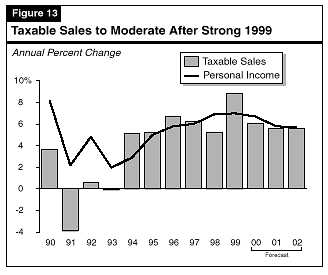
After growing at a moderate pace during the first several years of this expansion, we estimate that taxable sales jumped by nearly 9Āpercent during 1999 (see FigureĀ13). While higher fuel prices last spring played a limited role in the sales increases last year, the main factor appears to have been strong income increases and the wealth effect associated with the appreciation in the stock market. These factors provided consumers with both the resources and confidence to make major spending commitments during the year.
We forecast that 2000 taxable sales growth will slow from 1999's robust pace, but still remain quite healthy at 6.1Āpercent. This projected slowdown reflects our assumption that growth in consumer spending on cars and other durable goods peaked in 1999, and will be a bit more moderate during the next three years. Continued growth in California statewide employment and income, stock market-driven wealth increases, and high levels of consumer and business confidence are likely to remain positive forces in the outlook.
Based on our forecasts for taxable sales, we estimate that SUED revenues will total $20.3Ābillion in 1999-00 (a 7.3Āpercent gain from last year), and increase to $21.5Ābillion in 2000-01 (a 5.6Āpercent rise) and $22.7Ābillion in 2001-02 (also a gain of 5.6Āpercent).
The BCT is the General Fund's third largest revenue source, accounting for about 9Āpercent of the total in 1999-00. Banks and corporations are subject to a general tax rate of 8.84Āpercent on their California taxable profits. However, special treatment applies in a couple of cases:
Other key elements of California's BCT law include partial deductions for NOLs, a minimum tax, rules for apportioning the income of multistate and multinational companies to California, and an Alternative Minimum Tax (AMT) similar to that imposed at the federal level. In addition, a variety of tax credits are allowed, including a manufacturers' investment credit and a credit for research and development expenses.
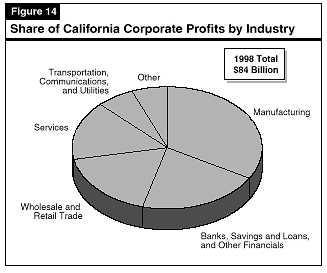
How Profits Are Distributed by Industry. FigureĀ14 shows the distribution of California corporate profits by industry in 1998 (the most recent information available). It shows that the manufacturing sector accounted for about one-third of the total $84Ābillion in profits reported for that year. The services, trade, and finance sectors each account for between 15Āpercent and 20Āpercent of the total, with utilities, transportation, telecommunications, and construction accounting for most of the remainder.
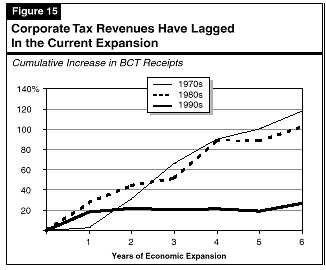
Receipts from the BCT have increased at a very restrained pace during the 1990s. We currently estimate that collections in 1999-00 will total $6.1Ābillion, which is just 26Āpercent above the level of BCT receipts at the beginning of the current economic expansion in 1993-94. As indicated in FigureĀ15, the increase in the current expansion is quite subdued when compared to the growth experienced in BCT receipts during the economic expansions of the 1970s and 1980s.
The recent restrained growth in BCT revenues, which also has been experienced in other states and at the federal level, appears due to the effects of several factors.
Sluggish Growth in Profits. About half of the difference between current and past BCT growth rates is due to weak growth in California taxable corporate profits. These profits have grown only about two-thirds as rapidly as they did in the 1970s' and 1980s' expansions. This slow growth, which also has been observed nationally, has been puzzling to economists and tax analysts in light of the strong performance of the economy. However, one partial explanation involves the restructurings and consolidations that have taken place among some of California's largest and historically most profitable firms. Such actions, even if expected to be profitable in the long term, can involve significant short-term costs and increase the use of previously accumulated NOLs. During the decade, these factors have depressed reported earnings in such industries as aerospace, utilities, telecommunications, and banking, which have historically accounted for significant shares of overall corporate earnings. It has also been suggested by some that increased attention to state tax planning and more aggressive use of corporate tax shelters has contributed to sluggish profit growth.
Tax Relief Enacted in the 1990s. During the 1990s, the state has enacted significant BCT relief. Key provisions include the investment tax credit, a 5Āpercent rate reduction (from 9.3Āpercent to 8.84Āpercent), and expanded research and development credits. The aggregate revenue reductions resulting from these measures have expanded from about $100Āmillion in 1993-94 to over $1Ābillion this year. Overall, we estimate that tax relief accounts for roughly 20Āpercent of the difference between revenue growth in the 1990s and that of the 1970s and 1980s.
Expanded Use of Subchapter S Corporate Status. Due in part to rapid growth in smaller start-up and high-tech businesses throughout California's economy during the past decade, the share of corporation profits attributable to companies electing Subchapter S status has increased sharply in recent years. The annual state BCT revenue reductions resulting from the reduced 1.5Āpercent Subchapter S tax rate have likewise grown--from $466Āmillion in 1994-95 to over $1.6Ābillion this year. This factor accounts for about 30Āpercent of the slower BCT growth rate in the current expansion. It should be noted this factor also has contributed to the strong observed PIT growth, since a portion of these BCT losses are offset by the higher PIT receipts reported by shareholders when profits "flow through" to them.
We predict that BCT revenues will continue to experience moderate growth during the forecast period, increasing from $5.7Ābillion in 1998-99 to $6.1Ābillion this year, $6.3Ābillion in 2000-01, and $6.5Ābillion in 2001-02. Our estimate assumes that California taxable profits will increase by about 6Āpercent in 2000, and by about 5Āpercent in both 2001 and 2002. Manufacturing profits should benefit from the improving exports to Asia, while the earnings in the state's trade and services industries should continue to benefit from strong consumer and business spending. On the negative side, profits in the banking and related financial subsections will be under pressure in 2000 due to rising interest rates. While overall profit growth should be relatively healthy, BCT revenues themselves will continue to be restrained by the rapid growth in the share of earnings attributable to Subchapter S companies.
The remaining 7Āpercent of General Fund revenues consists of insurance, estate, tobacco, and alcoholic beverage taxes, along with tobacco settlement funds, interest on state investments, and a variety of smaller taxes, fees, and transfers between the General Fund and special funds.
We forecast that these other sources will jump from $3Ābillion 1998-99 to $4.4Ābillion in the current year, and then decline slightly to $4.3Ābillion in 2000-01. The significant increase between the prior and current year is primarily due to two special factors: (1) the first-year receipt of tobacco settlement funds, which adds $517Āmillion in revenues in 1999-00; and (2) a large swing in one-time transfers--from a minus $319Āmillion in 1998-99 (associated with various court rulings) to a plus $341Āmillion in the current year.
The small decline in the budget year reflects several offsetting factors. On the plus side, one-time receipts of $191Āmillion from the sale of fixed assets are assumed during 2000-01. However, tobacco settlement funds are estimated to decline to $388Āmillion and one-time transfers are expected to fall to a minus $14Āmillion.
Special funds revenues support a wide variety of state and local government programs. As shown in FigureĀ16 (see next page), slightly over one-half of special funds revenues are related to motor vehicle-related taxes and fees. These include motor vehicle license fees, which are in-lieu of the property tax and whose proceeds are distributed to local governments for general purposes. They also include fuel taxes and registration fees, which support transportation projects.
The remaining one-half of special funds revenues include a portion of the SUED's receipts (which support local health and social services programs), tobacco taxes (which are earmarked for various anti-smoking and health programs), and a variety of other sources.
The budget forecasts that special funds revenues will fall from $15.7Ābillion in 1998-99, to $15.3Ābillion in 1999-00, and then increase to $16Ābillion in 2000-01. The decline in the current year is primarily due to the phase-in of the VLF reduction. Under legislation enacted in 1998 and 1999, the VLF rate declined 25Āpercent in 1999, and an additional 10Āpercent (to a cumulative reduction of 35Āpercent) beginning in 2000.
Fuel taxes are forecast to rise modestly in 1999-00 and 2000-01, reflecting assumed increases in gasoline consumption averaging about 3Āpercent annually, and diesel consumption increases of 3.8Āpercent annually. The SUED special funds revenues are projected to increase by about 8.1Āpercent in the current year and 5.9Āpercent in the budget year, which is consistent with the administration's assumption that taxable sales growth will moderate in 2000 and 2001 from its recent rapid pace.
| Figure 16 | |||||
| Special Funds Revenues and Transfers | |||||
| 1998-99 Through 2000-01
(Dollars in Millions) |
|||||
| Revenue Source | Actual
1998-99 |
1999-00 | 2000-01 | ||
| Amount | Percent Change | Amount | Percent Change | ||
| Motor Vehicle Revenues | |||||
| License fees (in lieu)a | $3,700 | $3,228 | -12.8% | $3,205 | -0.7% |
| Fuel taxes | 3,026 | 3,092 | 2.2 | 3,172 | 2.6 |
| Registration, weight, and miscellaneous fees | 1,843 | 1,921 | 4.2 | 1,994 | 3.8 |
| Subtotals | ($8,569) | ($8,240) | (-3.8%) | ($8,371) | (1.6%) |
| Other Sources | |||||
| Sales and use taxb | $2,054 | $2,221 | 8.1% | $2,352 | 5.9% |
| Cigarette and tobacco taxesc | 826 | 1,158 | 40.2 | 1,137 | -1.8 |
| Interest earnings | 242 | 196 | -19.0 | 200 | 2.0 |
| Other revenues | 3,656 | 3,804 | 4.0 | 3,912 | 2.8 |
| Transfers and loans | 319 | -301 | -- | 39 | -- |
| Totals | $15,666 | $15,318 | -2.2% | $16,011 | 4.5% |
| a Incorporates impacts of Vehicle License Fee rate reductions. | |||||
| b Excludes Local Public Safety Fund revenues. | |||||
| c Incorporates impacts of Proposition 10 (November 1998). | |||||