The Governor's budget proposes total spending of $85.1 billion from the state's General Fund and special funds combined in the budget year, as shown in Figure 1. This amount is $3 billion, or 3.7 percent, more than the $82.1 billion of proposed current-year spending. Of total budget-year spending, General Fund spending accounts for about 80 percent and special funds spending represents the remaining 20 percent.
| Figure 1 | ||||
| Governor's Budget Spending Totals | ||||
| 1999-00 and 2000-01
(Dollars in Millions) |
||||
| 1999-00 | 2000-01 | Change from 1999-00 | ||
| Amount | Percent | |||
| Budget spending | ||||
| General Fund | $65,856 | $68,819 | $2,963 | 4.5% |
| Special fundsa | 16,263 | 16,311 | 48 | 0.3 |
| Totals shown in budget | $82,119 | $85,130 | $3,010 | 3.7% |
| a Does not include Local Public Safety Fund expenditures of $2.1 billion in 1999-00 and $2.2 billion in 2000-01. These amounts are not shown in the Governor's budget. | ||||
| Detail may not total due to rounding. | ||||
Background. The General Fund is the predominate source of support for state programs, and thus finances a wide variety of activities. For example, it is the major funding source for K-12 and higher education; health and social services programs; youth and adult correctional programs; and tax relief. As discussed in "Part Three," the General Fund is primarily funded from tax revenues, with the state's three largest taxes accounting for 93 percent of the total. Because of this, the financing of General Fund expenditures is highly dependent on the state of the economy. The strong economic performance and dramatic revenue gains the state has recently been experiencing, combined with our forecast that healthy economic and revenue growth will continue, will enable the General Fund to both support existing programs and fund new initiatives in 2000-01, whether in the form of program enhancements, new programs, or tax relief.
Proposed Spending. In 2000-01, the Governor proposes General Fund spending of $68.8 billion. This is up roughly $3 billion, or 4.5 percent, from the current-year proposed amount of $65.9 billion.
Background. Special funds are used to allocate certain tax revenues (such as gasoline and certain cigarette tax receipts) and various other income sources (including licenses and fees) for particular functions or activities of government designated by law. As discussed in "Part Three," a bit over one-half of the revenues that support special funds come from motor vehicle-related levies. Other major funding sources include the sales and use tax and tobacco-related levies.
Proposed Spending. In 2000-01, the Governor proposes special funds spending of $16.3 billion. This is essentially the same--up by only $48 million--from the current-year proposed amount.
Treatment of Local Public Safety Fund Expenditures. It should be noted that the spending amounts shown in the budget for state special funds do not include expenditures from the Local Public Safety Fund (LPSF), which total $2.1 billion in 1999-00 and $2.2 billion in 2000-01. The LPSF was established by Proposition 172 (November 1993), which made permanent a temporary half-cent increase in the state sales tax and dedicated the revenue to the LPSF for allocation by the Legislature to cities and counties. These allocations offset some of the local revenue loss from shifts of property taxes to schools during the early 1990s' recession.
We have taken the position in the past, and continue to believe, that LPSF expenditures should be included in the state's special funds spending totals for reasons discussed in last year's Perspectives and Issues (see pages 64-65). This is in contrast to the administration, which treats the LPSF as a trust fund and excludes it from the spending totals. Strictly for the purpose of facilitating comparisons with the Governor's budget, we do not include the LPSF in the figures appearing in this volume.
In addition to the $85.1 billion of proposed 2000-01 spending from the General Fund and special funds discussed above, the budget also proposes $40 billion of spending from federal funds and another $2.9 billion in bond proceeds used for capital outlay purposes. Including expenditures from bond funds and federal funds, spending proposed in the budget for 2000-01 totals $128 billion.
Of the $40 billion in federal funds the budget proposes to spend in 1999-00, the majority--$30 billion (75 percent)--flows down through the state budget to the local level in the form of local assistance. In terms of how the $40 billion in federal funds in the budget is distributed among program areas, the largest portion of these budgeted monies is for federal contributions to health and social services programs ($25.3 billion, or 63 percent), education ($9.5 billion, or 24 percent), and transportation ($3 billion, or about 8 percent). These three program areas combined account for roughly 95 percent of the total.
Budgetary Treatment. The yearly debt-service payments for principal and interest on general obligation bonds and lease-payment bonds are included in the budget's spending figures for the appropriate individual programmatic areas. The same is true for expenditures on capital outlay projects financed through direct appropriations. For 2000-01, the budget's proposed debt-service costs total $2.2 billion for general obligation bonds and $655 million for lease-payment bonds, whereas direct appropriations total $505 million ($398 million General Fund and $107 million special funds).
In contrast, however, the expenditure of bond proceeds is not included in the General Fund and special funds spending figures, but rather is reported in the budget under the heading "selected bond fund expenditures." In other words, because the spending of bond proceeds does not represent a current state cost as does debt service, it is not accounted for in the General Fund and special funds figures until the associated debt-service costs are actually incurred. Nevertheless, the bond fund expenditures data do give an indication of the current spending activity levels associated with capital outlay projects.
General Obligation Bonds. The budget estimates that the state will spend $2.9 billion in general obligation bond proceeds in 2000-01. This compares to $3.5 billion in the current year and $2.7 billion in the prior year. The majority of the budget-year bond fund expenditures (about $2 billion) is for various local assistance projects such as K-12 school construction and transportation. Other significant anticipated bond fund expenditures involve higher education projects ($656 million).
Lease-Payment Bonds. In addition to general obligation bonds, the state also utilizes lease-payment bonds to finance the construction and renovation of facilities. Lease-payment bonds do not require voter approval, and their debt service is paid from annual lease payments by state agencies (funded primarily through General Fund appropriations) for the facilities they use that have been constructed with the bond proceeds. For 2000-01, the budget does not include any proposed financing from lease-payment bonds.
Before looking at the Governor's 2000-01 spending plan in greater detail, it is first instructive to look at the Governor's total proposed spending from a recent historical perspective.
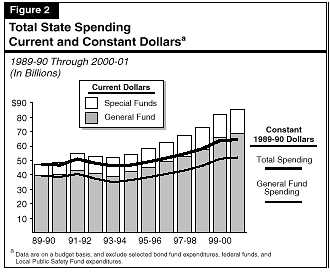
Figure 2 shows the trend in state General Fund and special funds expenditures over the past decade through the budget year (as proposed). Expenditures are shown in both "current dollars" (amounts as they appear in the budget) and "constant dollars" (current dollars adjusted to remove the effects of inflation). This inflation adjustment relies upon using the Gross Domestic Product (GDP) implicit price deflator for state and local government purchases of goods and services. This GDP deflator is a good general measure of the price increases faced by state and local governments and allows comparisons of the "purchasing power" of state resources over time.
The spending growth associated with the Governor's budget plan--3.7 percent for total spending and 4.5 percent for General Fund spending--is relatively modest by historical standards. However, as Figure 2 shows, spending growth has been above average in the last couple of years--especially 1999-00. The current year situation in part reflects a large amount of one-time spending. The result is that the modest total spending growth understates growth in most individual program areas.
Regarding special funds spending growth, the small three-tenths of a percent rise proposed for 2000-01 is due to the reduction in vehicle license fee (VLF) subventions to counties (which are backfilled by the General Fund).
As discussed in previous editions of this volume, the trends in state spending shown in Figure 2, including the relative movements in General Fund versus special funds spending, reflect a variety of factors. The most important has been the course of the economy. Specifically, during the first half of the 1990s, the economic recession and weak revenue growth constrained spending across the board. Conversely, spending growth rebounded in the latter half of the decade, due to California's economic expansion and the accompanying strong growth in revenues. In addition to the economy, however, decisions by policy makers and the voters have affected the spending trends. Among these have been the realignment of state and county health-related responsibilities in 1991-92, and the passage of Proposition 10 (1998) which imposed additional cigarette and tobacco taxes.

As noted above, General Fund spending has been experiencing good growth in the last half of the 1990s. Underlying this trend have been a number of key programmatic changes. These are summarized in Figure 3 and discussed below.
| Figure 3 | |
| Key General Fund Expenditure Developments In Recent Years | |
| |
|
Major Increases in Education Funding. The main programmatic priority of the Governor and Legislature during the second half of the 1990s has been education. Based on the Governor's current proposal for 2000-01, total funding for K-12 and higher education will have increased by 90 percent between 1993-94 and 2000-01, compared to a 60 percent increase for the rest of the budget. Most of the K-12 education increase is due to the rapid increase in the Proposition 98 guarantee in the second half of the 1990s, but it also reflects explicit policy decisions to overappropriate the guarantee in 1997-98 through 2000-01. The increased funds have been used for enrollment growth, cost-of-living adjustments, and such education-related initiatives as class size reduction, lengthened school years, school district equalization, and school reforms.
Higher education has also increased significantly in recent years due to enrollment growth and additional monies provided for student fee reductions, building maintenance, new technology grants, research, and initial funding for the addition of a new UC campus in Merced.
Slowing or Declining Caseloads. Expenditure growth has been comparatively moderate in the state's major health, social services, and criminal justice budgets in recent years, and a key factor has involved caseloads. For example, California Work Opportunity and Responsibility to Kids (CalWORKs) caseloads increased by 45 percent between 1989-90 and 1994-95, but declined by 36 percent between 1994-95 and 1999-00. Similarly, annual growth in the number of inmates in state prisons has slowed to less than 2 percent in the current and budget years--down sharply from the 6.9 percent annual increases experienced over the past decade. These slowing caseloads have been the primary reason why growth in overall health, social services, and criminal justice spending has been moderate in recent years despite various program expansions (such as in the Healthy Families and foster care/child welfare services areas).
Major Reforms. The state has undertaken major reforms in two key areas in recent years. In 1997, it adopted welfare reform, in which the former Aid to Families with Dependent Children program was replaced with CalWORKs. The new program emphasizes welfare-to-work, and includes a variety of expanded job training and child-care services, as well as time limits on receiving benefits and sanctions. Taking into account both the federal and state changes in this area, it appears that welfare reform has resulted in a reduction in state spending.
The state also enacted trial court financial restructuring which includes increased state funding for trial court operations. This has resulted in several hundred millions of dollars in additional state costs each year because the local funding portion was reduced and capped.
Significant One-Time Expenditures. In recent years, the state has sharply increased one-time expenditures for a variety of state and local purposes. Examples include: over $500 million in the 1998-99 budget for Headwaters Forest preservation and Colorado River water management; $50 million in 1998-99 and $425 million in 1999-00 for the capitalization of the Infrastructure Bank; and various one-time expenditures for park acquisition, deferred maintenance, capital outlay, and education grants.
Tax Relief. In 1998 and 1999, the state enacted legislation providing for a 25 percent VLF rate reduction and accelerated an additional 10 percent reduction, with further reductions contingent on the future performance of state revenues. Since the VLF is a local tax, the state "backfills" the revenue losses to local governments. This resulted in approximately $500 million in General Fund subventions in 1998-99, an estimated $1.4 billion in the current year, and a projected $1.8 billion in 2000-01. (Various other tax relief measures have been enacted, but their effects appear on the revenue side of the budget.)
With this perspective on past spending trends, we now focus on the Governor's 2000-01 spending plan by major program area.
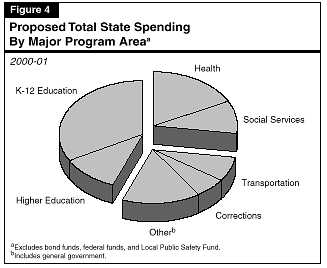
Figure 4 shows the allocation of the proposed $85.1 billion of total state spending in 2000-01 among the state's major program areas. Both General Fund and special funds expenditures are included in order to provide a meaningful comparison of state support among broad program categories, since special funds provide the bulk of the support in some areas (such as transportation).

The figure shows that K-12 education receives the largest share of proposed total state spending--one-third. (It should also be noted that K-12 education receives additional funding from local sources.) When higher education is included, the education share rises to over 44 percent. (In terms of just General Fund spending, education's share exceeds 50 percent.) Health and social services programs account for about 27 percent of proposed total spending, while transportation and corrections together account for another roughly 14 percent. In the "all other" category (15 percent), the largest share is for general-purpose assistance provided to local governments in the form of VLF revenues.
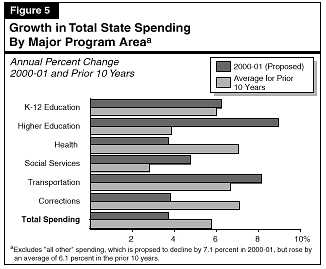
Figure 5 shows proposed changes in support for major program areas in the budget year, and also provides an historical perspective by showing the average annual growth in these programs over the past ten years.

The greatest percentage growth proposed for 2000-01 is in the areas of higher education (9 percent), transportation (about 8 percent), and
K-12 education (over 6 percent). In contrast, proposed total spending growth is less for social services (4.7 percent), corrections (3.8 percent), and
health (3.7 percent). As shown in the figure, budget-year growth is greater than the ten-year average for all program areas other than health and
corrections.
Figure 6 (see next page) details the breakout by program area of General Fund spending for the prior through budget years. It also shows the percentage growth between the current and budget years. In brief, the budget proposes an 11 percent increase for higher education; approximately 6 percent growth for K-12 education, community colleges, Medi-Cal, SSI/SSP, and "other" health and social services programs; and slightly less than 4 percent growth for Youth and Adult Corrections. The budget reflects an increase for the CalWORKs program, but this is due to technical changes related to the child support programs. After adjusting for these changes, the budget would reflect a decrease of about 6 percent.
| Figure 6 | ||||
| General Fund Spending by Major Program Area | ||||
| (Dollars in Millions) | ||||
| 1998-99 | 1999-00 | Proposed 2000-01 | ||
| Amount | Percent
Change |
|||
| Education Programs | ||||
| K-12 Education | $23,528 | $26,366 | $28,014 | 6.3% |
| Community Colleges | 2,260 | 2,452 | 2,613 | 6.6 |
| UC/CSU | 4,632 | 4,912 | 5,431 | 10.6 |
| Other Higher Education | 510 | 581 | 656 | 12.9 |
| Health and Welfare Programs | ||||
| Medi-Cal | $7,471 | $8,209 | $8,749 | 6.6% |
| CalWORKs | 2,022 | 1,994 | 2,072 | 3.9 |
| SSI/SSP | 2,242 | 2,483 | 2,620 | 5.5 |
| Other | 4,327 | 5,157 | 5,479 | 6.2 |
| Youth and Adult Corrections | $4,547 | $4,868 | $5,054 | 3.8% |
| All Other a | $6,287 | $8,835 | $8,130 | -8.0% |
| Totals | $57,827 | $65,856 | $68,819 | 4.5% |
| a The 2000-01 decline is partly due to one-time spending in 1999-00. | ||||
Finally, the budget shows that combined General Fund spending on all other programs is proposed to decline by 8 percent in the budget year. This decline reflects the large number of one-time expenditures in the current year.
In the next section, we provide additional discussion regarding the budget's proposals in different program areas.