Legislative Analyst's OfficeAnalysis of the 2002-03 Budget Bill |
The budget includes an increase in K-12 Proposition 98 funding of $1.2 billion in the budget year. This is $136 per pupil, or 2 percent, more than the revised estimate of per-pupil expenditures in the current year.
Figure 1 shows the budget from all significant sources for K-12 education for the budget year and the two previous years. As the figure shows, Proposition 98 funding constitutes over three-fourths of overall K-12 funding. For 2002-03, the budget proposes to increase K-12 Proposition 98 funding by $1.2 billion above revised current-year expenditures (based on the Governor's November Revision). This represents an increase of $136 per pupil, or 2 percent, on an average daily attendance (ADA) basis, bringing Proposition 98 per-pupil spending to $7,058.
|
Figure 1 K-12 Education Budget Summary |
|||||
|
2000-01 Through 2002-03 |
|||||
|
|
Actual |
Estimated |
Proposed |
Change
From |
|
|
Amount |
Percent |
||||
|
K-12 Proposition 98 |
|||||
|
State (General Fund) |
$27,228.9 |
$28,269.7 |
$28,581.5 |
$311.9 |
1.1% |
|
Local property |
10,797.1 |
11,716.5 |
12,627.3 |
910.7 |
7.8 |
|
Subtotals, |
($38,026.0) |
($39,986.2) |
($41,208.8) |
($1,222.6) |
(3.1%) |
|
Other Funds |
|||||
|
General Fund |
|||||
|
Teachers' retirement |
$833.8 |
$716.6 |
$481.5 |
-$235.1 |
-32.8% |
|
Bond payments |
1,058.5 |
1,136.8 |
1,279.8 |
143.0 |
12.6 |
|
Other programs |
170.8 |
822.0 |
888.2 |
66.2 |
8.1 |
|
State lottery funds |
827.0 |
813.0 |
813.0 |
� |
� |
|
Other state funds |
58.9 |
63.8 |
62.9 |
-0.9 |
-1.4 |
|
Federal funds |
4,476.1 |
5,280.6 |
5,215.4 |
-65.2 |
-1.2 |
|
Other local funds |
3,455.0 |
3,455.0 |
3,455.0 |
� |
� |
|
Subtotals, Other Fundsa |
($10,880.1) |
($12,287.8) |
($12,195.8) |
(-$92.1) |
(-0.7%) |
|
Totalsa |
$48,906.1 |
$52,274.0 |
$53,404.5 |
$1,130.4 |
2.2% |
|
K-12 Proposition 98 |
|||||
|
Average Daily |
5,691,527 |
5,776,829 |
5,838,438 |
61,609 |
1.1% |
|
Amount per ADA |
$6,681 |
$6,922 |
$7,058 |
$136 |
2.0% |
|
a Totals may not add due to rounding. |
|||||
|
|
|||||
Spending for K-12 education from all sources is projected to increase by $1.1 billion, or 2.2 percent, above the current-year level. This reflects the budget's estimate that several non-Proposition 98 funding sources either will not grow or will decline. This estimate, however, probably understates the resources that will be available. For example, the state will be receiving about $600 million of federal funds for K-12 education in the budget year that is not included in the budget.
The budget proposes a General Fund K-12 Proposition 98 increase of approximately $312 million. The budget estimates an increase in local property taxes allocated to school districts and county offices of education of $911 million, which brings the total Proposition 98 increase for K-12 education to more than $1.2 billion.
Figure 2 highlights the significant changes proposed for K-12 Proposition 98 funds in the budget year. Major changes include:
|
Figure 2 Governor's K-12 Budget Proposals 2002-03 Proposition 98 |
|
|
(In Millions) |
|
|
2001-02 (November Revision) |
$39,986.2 |
|
Enrollment Growth |
|
|
Revenue Limits |
$300.1 |
|
Categoricals |
137.6 |
|
Subtotal |
($437.7) |
|
Cost-of-Living Increases |
|
|
Revenue Limits |
$599.1 |
|
Categoricals |
244.2 |
|
Subtotal |
($843.3) |
|
Other Changes |
|
|
Instructional materials block grant |
$250.0 |
|
High priority schools grant |
197.0 |
|
Child care backfill of stages 1 and 2 |
152.0 |
|
Child care stage 3 |
32.5 |
|
Before/after school programs |
29.7 |
|
Public Schools Accountability Act |
29.6 |
|
Deferred maintenance |
26.6 |
|
Math/Reading Professional Development |
22.9 |
|
Teaching as a Priority Block Grant |
20.0 |
|
School safety |
10.0 |
|
Volunteer Mentor Program |
10.0 |
|
School/development resource consortia |
-21.6 |
|
CalWORKsa adult education |
-36.0 |
|
Independent study |
-43.0 |
|
Special education federal funds |
-112.3 |
|
Schiff-Bustamante instructional materials |
-250.0 |
|
Eliminate
instructional/library |
-356.3 |
|
Other |
-19.7 |
|
Subtotal |
(-$58.4) |
|
2002-03 (proposed) |
$41,208.8 |
|
Change From 2001-02 |
|
|
Amount |
$1,222.6 |
|
Percent |
3.1% |
|
a California Work Opportunity and Responsibility to Kids. |
|
|
|
|
Figure 3 shows Proposition 98 spending for major K-12 programs. "Revenue limit" funding (available for school districts and county offices to spend on general purposes) accounts for $28 billion in 2002-03, or over two-thirds of Proposition 98 expenditures. The General Fund supports about 56 percent of revenue limit funding, and local property taxes provide the remaining 44 percent.
|
Figure 3 Major K-12 Education Programs |
||||
|
(Dollars in Millions) |
||||
|
|
November
Revision |
Proposed |
Change |
|
|
Amount |
Percent |
|||
|
Revenue Limits |
||||
|
General Fund |
$15,776.2 |
$15,746.1 |
-$30.1 |
-0.2% |
|
Local revenue |
11,414.3 |
12,302.4 |
888.1 |
7.8 |
|
Subtotalsd |
($27,190.5) |
($28,048.5) |
($858.0) |
(3.2%) |
|
Categorical Programs |
||||
|
Special education |
$2,732.7 |
$2,714.9 |
-$17.8 |
-0.7% |
|
Class size reduction |
1,741.5 |
1,793.0 |
51.4 |
3.0 |
|
Child development |
1,279.5 |
1,514.5 |
235.0 |
18.4 |
|
Targeted instructional granta |
713.4 |
736.5 |
23.1 |
3.2 |
|
Adult education |
600.7 |
593.0 |
-7.7 |
-1.3 |
|
Public Schools |
318.0 |
544.6 |
226.6 |
71.3 |
|
Home to school transportation |
507.0 |
523.4 |
16.4 |
3.2 |
|
Economic impact aid |
465.6 |
499.4 |
33.8 |
7.3 |
|
Summer school/after school |
434.9 |
449.1 |
14.2 |
3.3 |
|
School improvement |
418.5 |
429.8 |
11.4 |
2.7 |
|
ROC/Psb |
360.0 |
375.7 |
15.6 |
4.3 |
|
Instructional/library materialsc |
606.3 |
250.0 |
-356.3 |
-58.8 |
|
Supplemental grants |
233.8 |
241.4 |
7.6 |
3.2 |
|
Staff development day buy-out |
224.2 |
230.0 |
5.8 |
2.6 |
|
Deferred maintenance |
176.2 |
205.4 |
29.2 |
16.6 |
|
Mandates |
164.3 |
153.3 |
-11.0 |
-6.7 |
|
Assessments |
126.5 |
137.6 |
11.1 |
8.8 |
|
Other |
1,692.6 |
1,768.7 |
76.1 |
4.5 |
|
Subtotalsd |
($12,795.7) |
($13,160.3) |
($364.6) |
(2.8%) |
|
Totalsd |
$39,986.2 |
$41,208.8 |
$1,222.6 |
3.1% |
|
a Chapter 891, Statutes of 2001 (SB 735, Senate Committee on Budget and Fiscal Review), combines court-ordered desegregation and voluntary desegregation programs into a targeted instructional improvement grant. |
||||
|
b Regional occupational centers/programs. |
||||
|
c Governor�s budget replaces four existing programs with a block grant. The 2001-02 amount also includes the last year of funding ($250 million) for the Schiff-Bustamante program. The 2002-03 amount does not include $300 million of one-time funds from another source. |
||||
|
d Totals may not add due to rounding. |
||||
|
|
||||
The largest "categorical" program (expenditures earmarked for a specified purpose) is special education. The budget proposes $2.7 billion from Proposition 98 sources for special education. Class size reduction in K-3 and 9th grades is the second largest categorical spending area in 2002-03 at almost $1.8 billion. An increase of $51 million (3 percent) is due to COLA and growth in the K-3 program.
The budget proposes $535 million of one-time spending from the Proposition 98 Reversion Account. Spending from this account is funded entirely by unspent balances from prior-year and current-year appropriations.
Figure 4 shows estimated savings of $535 million available for one-time reallocation in 2002-03. The list of savings includes several reductions or deletions of current-year appropriations proposed by the Governor's November Revision that were changed by legislative action in the third extraordinary session. Specifically, the Legislature:
|
Figure 4 Proposition 98 Reversion Account |
|
|
2002-03 |
|
|
|
|
|
Savings |
|
|
Initial reversion balance |
$166.3 |
|
K-12 per-pupil block grant |
67.8 |
|
9th grade class size reduction savings (1999-00) |
60.0 |
|
CCFRFa reversion |
42.0 |
|
Revenue limit equalization |
40.0 |
|
PERSb offset |
35.0 |
|
CCCc property tax savings (2001-02) |
24.8 |
|
CalSAFE savings |
18.9 |
|
Teaching as a Priority block grant |
17.8 |
|
Child care savings (2001-02) |
17.0 |
|
CCC property tax savings (2000-01) |
17.0 |
|
Beginning teacher salary (2001-02) |
12.0 |
|
Teacher reading partnerships |
5.0 |
|
Advanced Placement Challenge Grants |
4.0 |
|
High-Tech High Schools |
4.0 |
|
California School Information Services |
2.6 |
|
CCCoil and mineral revenue |
0.6 |
|
Totald |
$534.9 |
|
Expenditures |
|
|
Textbook Block Grant |
$200.0 |
|
Library Block Grant |
100.0 |
|
Math and Reading |
87.1 |
|
Science Lab Materials and Equipment |
75.0 |
|
CCCscheduled maintenance |
22.9 |
|
CCCequipment |
22.9 |
|
California School Information Services |
15.5 |
|
Principal Training |
7.5 |
|
High-Tech High Schools |
4.0 |
|
Totald |
$534.9 |
|
a Child care facilities revolving fund. |
|
|
b Public Employees' Retirement System. |
|
|
c California Community Colleges. |
|
|
d Totals may not add due to rounding. |
|
|
|
|
The Legislature "paid" for these changes with the following two reductions to current-year reversion account appropriations:
The net effect of the Legislature's changes leaves the same balance in the reversion account available for expenditure on K-14 programs in the budget year as proposed by the Governor�$535 million. The budget proposes spending all of these estimated savings. The largest expenditures are $200 million and $100 million, respectively, for the Governor's proposed textbook block grant and library materials block grant.
Enrollment growth significantly shapes the Legislature's annual K-12 budget and policy decisions. When enrollment grows slowly, for example, fewer resources are needed to meet statutory funding obligations for revenue limits and K-12 education categorical programs. This leaves more General Fund resources available for other budget priorities both within K-12 education and outside it. Conversely, when enrollment grows rapidly (as it did in the 1990s), the state must dedicate a larger share of the budget to education. In light of the important implications of enrollment growth, we describe below two major trends in the K-12 student population.
The enrollment numbers used in this section are from the Department of Finance's Demographic Research Unit, and reflect aggregate, statewide enrollment. While the enrollment trends described here will likely differ from those in any given school district, they reflect the overall patterns the state is likely to see in the near future.
K-12 enrollment is projected to increase by about 1 percent in 2002-03, bringing total enrollment to about 6.2 million students. Figure 5 shows how enrollment growth has slowed since 1996-97 and is projected to continue slowing through 2007-08. This trend is expected to result in an actual decrease in the number of pupils enrolled beginning in 2008-09. This contrasts with growth averaging 2.2 percent annually during the 1990s.
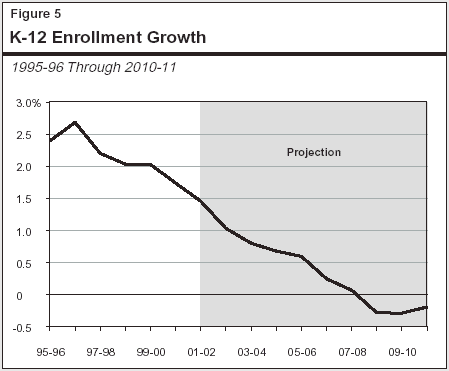
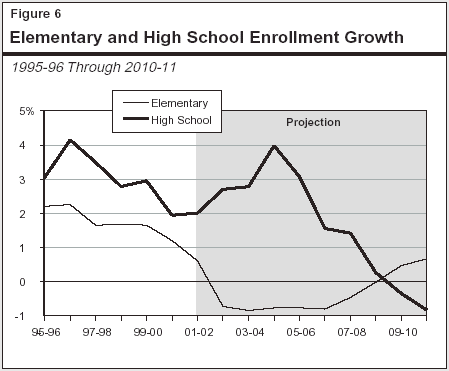
Figure 6 shows that the steady decline in K-12 enrollment growth masks two distinct trends in elementary (grades K to 6) and high school (grades 9 to 12) enrollment. Elementary school enrollment growth has gradually slowed since 1996-97. Growth rates are expected to become negative in 2002-03 and remain negative through 2008-09. From the current year through 2008-09, elementary school enrollment is expected to decline by 148,000 pupils (4.4 percent).
In contrast, high school enrollment growth is expected to accelerate in the short term, reaching a 4 percent growth rate in 2004-05. Then, growth is expected to slow sharply, becoming negative in 2009-10. Expected growth over the next seven years is slightly over 290,000 pupils (17 percent).
These trends have significant budgetary and policy implications for issues such as class size reduction, teacher demand, and facilities investment. A few of the major implications include: