Analysis of the 2004-05 Budget BillLegislative Analyst's Office
|
The U.S. and California economies are entering 2004 with significant momentum which we believe will continue through the budget year. The one major exception to the generally upbeat economic picture is employment growth, which continues to lag despite major gains in consumer and business spending and output in the economy. The lack of job growth has not held back the recovery so far, but continued softness in this key area could undermine consumer and business confidence, spending, and ultimately at some point in the future, the overall economic expansion.
For nearly two years following the 2001 downturn, the U.S. economy expanded at a slow and uneven pace. The recovery was concentrated in consumer-durable purchases and home construction, boosted by historically low interest rates and federal tax cuts. Business spending and hiring remained stubbornly weak during this period, reflecting sluggish profit growth, falling stock prices, and cautious attitudes of businesses executives.
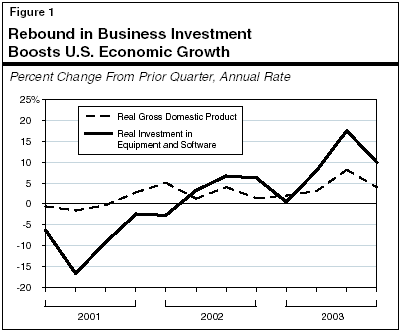
As shown in Figure 1, business investment finally joined the expansion in the second half of 2003, and is slated to exhibit added strength throughout the forecast period. Led by major increases in computer and software spending, total investment in equipment jumped by 18 percent in the third quarter and 10 percent in the final quarter of 2003. These increases—coupled with solid gains in consumer spending, housing activity, and exports—contributed to a 6 percent annual rate of increase in gross domestic product (GDP) during the second half of the year.
Monthly reports for December 2003 and early January 2004 suggest that the economy entered this year with substantial forward momentum. For example:
The Consumer Price Index was up just 1.9 percent between December 2002 and December 2003, with the "core" rate (that is, the rate excluding the volatile food and energy sectors) up just 1.1 percent. Furthermore, there are no signs of accelerating inflation right now. Most commodity prices remain stable, wage increases are staying mild, and there still is considerable unused production and resource capacity both in the U.S. and in many other regions throughout the world. This lack of inflationary pressures should result in limited increases in interest rates in the near future. While long-term interest rates have risen in recent months, these rates remain low by historical standards, providing continued support for those key sectors of the economy such as housing and investment that are sensitive to them. The future course of interest rates will depend in part on the response of federal monetary authorities to economic developments—particularly any signs of emerging inflation.
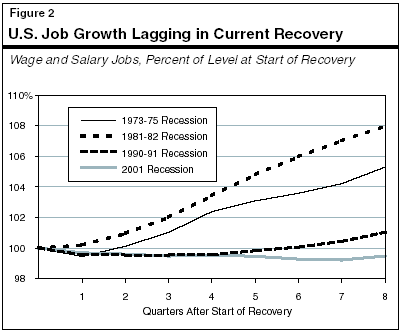
The one "weak link" in this expansion has been jobs. Employment growth normally lags in economic upturns, as businesses initially add hours and utilize their existing workforce more intensively before hiring new workers. However, the lag in this expansion between when production improved and job growth occurred has been much longer than in the past. This is depicted in Figure 2 (next page), which compares job performance in the respective economic recoveries following the 1973-75, 1981-82, and 1990-91 recessions. It indicates that:
What Explains This Poor Employment Performance? Although economists do not yet seem to fully understand why recent job performance has been so weak, several different factors appear to be at work. For example, there is evidence that significant outsourcing of jobs to low-wage countries has been occurring in certain industries. In addition, many businesses have continued to pursue aggressive cost-cutting measures even as the expansion has taken hold. However, many economists believe the major single factor involves productivity. Specifically, output gains in this expansion have been primarily accomplished through significant increases in the rate of productivity growth, which in turn has allowed the output gains to occur despite weak job growth. From a long-term perspective, rapid productivity growth is generally a very positive development. This is because increased output per worker typically translates into rising incomes, wealth, and living standards over time. In the current environment, however, the lack of jobs that has accompanied the recent productivity surge is a concern. In particular, there is a potential risk that continued stagnation on the job front will translate into reduced consumer and business confidence levels, less spending, less profits, and still-lower employment levels in the future.
So far, there is little evidence that this is occurring. Indeed, despite the lack of payroll job growth, the other major source of employment data (the household survey) has been showing some modest gains, the unemployment rate continues to fall slowly, and surveys are indicating that consumer confidence levels are rebounding. Furthermore, as discussed in more detail below, it is possible that true job growth is itself being understated by the payroll survey of businesses, and that the modest gains reported in the household survey are more reflective of the economy. Regardless, a resumption of more job growth remains a critical assumption in the outlook.
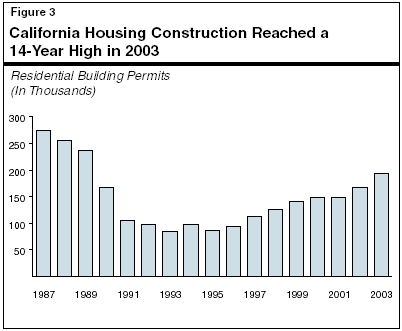
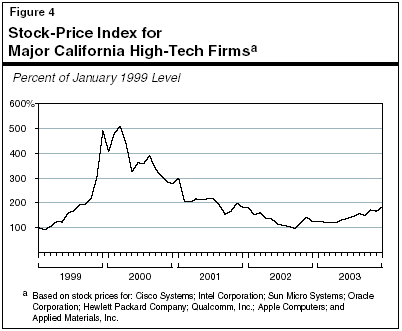
By most accounts, California's economy also is on the upswing. Recent positive indicators include:
As with the rest of the nation, the job market remains weak in California. In fact, employment performance in California was even softer than for the remainder of the country in late 2003. After jumping 32,000 in October, state jobs fell by 20,000 in November and another 8,000 jobs in December.
Declines Steeper Than Nationally. Overall job losses in this state have been slightly steeper than for the nation as a whole since the recession began in early 2001. Specifically, California has lost 1.9 percent of its payroll jobs since the beginning of the 2001 downturn. This compares to a 1.7 percent job loss for the nation as a whole. During the same period, manufacturing employment fell by 18 percent for California compared to 15 percent for the nation.
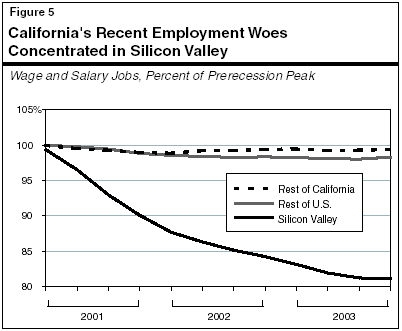
Virtually All of the Weakness Concentrated in Silicon Valley. A closer look at the state's geographic employment patterns reveals that virtually all of its slightly weaker-than-average performance is related to the major economic downturn that has occurred in the Bay Area's Silicon Valley. Figure 5 shows that total employment fell by 19 percent in the San Jose metropolitan area between the first quarter of 2001 and the fourth quarter of 2003. By contrast, the rest of the state has lost just 1 percent of its employment base, or proportionally less than the rest of the nation.
Household Employment Survey Showing More Growth. As discussed in detail in our November fiscal outlook and noted above, employment data come from two sources—a monthly payroll survey of employers and a household survey. There is some evidence that the payroll survey is currently understating employment performance. As shown in Figure 6, the separate survey of households—which also is used to calculate the unemployment rate and provides data on labor force characteristics—shows a state employment gain of 1.6 percent (256,000 jobs) between December 2002 and December 2003. This compares to the payroll survey estimate of a 0.2 percent loss (32,000 jobs) during the same period.
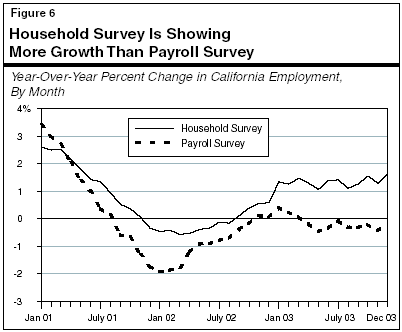
Which Employment Data Are the More Accurate? Normally, the payroll survey is considered to be a more reliable measure of industry employment trends than the household survey. This is due to its larger sample size and greater industry detail. However, the household survey's results are presently more consistent with the other currently upbeat indicators of the economy's performance. There is some evidence that the discrepancy in the employment data is related, in part, to the rapid growth in self-employed individuals and contract employees, which are not included in the payroll survey. If this is indeed occurring, the implications for the economy will depend on the quality of the nonpayroll jobs—such as their compensation levels, their permanence, and whether they are full or part time. At a minimum, however, the growth in the household survey provides some evidence that the job market is "turning the corner," even if the strength of the underlying employment trend is not completely clear.
The budget's economic forecast, which was prepared in early December, assumes that the recent improvement in economic activity will carry over into and throughout 2004, with both the U.S. and California economies accelerating during the year.
As shown in Figure 7, the budget forecasts that real GDP growth will accelerate from 2.9 percent in 2003 to 4.2 percent in 2004, before moderating a bit to 3.6 percent in 2005. The administration assumes that consumer spending will pick up modestly in 2004 compared to the previous year, reflecting accelerating employment and income growth, as well as larger-than-normal federal tax refunds associated with the 2003 tax cuts. The budget also assumes that business investment will accelerate, citing the positive effects of both federal tax incentives and strengthening economic conditions. Finally, the forecast assumes that inflation will remain low and that interest rates will increase modestly in 2004 and 2005 from their current historically low levels.
|
Summary of the
Budget�s Economic Outlook |
|||
|
|
|||
|
|
|
Forecast |
|
|
|
2003 |
2004 |
2005 |
|
U. S. Forecast |
|
|
|
|
Percent change in: |
|
|
|
|
Real GDP |
2.9% |
4.2% |
3.6% |
|
Personal income |
3.2 |
5.1 |
5.8 |
|
Wage and salary employment |
-0.2 |
1.3 |
2.1 |
|
Consumer Price Index |
2.3 |
2.0 |
2.3 |
|
Unemployment rate (%) |
6.0 |
6.0 |
5.8 |
|
Housing starts (000) |
1,790 |
1,720 |
1,630 |
|
California Forecast |
|
|
|
|
Percent change in: |
|
|
|
|
Personal income |
3.8% |
5.6% |
5.9% |
|
Employment: |
|
|
|
|
Payroll survey |
-0.2 |
1.1 |
2.1 |
|
Household survey |
1.2 |
1.2 |
2.0 |
|
Taxable sales |
2.3 |
5.8 |
5.6 |
|
Consumer Price Index |
2.4 |
1.9 |
2.7 |
|
Unemployment rate (%) |
6.7 |
6.7 |
6.5 |
|
New housing permits (000) |
194 |
192 |
198 |
The administration's forecast also assumes that California's economy will expand at a moderate pace in both 2004 and 2005, reflecting strengthening national conditions and federal tax reductions. It specifically projects that the state's personal income growth will accelerate from 3.8 percent in 2003 to 5.6 percent in 2004, and to 5.9 percent in 2005. It also projects that payroll employment will turn the corner in 2004, growing by 1.1 percent during the year, and by an additional 2.1 percent in 2005.
Our expectations for the economy have not changed a great deal since publication of our November 2003 fiscal forecast. Increases in output and spending during late 2003 and early 2004 have generally been consistent with our November projections, although employment in the final months of 2003 was below our forecast. We have also reduced our estimate of California personal income modestly to account for recently released historical evidence that wage levels were lower-than-expected in the first half of 2003. This has reduced our income forecast because it has lowered the base from which our forecast builds. On the whole, we continue to forecast that the U.S. and California economies will grow at a moderate pace in both 2004 and 2005. Our current economic forecast is generally similar to the budget's economic forecast.
As shown in Figure 8, we project that real GDP growth will accelerate from 3.1 percent in 2004 to 4.5 percent in 2005, before moderating to 3.5 percent in 2005. This forecast assumes that consumer spending continues to grow at a moderate pace, while business investment and net exports continue to strengthen during the year. Specifically:
|
Summary of the
LAO�s Economic Outlook |
||||
|
|
||||
|
|
|
Forecast |
||
|
|
2003 |
2004 |
2005 |
2006 |
|
U.S. Forecast |
|
|
|
|
|
Percent change in: |
|
|
|
|
|
Real GDP |
3.1% |
4.5% |
3.5% |
3.3% |
|
Personal income |
3.2 |
5.0 |
5.7 |
5.7 |
|
Wage and salary employment |
-0.2 |
1.4 |
2.0 |
1.6 |
|
Consumer Price Index |
2.3 |
1.4 |
1.8 |
2.0 |
|
Unemployment rate (%) |
6.0 |
5.7 |
5.4 |
5.5 |
|
Housing starts (000) |
1,810 |
1,809 |
1,693 |
1,619 |
|
California Forecast |
|
|
|
|
|
Percent change in: |
|
|
|
|
|
Personal income |
3.5% |
5.7% |
6.0% |
6.0% |
|
Employment: |
|
|
|
|
|
Payroll survey |
-0.2 |
1.1 |
2.2 |
2.2 |
|
Household survey |
1.3 |
1.6 |
2.0 |
1.8 |
|
Taxable sales |
3.9 |
5.9 |
5.8 |
5.7 |
|
Consumer Price Index |
2.6 |
1.9 |
2.2 |
2.4 |
|
Unemployment rate (%) |
6.6 |
6.1 |
5.8 |
5.7 |
|
New housing permits (000) |
194 |
187 |
189 |
181 |
With respect to inflation, we expect it to remain low through the next two years, partly reflecting the available productive capacity that exists in both the U.S. and foreign economies. Major productivity growth and moderate wage increases are also limiting cost pressures that can cause inflation.
What About the Federal Budget Deficit? Federal fiscal policies have become extremely expansionary in the past two years. Policy initiatives involving tax reductions and increases in defense and Medicare spending, combined with the recent recession, have transformed federal budgetary surpluses into large projected federal deficits.
In the near term, these fiscal policies are highly stimulative. The federal tax cuts are resulting in more disposable income, which should lead to more business and household spending, while the added federal spending will produce more outlays in defense and health-related industries. However, over the longer-term, the resulting large deficits could become a drag on economic growth. This will occur to the extent that the added borrowing needed to finance the annual budget deficits puts upward pressure on interest rates, or as policy makers are forced to curtail spending or raise taxes to cover the added debt-service costs in the budget. It is not possible to predict how these factors will ultimately "play out" over the longer-term. However, our forecast assumes that the deficits' impacts on interest rates during the next several years will be relatively modest. This is related to the present lack of inflationary pressures in the economy and the large amount of idle funds both inside the U.S. and in foreign countries that are available to finance the budget deficits.
We anticipate that California's economy will continue to strengthen in 2004, with growth in employment, personal income, and taxable sales accelerating from 2003. We anticipate that layoffs will stabilize and that job growth will commence by the second quarter of this year. As shown in Figure 8:
Outlook for Individual Geographic Regions and Industries. We expect all geographic regions of the state to expand during the next year, although the gains in the San Francisco Bay Area will lag the rest of the state in the first half of 2004. In terms of industry sectors, we expect growth to be broad-based, encompassing services, trade, finance, and construction. As noted above, manufacturing employment should stabilize in the first half of this year, grow slowly in the second half of 2004, and then expand at a more moderate pace in 2005. Finally, we forecast that employment in the combined state and local government sector will be soft, reflecting the difficult budget circumstances facing governments in California.
Figure 9 compares our forecasts for the nation and California to our November 2003 forecasts, as well as to a variety of other economic projections made in recent months by other forecasters. These include the projections made by the University of California at Los Angeles (UCLA) Business Forecast Project in December 2003, the consensus forecast published in the Blue Chip Economic Indicators (January 2004), the consensus outlook forecast in the Western Blue Chip Economic Forecasters (February 2004), and the 2004-05 Governor's Budget forecast.
|
Comparisons of
Recent Economic Forecastsa |
|||
|
(Percent
Changes) |
|||
|
|
2003 |
2004 |
2005 |
|
United States Real
GDP: |
|
|
|
|
LAO November |
3.0% |
4.2% |
3.7% |
|
UCLA December |
2.9 |
3.6 |
3.5 |
|
DOF January |
2.9 |
4.2 |
3.6 |
|
Blue Chip �Consensus�b January |
3.1 |
4.6 |
3.7 |
|
LAO February |
3.1 |
4.5 |
3.5 |
|
California Wage and
Salary Jobs: |
|
|
|
|
LAO November |
-0.4% |
1.3% |
2.6% |
|
UCLA December |
-0.1 |
0.9 |
2.1 |
|
DOF January |
-0.2 |
1.1 |
2.1 |
|
Blue Chip �Consensus�c February |
-0.2 |
1.3 |
2.1 |
|
LAO February |
-0.2 |
1.1 |
2.2 |
|
California Personal
Income: |
|
|
|
|
LAO November |
4.2% |
5.9% |
6.3% |
|
UCLA December |
3.6 |
4.9 |
5.4 |
|
DOF January |
3.8 |
5.6 |
5.9 |
|
Blue Chip �Consensus� c February |
3.4 |
4.7 |
5.2 |
|
LAO February |
3.5 |
5.7 |
6.0 |
|
California Taxable
Sales: |
|
|
|
|
LAO November |
2.4% |
5.9% |
6.3% |
|
UCLA December |
2.6 |
5.0 |
4.9 |
|
DOF January |
2.3 |
5.8 |
5.6 |
|
Blue Chip �Consensus� c February |
3.4 |
5.1 |
5.5 |
|
LAO February |
3.9 |
5.9 |
5.8 |
|
|
|||
|
a
Acronmyms used apply to Legislative Analyst's Office (LAO);
University of California, Los Angeles (UCLA); and Department of Finance
(DOF). |
|||
|
b
Average forecast of about 50 national firms surveyed in January
by Blue Chip Economic Indicators. |
|||
|
c
Average forecast of organizations surveyed in February by Western
Blue Chip Economic Forecast. |
|||
The figure shows that our forecast for U.S. real GDP growth has not changed a great deal since our November fiscal forecast. It is also similar to both the Governor's January budget projection and the consensus forecast. It is significantly higher, however, than UCLA's projection.
The figure also indicates that our forecasts for California employment and personal income are down slightly from our November forecast. These reductions are partly related to recent negative job trends, and the above-noted revision to wage trends based on revised historical data going back to the first half of 2003. Our overall updated forecast is similar to the budget forecast, but higher than the UCLA and consensus forecasts.
In addition to the obvious ongoing risks associated with terrorism at home and abroad, our economic outlook is subject to three other key risk factors—namely, persistent job stagnation, rising interest rates, and an abrupt decline in California home prices.
Jobs. As noted above, a key to continued economic growth in both the nation and state is an improvement in the job picture. A continuation of the lack of job growth during the current recovery—whether because of cautious business attitudes, more outsourcing and expansions abroad, or other factors—could eventually undermine consumer confidence and spending in the state. This, in turn, would produce a significant drag on the economy and possibly undercut the recovery.
Interest Rates. Our forecast assumes that interest rates will remain low throughout much of 2004, and then rise moderately in 2005 and thereafter. A risk to this outlook, particularly in 2005, is that the large amount of federal borrowing needed to support federal spending will put more upward pressure on interest rates in the future than assumed in our forecast. This would have potentially significant adverse impacts on such interest-sensitive areas as business investment, durable goods spending, and housing. The latter is especially significant given California's currently strong housing market, ongoing rapid rise in home prices, and above-average ratios of median home prices and mortgage levels to household income.
California Home Prices. The median home price in California has nearly doubled in the past four years, and as of late 2003 was nearly $400,000. Most economists still do not characterize the current situation as a "speculative bubble" that is about to burst. Rather, they attribute the recent price increases primarily to such basic economic factors as rising demographic-based demand, limited availability of developable land in many key population areas, and low interest rates. These rates have enabled households to take on much larger mortgages relative to their income levels than in the past. However, regardless of whether or not present conditions can be characterized as a speculative bubble, there is no question that housing prices in many areas of the state are vulnerable to setbacks—should weaker-than-expected economic growth materialize or a significant rise in interest rates from current levels occur.
California's demographic trends both directly and indirectly affect the state's economy, revenue collections, and expenditure levels. For example, they influence the size of the labor force, the demand for homes and automobiles, the volume of taxable sales, and the amount of income taxes paid. Similarly, the population and its age distribution affect school enrollments and public programs in many other areas, such as health care and social services. Consequently, the state's demographic outlook is a key element both in estimating economic performance and in assessing and projecting the state's budgetary situation.
Figure 10 summarizes our updated state demographic forecast. We project that California's total population will rise from an estimated 36.5 million in 2004 to 37 million in 2005, and 37.6 million in 2006. These population projections use as their starting point published 2000 Census data for California, and have not been adjusted to correct for issues related to potential undercounting (see last year's detailed discussion on page 32 of the 2003-04 Perspectives and Issues).
|
Summary of the
LAO�s California Demographic Forecast |
|||
|
(Population in
Thousands) |
|||
|
|
2004 |
2005 |
2006 |
|
Total Population
(July 1 basis) |
36,455 |
36,997 |
37,560 |
|
Changes in
Population: |
|
|
|
|
Natural change (births minus deaths) |
285 |
281 |
283 |
|
Net in-migration (in-flows minus out-flows) |
236 |
260 |
280 |
|
Total Changes |
521 |
541 |
563 |
|
Percent Changes |
1.45% |
1.49% |
1.52% |
Some Slowing Projected. The state's population is projected to grow at an average rate of just under 1.5 percent annually over the next three years. This growth is considerably slower than that experienced in the late 1990s and very early 2000s, reflecting both the dampening effects of a slower economy on net in-migration, as well as a continued decline in birth rates. Nevertheless, the state's projected growth rate still is well above the nation's current rate of about 1 percent annually.
In numeric terms, the number of new Californians being added each year—over half-a-million people—is well above the size of such cities as Long Beach, Oakland, and Fresno, and very similar to such states as Wyoming.
California's population growth can be broken down into two major components—natural increase (the excess of births over deaths) and net in-migration (persons moving into California from other states and countries, minus people leaving the state for other destinations). The population growth associated with natural increase accounts for just over one-half of California's projected annual growth over the forecast period, and is assumed to be fairly stable. Net in-migration accounts for the other roughly half of the growth over the period, but varies with California's economic cycle.
Natural Increase. We project that the natural-increase component will contribute an average of 283,000 new Californians annually over the forecast period. This amount is slightly less than in the 1990s, due to the ongoing decline of birth rates being experienced by all ethnic groups. Despite declining birth rates, however, the natural-increase total is projected to increase slightly over time, primarily due to significant growth in the female population of child-bearing age groups in faster-growing segments of the population, including Hispanic and Asian women.
Net In-Migration. The population growth associated with net in-migration is projected to be well below that of the early 2000s—dropping from its 2001 peak of 388,000 to only 236,000 in 2004, a decline of over 150,000. This reflects the last two years' marked deterioration in the state's economic and fiscal climate, which led to increased population outflows to other states and countries and lessened in-flows from them. A modest partial rebound is forecast in 2005 and 2006, as the state's economy strengthens.
The implications of demographic trends for the budget depend not only on the total number of Californians, but also on their characteristics. California is well known for having one of the world's most dynamic and diverse populations, including an increasingly rich ethnic mix; a large number of in-migrants; and a wide geographic dispersion encompassing highly urban, suburban, and rural lifestyles. The state's current age and ethnic mix is shown in Figure 11.
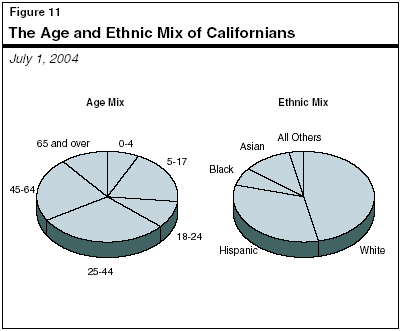
Regarding ethnicity, we project a continuing trend toward increased diversity, as the whites' share drifts down and that for Hispanics and a wide variety of other ethnic groups rises. The age-related characteristics of California's population growth are especially important from a budgetary perspective, given their implications for such program areas as education, health care, and social services. Figure 12 shows our forecasts for both the percentage and numeric changes in different population groups. The 45-to-64 age group (baby boomers) continues to be the fastest growing segment of the population. About 900,000 new people are expected to move into this age category over the next three years, as the tail end of the baby-boom generation moves into its mid-40s.
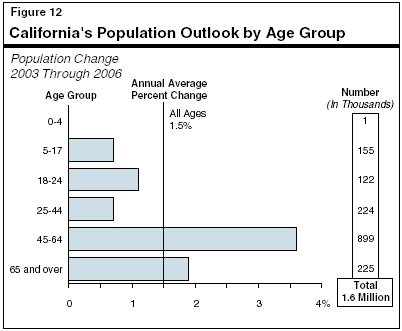
California's continued strong population growth—including its age, ethnic, and migratory characteristics—can be expected to have many implications for the state's economy and public services in 2004-05 and beyond. For example, strong growth of the 45-to-64 age group generally benefits tax revenues since this is the age category that normally earns the highest wages and salaries. Alternatively, the weak growth in the 0-to-4 and 5-to-17 age groups imply slower growth in K-12 school enrollments. More general examples of demographic influences include the following: