Analysis of the 2004-05 Budget BillLegislative Analyst's Office
|
The Governor proposes a total of $617.6 million from general obligation bond funds—$3 million from the Higher Education Capital Outlay Bond Fund of 1998, $38.5 million from the proposed Higher Education Capital Outlay Bond Fund of 2002, and $576.1 million from the Higher Education Capital Outlay Bond Fund of 2004 (on the March 2004 ballot). These would fund 91 projects—69 previously approved and 22 new projects. We recommend the Legislature delete one project. We also recommend the community colleges chancellor's office report to the Legislature on the methods it uses for projecting district enrollment.
The 2003 California Five Year Infrastructure Plan indicates the community colleges identified a need for $6.6 billion of capital outlay between 2003-04 and 2007-08 (see Figure 1). Of this amount, $4 billion was for enrollment growth, $2.4 billion for facility modernization, and $0.2 billion for infrastructure deficiencies. The 2003-04 Budget Act approved $539 million and the 2004-05 Governor's Budget proposes $618 million for community college infrastructure.
|
Community
Colleges |
||||||
|
(In Thousands) |
||||||
|
|
2003-04 |
2004-05 |
2005-06 |
2006-07 |
2007-08 |
Total |
|
Needs
Identified by Community Colleges |
||||||
|
Critical
Infrastructure Deficiencies |
$31,164 |
$42,896 |
$45,346 |
$40,000 |
$40,000 |
$199,406 |
|
Enrollment/Caseload
Population |
502,492 |
571,122 |
657,998 |
1,250,793 |
1,053,623 |
4,036,028 |
|
Facility
Infrastructure Modernization |
28,097 |
115,976 |
323,066 |
1,231,885 |
709,932 |
2,408,956 |
|
Totals |
$561,753 |
$729,994 |
$1,026,410 |
$2,522,678 |
$1,803,555 |
$6,644,390 |
|
Projects
Scheduled for Funding |
||||||
|
Critical
Infrastructure Deficiencies |
$31,164 |
$18,711 |
$21,062 |
$5,529 |
$7,700 |
$84,166 |
|
Enrollment/Caseload/
Population |
502,983 |
356,697 |
306,436 |
175,497 |
204,400 |
1,546,013 |
|
Facility/Infrastructure
Modernization |
28,097 |
38,491 |
131,283 |
168,974 |
137,900 |
504,745 |
|
Totals |
$562,244 |
$413,899 |
$458,781 |
$350,000 |
$350,000 |
$2,134,924 |
|
Approved in
2003-04 and Proposed in 2004-05 |
||||||
|
Totals |
$531,914 |
$617,592 |
|
|
||
Community college districts use enrollment projections prepared by the chancellor's office to justify many projects proposed for funding, and the administration and the Legislature rely on them in making funding decisions. Many of the district projections we have examined, however, appear to be overly optimistic. We discuss our concerns below.
We recommend the Legislature direct the California Community Colleges to review the methods it uses to project enrollment in individual districts and report to the Legislature by November 1, 2004, on its findings and improvements that may be needed.
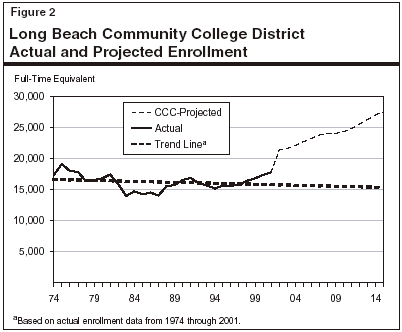
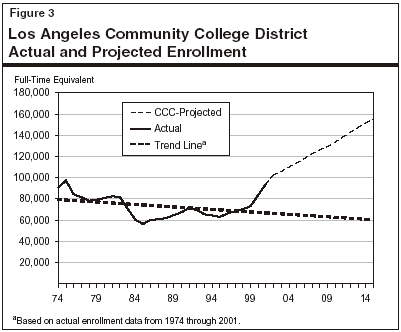
The community colleges chancellors office prepares projections annually of enrollment trends at each district, and the districts use these projections to justify construction of new buildings. These projections, however, appear to significantly overstate future enrollment in many cases—and therefore may be overstating the need to construct some new facilities. To illustrate, Figures 2 and 3 show enrollment history and projections for two large community college districts. The solid black line in each figure shows the actual enrollments in the district from 1974 to 2001. The long-dash line shows the enrollment the chancellor's office projected for 2002 through 2015. The short-dash line shows the historical trend line.

For example, in Figure 2 it can be seen that the Long Beach Community College District (CCD) had its peak enrollment in 1975 of about 19,000 full-time equivalent (FTE) students and has not had enrollment above that level since then. The trend line for the district, based on the actual enrollments between 1974 and 2001, shows a slight declining rate of enrollment, which would result in an enrollment of a little over 15,000 FTE students in 2015 (a 12 percent decline). The chancellor's office, however, projects an enrollment of over 27,000 FTE students in 2015—an increase of almost 55 percent. While there could be social or demographic reasons behind this projection—for example, a rapid increase in the area's high school population—we are not aware of what they could be in this particular case. The chancellor's office projection seems to be based largely on a recent slight uptick in enrollment. As Figure 2 shows, however, this increase can be viewed as a typical short-run fluctuation in the district's long-run "flat" enrollment picture.

There are similarly significant differences between the chancellor's office projections and the trend line for the Los Angeles Community College District—and a number of other districts we have examined. This raises a question whether the chancellor's office is using reasonable methods to project district enrollments. Since it is important for the Legislature to have accurate enrollment projections when making decisions about funding construction of new facilities for community colleges, we recommend the Legislature adopt supplemental report language directing the community colleges chancellor's office to examine enrollment projection methods to see if there are improvements that might be made and to report to the Legislature on its findings and planned improvements by November 1, 2004.
We recommend the Legislature delete $1,038,000 for development of preliminary plans for the Joint Use Instructional Facility for the City College of San Francisco campus and recognize a reduction of future costs of $26,355,000 because the enrollment projections used to substantiate the need for the building are not justified, campus instructional facilities are underutilized, and the Legislature needs more information about the district's joint use agreement with California State University, San Francisco. (Delete $1,038,000 from Item 6870-301-6028[43].)
The budget includes $1,038,000 for development of preliminary plans for a 73,155 assignable square feet instructional building at City College of San Francisco (CCSF). The building is proposed to be used by both CCSF and California State University (CSU) San Francisco (CSUSF) for teacher preparation, early childhood education, community health, and other multidisciplinary programs. Figure 4 shows how this $39.1 million project is proposed to be funded by the district and the state. The district proposes to provide $11,695,000 for the project. Although CSUSF is proposed to partially utilize the building, CSU will not provide funds for the project.
|
San Francisco CCD:
City College of San Francisco, |
|||
|
(In Thousands) |
|||
|
Phase |
State |
District |
Phase
Total |
|
Preliminary
plans |
$1,038 |
$391 |
$1,429 |
|
Working
drawings |
982 |
366 |
1,348 |
|
Construction |
24,514 |
9,738 |
34,252 |
|
Equipment |
859 |
1,200 |
2,059 |
|
Totals |
$27,393 |
$11,695 |
$39,088 |
The types of space proposed to be included in the building are shown in Figure 5.
|
San Francisco CCD:
City College of San Francisco, |
|
|
Type |
Asf |
|
Teaching
laboratories |
32,455 |
|
Other |
14,515 |
|
Classrooms |
13,100 |
|
Offices |
8,735 |
|
Library |
2,900 |
|
Audio
visual/television |
1,450 |
|
Total |
73,155 |
Our concerns with this project are that the enrollment projections the district has provided to substantiate the need for the project are not justified, campus instructional facilities are underutilized, and there is insufficient information to show that CSUSF is committed to joint use of the facility. These are discussed below.
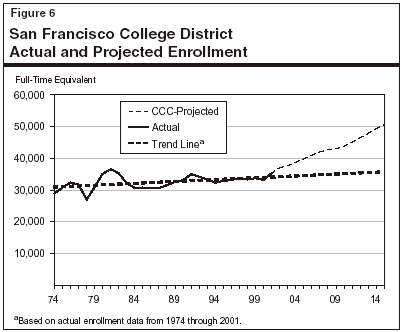
Enrollment Projections Not Justified. The community colleges chancellor's office prepares projections of enrollment trends for all districts. The San Francisco district relies on these projections in explaining why it believes this project is needed. We find these projections to be overly optimistic. The chancellor's office projections show enrollment in the San Francisco Community College District (SFCCD) increasing to almost 51,000 FTE students by 2015—a 43 percent increase over the actual enrollment in 2001. However, enrollment growth of this magnitude is inconsistent with the enrollment trend for the district over the last 25 years—and with population projections for San Francisco County and projections of K-12 enrollment in the county.
In the last 25 years, enrollment in the SFCCD has never exceeded 37,000 FTE students. Figure 6 shows the actual enrollment from 1974 to 2001, and the projection prepared by the chancellor's office indicating enrollment growing rapidly over the next decade. For comparison purposes, we show in Figure 6 the district's enrollment trend line. This shows the average growth rate based on actual experience over the last 25 years, and indicates what enrollment would be in the out-years if that trend persisted. It shows that enrollment would be less than 37,000 FTE students in 2015, much lower than the almost 51,000 FTE students the chancellor's office predicts for the district.

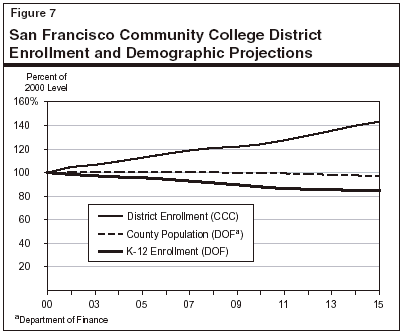
The trend line estimate may even overstate likely future enrollment in the district. There are two key factors that could cause the district's enrollment growth rate to increase substantially: (1) a rapidly growing local population or (2) rapid growth in enrollment in local K-12 schools. But neither of these situations is the case in San Francisco County. As Figure 7 shows, the Department of Finance projects the general population of the county will decline slightly (from 787,500 to 763,880—a difference of about 3 percent) between 2000 and 2015, and that the K-12 student enrollment in the county will decline from about 61,700 to 51,300, a 17 percent decrease. (Adjacent counties have similarly static populations and in any case do not supply many students to the SFCCD). These estimates indicate that the district's enrollment is more likely to decline over the next decade.

Campus Instructional Facilities Are Underutilized. The campus reports that it only utilizes its classroom stations (typically, a desk) about 81 percent of the number of hours per week required by current state utilization standards, and teaching laboratory stations about 92 percent. This means the campus could accommodate about 10 percent or more students just by utilizing its instructional facilities the number of hours per week required by current state utilization standards. This could allow about 1,700 FTE additional students to be accommodated each year.
In addition to not utilizing its classrooms and teaching laboratories as many hours per week as required by current state utilization standards, campus instructional facilities are underutilized during the summer term. The campus reports it enrolls only about 4,000 FTE students during summer term, compared to about 17,000 FTE students during fall and spring terms. If campus instructional facilities were utilized year-round at the number of hours per week required by current state utilization standards, several thousand more students might be accommodated without the need to construct new buildings.
Joint Use Agreement Unclear. The information the community college district has provided in support of this project does not demonstrate a commitment by CSUSF to deliver programs in this facility. There is little to explain what specific classes will be offered in the building by the two segments and how much space each will occupy. This is important information for the Legislature to have because if CSUSF is going to deliver courses in a new building at the CCSF campus, it reduces the need to construct instructional space at the CSUSF campus. The SFCCD indicates the joint use nature of the proposed building is part of its justification, but the information provided does not indicate the nature and extent of CSUSF's commitment to use of the building. Without clear commitments from both institutions, the Legislature has no basis to authorize the project as a joint use facility.
Because the project is not justified based on enrollment growth, existing instructional facilities are underutilized, and there is insufficient information about CSUSF's commitment to deliver programs at the proposed building, we recommend the Legislature delete the project. This would result in savings of $1 million from the budget for preliminary plans and recognize a reduction of $27.4 million of future costs. This will make over $28 million available for other high priority projects elsewhere in higher education.