Analysis of the 2005-06 Budget BillLegislative Analyst's Office
|
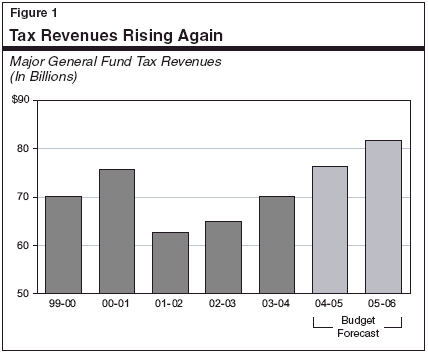
After falling sharply early in the decade, revenues are on the rise once again (see Figure 1). The administration assumes that General Fund tax receipts will increase by 8.7 percent in the current year and by 7 percent in 2005-06. These gains are indicative of a healthy expansion in profits, sales, and personal income in California. In this Part, we provide background information relating to the revenue outlook, discuss recent revenue developments, summarize the budget's revenue projections, and present our own revenue forecast.
The 2005-06 Governor's Budget projects that California's state government will receive nearly $107.6 billion in revenues during the budget year, a 7.3 percent increase from the current year. These revenues are deposited into either the General Fund or a variety of special funds. Figure 2 shows that:
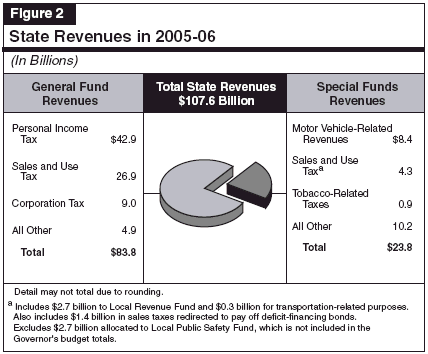
As the figure shows, some revenues, such as sales taxes, support both the General Fund and special funds.
Sources of General Fund Revenues. Figure 2 indicates that about 94 percent of total General Fund receipts are attributable to the state's "big three" taxes—the personal income tax (PIT), the sales and use tax (SUT), and the corporation tax (CT). The remainder are related to a variety of smaller taxes (including insurance, tobacco, and alcoholic beverage taxes), fees, investment earnings, and various transfers from special funds.
Targeted revenue increases and related policy-related changes adopted with the 2004-05 budget will increase revenues by about $593 million in 2004-05 and $284 million in 2005-06. Figure 3 shows that the main provisions were a two-year suspension of the teachers' tax credit; a change in the application of the use tax on purchases of vessels, aircraft, and certain vehicles; and a tax amnesty program.
|
Figure 3 2004-05 and 2005-06 Revenue Measures |
|||
|
(In Millions) |
|||
|
|
Fiscal Impact |
||
|
2004-05 Revenue Measures |
2004-05 |
2005-06 |
2006-07 |
|
Personal Income Tax |
|
|
|
|
Teacher tax credit: two-year suspension |
$210 |
$180 |
— |
|
Natural Heritage Preservation Tax Credit: |
10 |
9 |
$4 |
|
Tax amnesty program |
150 |
-30 |
-5 |
|
Sales and Use Tax |
|
|
|
|
Vehicle, vessel, and aircraft use tax (sunsets |
$26 |
$35 |
— |
|
Retain sales tax revenues on gasoline in |
128 |
— |
— |
|
Tax amnesty program |
11 |
62 |
-$37 |
|
Corporation Tax |
|
|
|
|
Tax amnesty program |
$50 |
$20 |
$15 |
|
Other |
8 |
9 |
7 |
|
Total, 2004-05 Revenue Measures |
$593 |
$284 |
-$16 |
|
2005-06 Revenue Measures |
|
|
|
|
Personal Income Tax |
|
|
|
|
Tax Gap |
— |
$22 |
$29 |
|
Abusive Tax Shelters |
— |
28 |
39 |
|
Corporation Tax |
|
|
|
|
Tax Gap |
— |
$12 |
$15 |
|
Abusive Tax Shelters |
— |
15 |
21 |
|
Sales and Use Tax |
|
|
|
|
Retain sales tax revenues on gasoline in |
— |
— |
$216 |
|
Total, 2005-06 Revenue Measures |
— |
$77 |
$320 |
In 2005-06, the Governor's budget does not include any new state tax proposals. It would, however, eliminate the Senior Citizens' Property Tax Assistance Program and reduce the Senior Citizens' Rental Assistance Program. (These proposals show up as expenditure reductions for tax relief and are discussed in the "General Government" chapter of our Analysis of the 2005-06 Budget Bill.) The budget also proposes additional resources for tax compliance initiatives (see discussion in the shaded box), which are expected to generate about $104 million in additional receipts in 2005-06. Finally, it proposes to retain sales taxes on gasoline in the General Fund, instead of transferring them to transportation special funds, as required by current law.
Tax Agency Enforcement and Compliance MeasuresThe 2005-06 budget contains funding for two programs related to the enforcement and compliance of personal income and corporation taxes. The budget anticipates these efforts will result in additional state revenue as discussed below. Abusive Tax SheltersCertain methods of sheltering income from taxation have been identified by the Internal Revenue Service or the Franchise Tax Board (FTB) as violating the spirit or intent of the tax laws. These so-called abusive tax shelters typically have no underlying economic or business purpose other than tax reduction. In 2003, the Legislature approved a voluntary compliance initiative for taxpayers who had participated in abusive tax shelters. Under the initiative, such taxpayers could avoid various penalties by paying their full tax liability. The program resulted in $1.4 billion in tax payments. In the 2004-05 budget, FTB received funding for an abusive tax shelter task force, which is dedicated to enforcement and compliance activities in this area. Proposal. The budget proposes $1.8 million in additional funding for FTB's abusive tax shelter task force, which is expected to result in additional revenues of $43 million in the budget year and $60 million in 2006-07. Tax GapThe "tax gap" is the difference between tax liabilities owed to the state and the revenues that are actually collected. The tax gap is due to noncompliance on the part of taxpayers, and typically results from understating income, underpaying taxes, or simply not filing a tax return. The FTB has estimated California's current income tax gap at about $6.5 billion. Proposal. The 2005-06 budget includes an additional $8.6 million to FTB for tax enforcement and compliance measures. The components of this proposal are designed to target specific areas of non-compliance that contribute to the state tax gap. These tax gap-related reporting and auditing activities are expected to generate additional revenue of $34 million in the budget year and $44 million in 2006-07.
|
Figure 4 shows the budget's revised estimate of General Fund revenues for the prior year and current year, as well as its forecast for 2005-06. (The revenue totals shown in this Part do not include the deficit financing bond proceeds used in 2003-04 or proposed in 2005-06. In "Part I," we display these proceeds separately in our estimates of the General Fund budget condition.)
|
Figure 4 Summary of the Budget’s |
|||||
|
(Dollars in Millions) |
|||||
|
|
|
2004-05 |
2005-06 |
||
|
Revenue Source |
Actual 2003-04 |
Estimated Amount |
Percent Change |
Projected Amount |
Percent Change |
|
Taxes |
|
|
|
|
|
|
Personal income |
$36,399 |
$39,527 |
8.6% |
$42,895 |
8.5% |
|
Sales and use |
23,847 |
25,168 |
5.5 |
26,947 |
7.1 |
|
Corporation |
6,926 |
8,678 |
25.3 |
9,015 |
3.9 |
|
Insurance |
2,115 |
2,230 |
5.4 |
2,300 |
3.1 |
|
Other |
849 |
662 |
-22.0 |
454 |
-31.5% |
|
Other Revenues, Transfers, and Loans |
|||||
|
Tribal gaming revenues |
— |
$16 |
— |
$34 |
112.5% |
|
Other revenues |
$3,913 |
1,623 |
-58.5% |
1,584 |
-2.4 |
|
Transfers related to |
— |
— |
— |
600 |
— |
|
Other transfers and loans |
713 |
315 |
-55.8 |
-56 |
— |
|
Totals |
$74,762 |
$78,219 |
4.6% |
$83,772 |
7.1% |
Prior-Year Estimate. The budget estimates that 2003-04 General Fund revenues and transfers totaled $74.8 billion, a 4.8 percent increase from 2002-03. The administration's estimate is up $192 million from the level assumed when the 2004-05 budget was enacted.
Current-Year Estimate. The January mid-year forecast for 2004-05 assumes that General Fund revenues and transfers will be $78.2 billion, a 4.6 percent increase from the prior year. This is up by $968 million from the estimate in the 2004-05 Budget Act. The revision is the net result of two offsetting factors:
2005-06 Forecast. The budget forecasts that General Fund revenues and transfers will be $83.8 billion in the budget year, a 7.1 percent increase from 2004-05. The major taxes are projected to increase by 7 percent, or about one percentage-point faster than statewide personal income.
Figure 5 shows our projections of General Fund revenues for 2004-05 through 2006-07. Our projections are based on our economic and demographic forecasts presented in "Part II" and reflect the impacts of the Governor's revenue-related policy proposals. Our revised estimates are significantly higher than the administration's forecast, mainly because of stronger-than-expected 2004 year-end tax collections.
|
Figure 5 Summary of the LAO’s |
||||||
|
(Dollars in Millions) |
||||||
|
|
2004-05 |
2005-06 |
2006-07 |
|||
|
Revenue Source |
Amount |
Percent Change |
Amount |
Percent Change |
Amount |
Percent Change |
|
Taxes |
|
|
|
|
|
|
|
Personal income |
$40,627 |
11.6% |
$43,200 |
6.3% |
$45,720 |
5.8% |
|
Sales and use |
25,288 |
6.0 |
26,850 |
6.2 |
28,210 |
5.1 |
|
Corporation |
8,928 |
28.9 |
9,370 |
5.0 |
9,820 |
4.8 |
|
Insurance |
2,220 |
5.0 |
2,287 |
3.0 |
2,355 |
3.0 |
|
Other |
660 |
10.8 |
443 |
-32.9 |
443 |
— |
|
Other Revenues, Transfers and Loans |
||||||
|
Tribal gaming revenues |
$16 |
— |
$34 |
112.5% |
$50 |
47.1% |
|
Other revenues |
1,676 |
— |
1,810 |
8.0 |
1,861 |
2.8 |
|
Transfers related to |
— |
— |
600 |
— |
— |
— |
|
Other transfers and loans |
219 |
-69.3% |
-56 |
— |
-37 |
-34.8 |
|
Totals |
$79,634 |
6.5% |
$84,537 |
6.2% |
$88,423 |
4.6% |
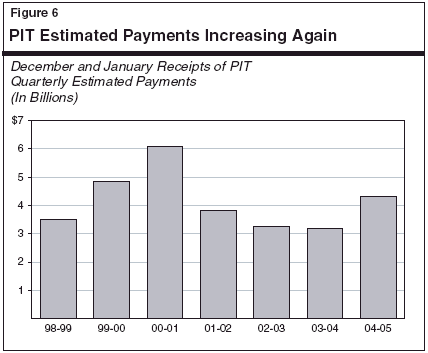
Each year, the administration completes its economic and revenue projections sometime in early December—prior to when large year-end tax payments are due to the state. This is significant because the quarterly estimated payments due in December (from corporations) and January (from individuals) can fluctuate a great deal, and can provide an early indication of the strength or weakness in final payments that will be remitted in March and April.
As shown in Figure 6, prepayments from individual taxpayers were particularly strong near the end of 2004, increasing by over 35 percent from the previous year. The growth was about $500 million greater than assumed by the administration. Combined with smaller gains from other tax sources, the gains boosted cumulative cash receipts through late January to about $800 million above the administration's budget estimate.
Why the Strength? We believe that stronger-than-expected revenue gains are related to stock market-related capital gains and business earnings. To the extent that investment income and business earnings accrue to higher income taxpayers, the strength in these areas are subject to high tax PIT rates, and thus have a magnified effect on revenues. While the increases are welcome, they are also cyclical in nature, and thus may not fully continue into 2005 and beyond.
We project that revenues will exceed the administration's January budget estimates by about $1.4 billion in the current year and $766 million in 2005-06—for a two-year increase of $2.2 billion. Slightly less than $2 billion of the two-year gain is related to our estimate of higher tax receipts. The remainder is related to our inclusion of $294 million in Medi-Cal quality improvement fees. As discussed in more detail below and in the accompanying Analysis of the 2005-06 Budget Bill, the administration omitted these fee-related revenues from its estimates.
We specifically forecast that:
As indicated above, the great majority of General Fund revenues are attributable to the state's three major taxes—the PIT, SUT, and CT. The performance of these taxes will have a major influence on the overall revenue outlook. In the following sections, we discuss in more detail recent developments and the outlook for each of these revenue sources.
We project that the PIT will account for 51 percent of total General Fund revenues in 2005-06. Although this share is significantly below the peak reached in 2000-01 (57 percent), the PIT remains by far the largest source of state General Fund revenues. In general, the PIT is patterned after federal law with respect to reportable types of income, deductions, exemptions, exclusions, and credits. Under the PIT, taxable income is subject to marginal rates ranging from 1 percent to 9.3 percent, with the top rate applying to taxable income in excess of $80,692 for joint returns in 2004 (and one-half of that for taxpayers filing single returns).
Over the past two decades, personal income in California has become increasingly concentrated. At the peak of the stock market boom in 2000, the top 5 percent of returns accounted for over 40 percent of adjusted gross income (AGI) reported on California personal income taxes. Under California's progressive PIT rate structure, these taxpayers accounted for over 70 percent of total PIT payments in the state. While these shares dropped following the stock market bust, the top 5 percent of taxpayers still account for over one-third of AGI and nearly two-thirds of PIT payments. The concentration of tax liabilities is significant because taxpayers at the top end of the income spectrum receive much of their income from such volatile sources as capital gains, stock options, and business earnings.
Recent History. Figure 7 shows the historical and forecasted levels of PIT liabilities. It shows that, after growing 8 percent in 2003, PIT liabilities jumped by a further 10 percent in 2004, the largest gain since 2000. The jump is nearly double the 5.6 percent increase in statewide personal income, as currently measured by the U.S. Bureau of Economic Analysis. The much larger gains in liabilities is likely related to strong growth in capital gains and business income. Business income is becoming an increasingly important component of AGI, as an ever-increasing number of companies file as S-corporations and limited liability corporations (whose income is largely taxable under the PIT—as opposed to under the CT).
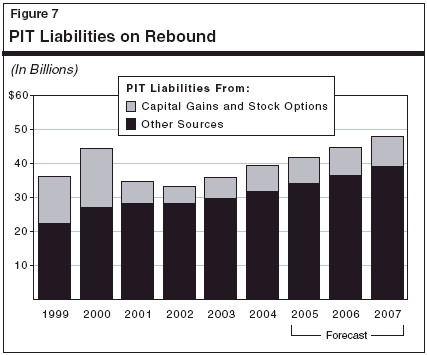
Forecast. We forecast that PIT revenues will continue to expand during the next two years, but at rates that are more consistent with underlying growth in statewide personal income. The main reason for the slowdown is that the two cyclical sources that boosted PIT liability growth in 2004—capital gains and business earnings—are projected to grow more modestly in 2005 and 2006 than in 2004. Specifically, we forecast that:
The slowdown in the growth rates in the above sources will be partly offset by a modest acceleration in ordinary wages (that is, wages excluding stock option income) growth next year. We specifically forecast that wage growth will accelerate from 5 percent in 2004 to about 5.5 percent in 2005 and 2006 reflecting improvement in wage and salary employment growth in the state.
Based on our estimated changes in PIT liabilities, we forecast that fiscal-year PIT receipts will total $40.6 billion in 2004-05, $43.2 billion in 2005-06 and $45.7 billion in 2006-07. Compared to the budget forecast, our current projection of PIT revenues is up by $1.1 billion in the current year and by a more modest $305 million in 2005-06. Our large current-year gain reflects the positive year-end cash trends discussed above. Our relatively smaller gain in the budget year reflects our view that a portion of the current-year increase is due to cyclical factors (that is, above average growth in business profits and capital gains) and is thus "one time" in nature relative to the administration's forecast.
The SUT is the General Fund's second largest revenue source, accounting for just under one-third of total revenues in 2004-05. The main SUT component is the sales tax, which is imposed on retail sales of tangible goods sold in California. Some examples of sales tax transactions include spending on clothing, furniture, computers, electronics, appliances, automobiles, and motor vehicle fuel. Purchases of building materials that go into the construction of homes and buildings are also subject to the sales tax, as are purchases of computers and other equipment used by businesses. Roughly 70 percent of the SUT is remitted by retailers, while the remaining 30 percent is directly paid by businesses who themselves consume or use the products being taxed. The largest exemption from the sales tax is for most food items consumed at home. The great majority of services are not subject to the sales tax.
The second component of the SUT—the use tax—is imposed on products bought from out-of-state firms by California residents and businesses for use in this state. With the exception of automobile purchases (which must be registered), out-of-state purchases are difficult to monitor, and the state is prohibited under current federal law from requiring most out-of-state sellers to collect the use tax for California. As a result, use tax receipts account for only a small portion of total SUT revenues.
The total SUT rate levied in California is a combination of several different individual rates imposed by the state and various local governments. These include:
Optional Local Rates. The final overall SUT rate component involves optional local tax rates, which local governments are authorized to levy for any purpose. These taxes, which require local voter approval, are normally levied on a countywide basis—primarily for transportation-related purposes. They are generally levied in 0.25 percent or 0.5 percent increments and cannot exceed 1.5 percent in total (except in San Francisco and San Mateo Counties).
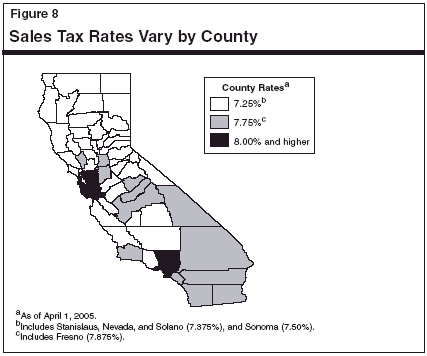
Combined SUT Rates. The combined state and local SUT rate varies significantly across California due to differences in the local optional rates that are levied (see Figure 8). The combined SUT rate currently ranges from 7.25 percent (for those counties with no optional rates) up to 8.75 percent (for Alameda County and the City of Avalon in Los Angeles County).
After falling in 2002, taxable sales started to rebound in 2003, and accelerated to an over 6 percent gain in 2004. As indicated in Figure 9, retail spending held up reasonably well during the recession and bounced back early in the ensuing recovery. In contrast, business-related sales were hit hard during the recession—as businesses sharply curtailed investment spending—and they took longer to recover.
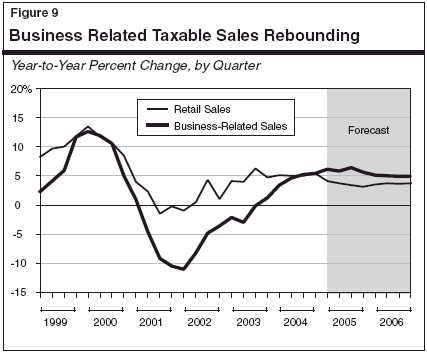
By 2004, we estimate that both categories were on the upswing, and this balanced growth contributed to the largest gain in the overall total since 1999.
Outlook—More Moderate Growth in 2005 and 2006. Looking ahead, we believe that total taxable sales growth will moderate to 5.7 percent in 2005 and further to 5.4 percent in 2006. The main reason for the slowdown is our expectation that—like the rest of the nation—household spending in California will ease some due to high consumer debt levels and rising interest rates. In contrast, we expect business spending to continue at a solid pace during the next couple of years.
Based on our forecast of taxable sales, we project that SUT receipts will total $25.3 billion in 2004-05, $26.9 billion in 2005-06, and $28.2 billion in 2006-07. Compared to the budget forecast, our SUT revenue estimate is up $120 million in the current year, but down $97 million in the budget year. Our estimates take into account changes passed with the 2004-05 budget affecting the application of the use tax, as well as the proposed retention of "spillover" revenues in the General Fund.
The CT is the third largest revenue source, accounting for 11 percent of total revenues in 2004-05. The tax is levied at a general rate of 8.84 percent on California taxable profits. Banks and other financial institutions subject to the CT pay an additional 2 percent tax, which is in lieu of most other state and local levies. Corporations that qualify for California Subchapter "S" status are subject to a reduced 1.5 percent corporate rate. In exchange, the income and losses from these corporations are "passed through" to their shareholders where they are subject to the PIT. Similarly, businesses that are classified as Limited Liability Companies pay a fee at the corporate level and their income and losses are passed through to their shareholders, where they are subject to the PIT.
Approximately two-thirds of all CT revenues come from multistate and multinational corporations. These companies have their consolidated U.S. income apportioned to California based on a formula involving the share of their combined property, payroll, and sales that is attributable to this state. California's CT allows for a variety of exclusions, exemptions, deductions, and credits, many of which are similar or identical to those provided under the federal corporate profits tax. Major examples include the research and development tax credit and net operating loss carryforward provisions, whereby companies can use operating losses incurred in one year as a deduction against earnings in subsequent years. Under legislation enacted in 2002, corporations were not able to use these losses to offset their income during 2002 and 2003. However, such deductions were allowed again beginning in 2004, and the percentage of losses which may be carried forward and deducted against future taxes jumps from 65 percent to 100 percent beginning for losses incurred in January 2005.
The key determinant of CT receipts is the strength of corporate profits reported on California tax returns by businesses. After falling in 2001 and most of 2002, California earnings rebounded in 2003 and then soared by over 20 percent in 2004 (see Figure 10). The recent boom reflects both intensive cost-cutting efforts by businesses throughout the economy, as well as a sharp rebound in sales and output last year. Profit growth was widespread, encompassing manufacturing, trade, services, real estate, and financial industries. The surge in oil prices also boosted earnings of refiners in the state.
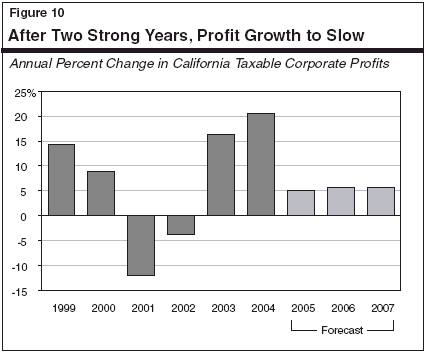
Looking ahead, we forecast that taxable California corporate profit growth will slow significantly, to around 5 percent annually in each of the following three years. The more moderate increases projected for the next two years reflect (1) rising wage costs (as companies step up hiring), (2) a slowdown in productivity growth (as normally occurs as an expansion ages), and (3) a more moderate pace of economic expansion, which will result in more moderate gains in company sales and output growth.
We forecast that CT receipts will be $8.9 billion in 2004-05, a 29 percent increase from the prior year, and $9.4 billion in 2005-06, a 5 percent increase. Our estimate for the current year is up by $250 million from the budget forecast, and our estimate for 2005-06 is above the budget estimate by $355 million.
The remaining 6 percent of total 2005-06 General Fund revenues and transfers consists primarily of taxes on insurance premiums, alcoholic beverages, and tobacco products. It also includes interest income and a large number of fees, loans, and transfers. We forecast that combined revenues from all of these other sources will fall from $7.5 billion in 2003-04 to $4.8 billion in 2004-05, and then rebound slightly to $5.1 billion in 2005-06. Of the annual totals, roughly $4.5 billion is related to ongoing taxes, fees, and interest earnings, and the remainder is related to various one-time factors. Key one-time factors include (1) $2.3 billion in 2003-04 associated with one-time proceeds of a tobacco securitization bond sale, (2) slightly over $600 million in 2005-06 from the assumed sale of a pension obligation bond authorized in the 2004-05 budget, (3) various other one time loans and transfers from special funds in each of the three years.
Quality Improvement Fees Omitted From Governor's Budget. The Legislature has approved three quality improvement fees on various health care service providers, thereby enabling the state to draw increased federal reimbursements. (This fee is discussed in more detail in the "Health and Social Services" chapter of the Analysis of the 2005-06 Budget Bill.) One of the fees has already been implemented and the budget assumes that the other two will receive federal approval in time for implementation in the budget year. The budget recognizes revenues from one of the proposed fees, but fails to recognize revenues from the other two—including one that has already been implemented. As a result, it has understated quality improvement fee-related revenues by $58 million in the current year and $236 million in the budget year. We believe that all three of the fees will be implemented, and thus have included the additional revenues in our estimates.
Estate Tax Phased Out. Our forecast includes the impact on the state of a provision included in the federal tax reduction package enacted in the spring of 2001 which is resulting in the phase out of revenues from California's "pick-up" estate tax. We specifically estimate that revenues from this tax will fall from $398 million in 2003-04 to $209 million this year, to zero in 2005-06 and thereafter.
Special funds revenues are related to a variety of sources:
Budget Forecast. As shown in Figure 11, the Governor's budget assumes that special funds revenues will total $22 billion in the current year (a 12 percent increase) and $23.8 billion in 2005-06 (an 8.2 percent increase). The large current-year increase is partly due to two key policy factors: (1) the diversion of about $1.3 billion of sales taxes to a special fund for repayment of the deficit-financing bonds approved by the voters in March 2004; and (2) a PIT surcharge for mental health programs. Ongoing revenues are expected to grow by roughly 4 percent, reflecting moderate increases in sales and vehicle registration taxes, and modest changes in most other taxes and fees.
|
Figure 11 Summary of the Budget’s Forecast for |
|||||
|
(Dollars in Millions) |
|||||
|
|
|
2004‑05 |
2005‑06 |
||
|
Revenue Source |
Actual 2003‑04 |
Estimated Amount |
Percent Change |
Projected Amount |
Percent Change |
|
Motor Vehicle Revenues |
|
|
|
|
|
|
License fees (in lieu)a |
$2,052 |
$2,144 |
4.5% |
$2,215 |
3.3% |
|
Fuel taxes |
3,325 |
3,357 |
1.0 |
3,441 |
2.5 |
|
Registration, weight, and |
2,342 |
2,672 |
14.1 |
2,775 |
3.9 |
|
Subtotals |
($7,719) |
($8,173) |
(5.9%) |
($8,431) |
(3.2%) |
|
Sales and Use Tax |
|
|
|
|
|
|
Realignment |
$2,443 |
$2,525 |
3.4% |
$2,699 |
6.9% |
|
Deficit financingb |
— |
1,167 |
— |
1,358 |
16.4 |
|
PTA |
217 |
406 |
87.0 |
275 |
-32.3 |
|
Subtotals |
($2,660) |
($4,098) |
(54.1%) |
($4,332) |
(5.7%) |
|
Other Sources |
|
|
|
|
|
|
Personal income tax |
— |
$254 |
— |
$683 |
168.9% |
|
Cigarette and tobacco taxes |
$964 |
946 |
-1.9% |
920 |
-2.7 |
|
Interest earnings |
126 |
101 |
-19.8 |
102 |
0.3 |
|
Other revenues |
8,715 |
8,794 |
0.9 |
9,761 |
11.0 |
|
Transfers and Loans |
-593 |
-334 |
-43.6 |
-389 |
16.4 |
|
Totals |
$19,591 |
$22,031 |
12.5% |
$23,839 |
8.2% |
|
Detail may not total due to rounding. |
|||||
|
a Includes loans from transportation funds to the General Fund. |
|||||
|
b Sales tax revenues used to pay debt service on deficit-financing bonds. |
|||||