Analysis of the 2006-07 Budget BillLegislative Analyst's Office
|
The Governor�s budget proposes total spending in 2006-07 of $122.9�billion, including $97.9�billion from the state�s General Fund and $25�billion from its special funds (see Figure�1). This total budget-year spending is $7.2�billion higher than current-year spending-an increase of 6.3�percent. Of total budget-year spending, General Fund spending accounts for about 80�percent. This proposed spending level translates into $3,268 for every man, woman, and child in California.
|
|
||||
|
Figure 1 Governor�s Budget Spending Totals |
||||
|
(Dollars in Millions) |
||||
|
|
|
|
Change |
|
|
|
2005‑06 |
2006‑07 |
Amount |
Percent |
|
Budget Spending |
|
|
|
|
|
General Fund |
$90,294 |
$97,902 |
$7,608 |
8.4% |
|
Special Fundsa |
25,400 |
25,024 |
-376 |
-1.5 |
|
Totals |
$115,693 |
$122,925 |
$7,232 |
6.3% |
|
|
||||
|
a Does not include Local Public Safety Fund expenditures of $2.8 billion in 2005‑06 and $2.9 billion in 2006‑07. These amounts are not shown in the Governor's budget. |
||||
|
Detail may not add due to rounding. |
||||
|
|
||||
Figure�2 shows the allocation of the proposed $122.9�billion of total state spending in 2006-07 among the state�s major program areas. Both General Fund and special funds expenditures are included in order to provide a meaningful comparison of state support among broad program categories, since special funds provide the bulk of support in some areas (such as transportation).
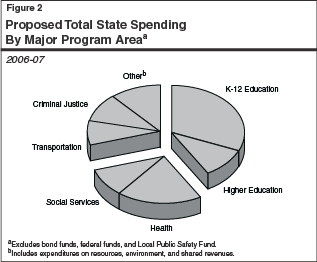
The figure shows that K-12 education receives the largest share of spending-31�percent of the total. (It also should be noted that K-12 education spending receives additional funding from local sources.) When higher education is included, education�s share rises to 42�percent. Health and social services programs account for 29�percent of proposed total spending, while transportation and criminal justice together account for roughly 18�percent. The �other� category (11�percent) primarily includes general-purpose fiscal assistance provided to local governments in the form of shared revenues.
Background. The General Fund is the main source of support for state programs, funding a wide variety of activities. For example, it is the major funding source for K-12 and higher education programs, health and social services programs, youth and adult correctional programs, as well as tax relief provided through the budget.
Proposed Spending. As shown in Figure�3, the Governor proposes General Fund spending of $97.9�billion for 2006-07, an increase of 8.4�percent, reflecting substantial growth in education, and more modest increases in most other areas. Specifically:
|
|
||||
|
Figure 3 General Fund Spending by Major Program Area |
||||
|
(Dollars in Millions) |
||||
|
|
|
|
Proposed 2006-07 |
|
|
|
Actual 2004-05 |
Estimated 2005-06 |
Amount |
Percent Change |
|
Education Programs |
|
|
|
|
|
K-12 Proposition 98 |
$30,863 |
$32,792 |
$36,403 |
11.0% |
|
Community Colleges Proposition 98 |
3,036 |
3,412 |
3,949 |
15.7 |
|
UC/CSU |
5,175 |
5,446 |
5,834 |
7.1 |
|
Other |
4,380 |
4,567 |
4,918 |
7.7 |
|
Health and Social Services Programs |
|
|
|
|
|
Medi-Cal |
$11,593 |
$13,197 |
$13,739 |
4.1% |
|
CalWORKs |
2,054 |
1,958 |
1,951 |
-0.4 |
|
SSI/SSP |
3,411 |
3,506 |
3,564 |
1.7 |
|
In-Home Supportive Services |
1,198 |
1,259 |
1,310 |
4.1 |
|
Other |
6,596 |
7,341 |
7,909 |
7.7 |
|
Corrections |
$6,968 |
$7,658 |
$8,081 |
5.5% |
|
Transportation |
$347 |
$1,686 |
$2,683 |
59.1% |
|
All Other |
$4,183 |
$7,473 |
$7,561 |
1.2% |
|
Totals |
$79,804 |
$90,294 |
$97,902 |
8.4% |
|
|
||||
General Fund spending for K-12 education and community colleges is proposed to increase by 11�percent and 16�percent, respectively. Total Proposition�98 spending from both state and local sources grows by somewhat less-8.4�percent for K-12 education and 12�percent for community colleges. The higher General Fund increase occurs because of the conclusion of a two-year $1.3�billion annual property tax shift from local governments to schools. This shift resulted in corresponding reductions in General Fund spending in 2004-05 and 2005-06. The Governor proposes to spend $1.7�billion more than required by the administration�s estimate of the Proposition�98 minimum guarantee in 2006-07 for a variety of purposes. In addition, new spending for Proposition�49 after school programs (totaling $426�million) is included in the budget for the first time.
University of California (UC) and California State University (CSU) funding increases by 7.1�percent. The Governor proposes that additional General Fund support be used to replace planned student fee increases in both segments.
Medi-Cal funding increases 4.1�percent. The unusually small growth rate is related to a technical budgeting shift of $340�million from Medi-Cal to the Department of Mental Health budget. Absent this shift, underlying growth in the Medi-Cal program is 7.5�percent.
In-Home Supportive Services (IHSS) spending would increase modestly, Supplemental Security Income/State Supplementary Program (SSI/SSP) spending would grow by less than 2�percent, and California Work Opportunity and Responsibility to Kids (CalWORKs) spending would decline. The budget reflects the two-year suspension of state cost-of-living adjustments (COLAs) adopted in the 2005-06 budget for CalWORKs and SSI/SSP grants. It further proposes that the �pass through� of the federal COLA to SSI/SSP recipients be delayed from April 2007 to July 2008.
Corrections spending rises 5.5�percent, reflecting (1) increases in inmate population, (2) added costs for various court settlement agreements, and (3) proposed new and expanded inmate and parolee programs.
Transportation receives a sharp increase in General Fund spending, mostly related to an early payment of $920�million toward a $1.4�billion Proposition�42 loan due in 2007-08.
The all other category increases modestly, partly due to assumed savings related to across-the-board reductions in state operations and a 1�percent reduction in each department�s personnel budget.
Background. Special funds are used to allocate certain tax revenues (such as gasoline and certain cigarette tax receipts) and various other income sources (including many licenses and fees) for specific functions or activities of government designated by law. In this way, they differ from General Fund revenues, which can be allocated by the Legislature among a variety of programs. About 35�percent of special funds revenues come from motor vehicle-related levies, another 18�percent comes from sales taxes, and the remainder comes from numerous sources; including a 1�percent surcharge on personal income taxes, and from tobacco taxes, charges, and fees.
Proposed Spending. In 2006-07, the Governor proposes special funds spending of $25�billion (see Figure�4). This is a 1.5�percent decrease from the current-year total. This decrease is related to a 6.5�percent drop in transportation spending and a 6.8�percent decline in resources-related spending. In both cases, the declines are related to one-time factors rather than underlying changes in policies. In the case of transportation, the budget assumes one-time expenditure in the current year of Indian gaming revenues. In the case of resources, the decline between the current year and budget year is related to the timing and magnitude of energy incentive payments administered by the Energy Resources Conservation and Development Commission, and capital outlay expenditures by the Department of Parks and Recreation.
|
|
||||
|
Figure 4 Special Funds Spending by Major Program Area |
||||
|
(Dollars in Millions) |
||||
|
|
|
|
Proposed 2006-07 |
|
|
|
Actual 2004-05 |
Estimated 2005-06 |
Amount |
Percent Change |
|
Transportation |
$6,772 |
$6,851 |
$6,406 |
-6.5% |
|
Local government subventions |
5,630 |
6,191 |
6,258 |
1.1 |
|
Resources related |
2,263 |
2,764 |
2,577 |
-6.8 |
|
Public Utilities Commission |
1,124 |
1,211 |
1,230 |
1.5 |
|
All Other |
6,404 |
8,383 |
8,553 |
2.0 |
|
Totals |
$22,192 |
$25,400 |
$25,024 |
-1.5% |
|
|
||||
It should be noted, that the budget�s special funds spending total for 2006-07 excludes expenditures of roughly $2.9�billion from the Local Public Safety Fund (LPSF). Such spending is also excluded from the current-year and prior-year totals.
Our view is that LPSF revenues are state tax revenues expended for public purposes, and should be counted. This treatment is consistent with how the budget treats other dedicated state funds, such as the Motor Vehicle License Fee Account (which, like the LPSF, is constitutionally dedicated to local governments) and the Cigarette and Tobacco Products Surtax Fund (Proposition�99), both of which the budget does include in its spending totals. However, although we believe that such spending does constitute state spending, we do not include it in our figures in order to facilitate comparisons with the budget.
In addition to the $123�billion of proposed 2006-07 spending from the General Fund and special funds, the budget also proposes $57�billion in spending from federal funds and another $2.7�billion from bond proceeds. If expenditures from bond proceeds and federal funds are included in total state spending, proposed 2006-07 spending exceeds $182�billion.
As noted above, about $57�billion in federal funds are proposed to be spent through the state budget in 2006-07. (This is about one-fourth of the roughly $200�billion in total federal funds allocated to California. The remaining three-fourths are allocated directly to local governments, businesses, or individuals within the state.) About $30�billion (53�percent) of the total federal funds in the budget are for various health and social services programs, such as Medi-Cal, CalWORKs, and IHSS. Education receives another $15�billion (26�percent) of the total (split fairly evenly between K-12 and higher education), and transportation is expected to receive $3.6�billion (6�percent). The remaining roughly $8.4�billion (15�percent) is spread across all other program areas.
Budgetary Treatment. Bonds are primarily sold by the state to finance large capital outlay projects, such as school facilities, water projects, and state buildings. From a budgetary perspective, the cost of bond programs is reflected when the actual debt-service payments (comprised of bond-related principal and interest payments) are made. For 2006-07, the budget proposes General Fund debt-service expenditures of $4.2�billion, of which $3.6�billion is for general obligation bonds and about $620�million is for lease-revenue bonds. About $65�million of the lease-revenue bond debt service is paid through Proposition�98.
Although this way of treating bonds makes sense from a budgetary standpoint, tracking bond fund expenditures themselves still is useful as an indication of the actual volume of �brick and mortar� activities that is taking place with respect to capital projects.
Spending of General Obligation (GO) Bond Proceeds. The January budget proposal estimates that the state will spend $2.7�billion in GO bond proceeds for capital projects in 2006-07. This is down sharply from the $11.8�billion in spending shown for the current year, and $5.6�billion in the prior year. The comparatively larger amounts in the current and prior years are related to the allocation of recently approved K-12 education bonds to specific school district projects.
Spending of Lease-Revenue Bond Proceeds. In addition to GO bonds, the state also uses lease-revenue bonds to finance the construction and renovation of capital facilities. Lease-revenue bonds do not require voter approval, and their debt service is paid from annual lease payments made by state agencies using the facilities financed by the bonds (funded primarily through General Fund appropriations). For 2006-07, the budget proposes $855�million in spending from lease-revenue bond proceeds for such purposes as construction of state buildings.
In addition to borrowing for capital outlay purposes, the state has undertaken significant borrowing in recent years to help address budgetary shortfalls. At the peak, the state had more than $25�billion in budget-related debt outstanding from private investors, schools, local governments, transportation, and other special funds. The amount of outstanding borrowing has subsequently fallen, and will continue to decline through the budget year under the Governor�s budget proposal (which includes prepayment of a transportation loan and some deficit-financing bonds). However, as Figure�5 shows, we estimate that even after these repayments, the state will be left with $20�billion in budget-related debt at the close of 2006-07. This consists of:
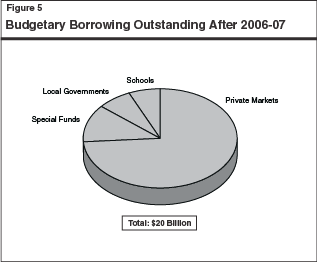
About $15�billion from private markets, including $8�billion in deficit-financing bonds, over $5�billion in tobacco-related bonds, and over $1�billion from other sources.
Around $2.4�billion from special funds, one-half of which is related to deferred Proposition�42 payments.
About $1.4�billion from noneducation local governments related to deferred mandate payments.
About $1.3 billion in settle-up payments owed to Proposition 98 education.
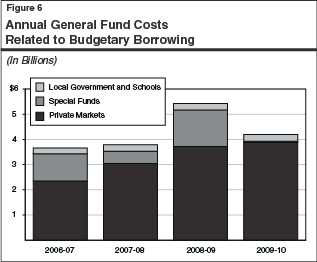
As shown in Figure�6, scheduled repayments of this budgetary borrowing will result in annual General Fund costs of $3.7�billion in 2006-07, rising to a peak of $5.4�billion in 2008-09. These amounts are included in our projections.
Background. In 1979, California�s voters established a state appropriations limit (SAL) when they approved Proposition�4. The SAL places an �upper bound� on the amount of tax proceeds that the state can spend in any given year, and grows annually by a population and cost-of-living factor. Most state appropriations are subject to SAL; however, certain appropriations are exempt-including those for subventions to schools and local governments, capital outlay, and tax relief. If actual tax proceeds exceed SAL over a two-year period, the excess must be divided among taxpayer rebates and Proposition�98 education funding.
Expenditures Projected to Be Well Below the Limit. Due to the downturn in the state�s economy and its adverse effects on the state�s revenues, expenditures supported by taxes fell during the early years of this decade. (While the state used borrowed funds to support spending in excess of revenues during this period, spending supported by borrowed funds does not count against SAL.) Although tax-supported spending has rebounded in recent years, a large gap still remains between the limit and spending subject to it. In 2005-06, appropriations subject to the limit are $15.2�billion below the limit, and in 2006-07, the gap grows to $15.9�billion. Part of the reason that spending remains so far below the limit is that a large portion of the expenditure increases in the current and budget years are in areas such as K-12 school district apportionments, which are exempt from the state�s limit.
Each year, the budget includes funds for cost-of-living adjustments, commonly referred to as COLAs. The purpose of these adjustments is to compensate for the adverse effects of inflation on the purchasing power of the previous year�s funding level. Existing law authorizes automatic COLAs for over two-dozen programs, mostly in the areas of K-12 education, social services, health, and trial courts. These are generally referred to as statutory COLAs. Other programs receive COLAs on a discretionary basis, through decisions arrived at in the annual budget process. The major General Fund COLAs in the 2006-07 proposed budget are shown in Figure�7.
|
|
||||
|
Figure 7 General Fund COLAs�2006-07 Governor�s Budget |
||||
|
(Dollars in Millions) |
||||
|
Program/Department |
COLA |
Statutory or Discretionary |
Funded |
2006‑07 |
|
Education |
|
|
|
|
|
Proposition 98 |
|
|
|
|
|
Apportionments |
5.18% |
Statutory |
Yes |
$1,689 |
|
Categorical programsa |
5.18 |
Statutory |
Yes |
875 |
|
Non-Proposition 98 K-12 Education |
|
|
|
|
|
Child nutrition programs |
5.18 |
Statutory |
Yes |
1 |
|
Higher Education |
|
|
|
|
|
University of Californiab |
3.0 |
Discretionary |
Yes |
81 |
|
California State Universityb |
3.0 |
Discretionary |
Yes |
76 |
|
Judicial Branch |
|
|
|
|
|
Judiciary and Trial Courtsc |
4.70% |
Statutoryd |
Yes |
$123 |
|
Health |
|
|
|
|
|
Medi-Cal |
|
|
|
|
|
County eligibility administratione |
3.75% |
Discretionary |
No |
� |
|
Long-term care rate adjustments |
Various |
Statutory |
Yes |
$94 |
|
Part B deductible increases |
Various |
Discretionary |
Yes |
20 |
|
Certain clinics |
2.9 |
Statutory |
Yes |
20 |
|
Managed Care plans |
Various |
Discretionary |
No |
� |
|
Department of Alcohol and Drug Programs |
|
|
|
� |
|
Drug Medi-Cal |
3.0 |
Statutory |
No |
� |
|
Department of Mental Health |
|
|
|
|
|
Mental Health Managed Care Program |
� |
Discretionary |
No |
� |
|
Department of Developmental Services |
|
|
|
|
|
Various regional center vendors |
3.0 |
Statutory |
Yes |
46 |
|
Social Services |
|
|
|
|
|
CalWORKs July 2006 |
3.75 |
Statutory |
No |
� |
|
SSI/SSP |
|
|
|
|
|
State |
3.75 |
Statutory |
No |
� |
|
Federal |
2.6 |
Statutory |
Delayed |
� |
|
Foster Care |
3.75 |
Discretionary |
No |
� |
|
State Departments |
|
|
|
|
|
Operations cost |
3.1 |
Discretionary |
Yes |
$88 |
|
Total |
|
|
|
$3,113 |
|
|
||||
|
a Most of the large categorical programs have statutory cost-of-living adjustments (COLAs). All of the statutory COLAs, and many of the discretionary COLAs, are proposed to receive funding. |
||||
|
b The Governor has a nonbinding compact with higher education that contains specified increases for cost-of-living and enrollment. |
||||
|
c The Judicial Branch is proposed to receive an adjustment based on the state appropriations limit growth factor. This factor encompasses both cost-of-living and population. |
||||
|
d Existing law limits the adjustment to the trial court program. The budget proposes to apply the adjustment to the entire branch, including the judiciary. |
||||
|
e The Governor proposes trailer bill language to freeze state participation in county costs for health and human services administration at the 2005-06 Budget Act level with future adjustments limited to caseload. |
||||
|
|
||||
State COLAs have several key features that are particularly important to understand from a budgetary perspective. In particular:
Not All Programs Get COLAs. As shown in Figure�7 and discussed below, some state programs do not receive either statutory or discretionary COLAs.
Different COLA�s Often Reflect Different Data Sources. For example, the COLA for the major social services programs is based on selected components of the California Consumer Price Index (food, rent, fuel, transportation, and clothing). In contrast, the COLA for K-12 education is based on a national price index-the U.S. gross domestic product (GDP) deflator for state and local government purchases-which measures costs associated with the compensation of government employees, their operations (including energy costs), and construction. Alternatively, the adjustment for the Trial Court Funding Program is the SAL adjustment factor, which is based on per-capita personal income and a weighted population factor. The SAL adjustment is not strictly a COLA, in that it encompasses both population and economic growth, in addition to price increases. The fact that different programs often have different COLAs means that the adjustment for inflation that they receive can vary.
COLAs Are Based on Inflation in the Preceding Year. While the precise measurement time frames used vary from one COLA factor to another, COLAs for a particular budget year are generally based on changes in the applicable price indexes that took place during the preceding fiscal year. For example, the COLA adjustments in the 2006-07 budget proposal are based on inflation that took place in 2005 and, in some cases, in early 2006. These time lags were built in so that enacted budgets could be based on actual, versus projected, price adjustments. As such, however, they do not compensate budgets for inflation currently being experienced.
Soaring Energy Prices From 2005 Are Affecting Next Year�s COLAs. The above-noted one-year time lag is currently of particular significance. This is because inflation in late 2005 was boosted by soaring energy and construction costs (the latter being a significant factor in the state and local deflator used for the education COLA). The increases in inflation that occurred in the first half of this fiscal year are translating into large increases in COLAs for 2006-07. In particular, the K-12 education COLA is estimated in the budget to be 5.18�percent, but we now estimate it will be an even higher 5.8�percent. Likewise, we expect inflation to slow in 2006. This slowdown, however, will not be reflected in smaller state COLAs until 2007-08.
As indicated in Figure�7 and noted above, the budget proposes COLAs for some areas, but not others. Programs receiving COLAs include:
K-12 and community college education, where general apportionments and most categorical programs receive a 5.18�percent statutory COLA.
UC and CSU, which receive 3�percent COLAs. These increases are consistent with the Governor�s compact with these two higher education segments.
The judicial branch, which receives a 4.7�percent increase, based on the growth in the SAL adjustment factor. The administration is proposing that the statutory COLA currently being provided to trial courts be expanded to cover the state judiciary.
Selected health programs, particularly long-term care providers and regional center vendors.
Selected state operations, which receive various price increases to cover nonwage costs.
COLAs Not Provided for Social Services and County Administration. The budget provides no COLAs for CalWORKs, SSI/SSP, foster care, or child welfare services. Regarding CalWORKs and SSI/SSP, the budget reflects actions taken in the 2005-06 budget which suspended the statutory COLAs in these two programs, and delayed the pass through of the federal SSI/SSP COLA for three months. The new budget proposal would further delay the pass-through of the federal SSI/SSP COLA until the end of 2007-08. Finally, the budget does not provide COLAs for county administration of health or social services programs.
Total Spending. Figure�8 shows total state spending over the ten-year period 1996-97 through 2006-07 (as proposed), and breaks down this spending according to General Fund and special funds spending. It indicates, for example, that total spending grows over this period from $62.4�billion to $122.9�billion.
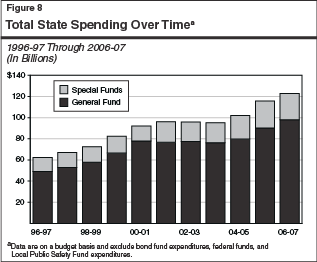
Figure�9 shows cumulative percent changes in various measures of state spending over the past ten years. It indicates that total state spending increased by over 50�percent between 1996-97 and 2001-02, reflecting funding increases in education, health, and a variety of other areas in the budget. Spending then flattened for the next two years, as the state reduced program spending and deferred costs to help cope with the major fiscal imbalances that occurred following the 2001-02 revenue downturn. Spending then started growing once again in 2004-05, and would increase further in 2005-06 and 2006-07 under the Governor�s proposal. Under the budget plan, total spending over the entire ten-year period would about double, reflecting an average annual growth rate of roughly 7�percent.
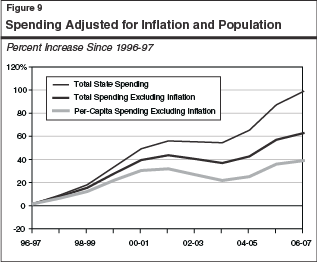
Real and Real Per-Capita Spending. Part of the spending growth discussed above is related to the effects of a growing population and rising prices over time. Figure�9 shows total state spending after adjusting for these factors. It indicates that:
After adjusting for inflation, real spending has grown by a bit over 60�percent over the entire ten-year period, or an annual average growth rate of roughly 4.9�percent.
Real per-capita spending-which adjusts for both inflation and population growth-would increase by about 37�percent over the period under the Governor�s plan, for an average annual rate of 3.2�percent. Since 2003-04, however, the rate of growth has averaged 4.6�percent.
Spending Relative to the State�s Economy. Figure�10 shows how state spending has varied over recent years as a percentage of total California personal income (which is a broad indicator of the size of the state�s economy). From 1996-97 through 2001-02, total state spending increased steadily as a share of personal income-from 7.5�percent to 8.4�percent. As shown in the figure, growth in General Fund spending accounted for nearly all of this increase.
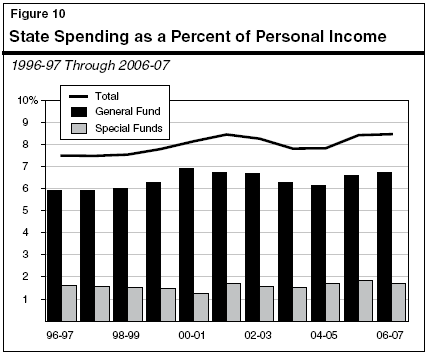
After 2001-02, however, total state spending as a percentage of personal income reversed direction, and dropped to below 8�percent in both 2003-04 and 2004-05. This reduction reflects both budget savings and numerous one-time funding shifts, deferrals, and other forms of budgetary borrowing. The one-time factors included an accounting change to Medi-Cal, increased federal funds (which temporarily offset state spending), savings related to a restructuring of debt-service payments, and a two-year shift of property taxes from local governments to schools (resulting in savings to the General Fund). The spending totals for 2004-05 also reflect a $2�billion offset related to the deficit-financing bonds authorized by the voters in March�2004.
The ratio of total state spending to California personal income under the Governor�s budget plan would jump back up to over 8�percent in both 2005-06 and 2006-07, as various temporary budget savings expire, some debt obligations are prepaid, and spending on education and other state programs is increased. The 2006-07 ratio would be 8.5�percent-the highest in the past ten years.