California Travels:
Financing Our Transportation
Legislative Analyst
|
|
California Travels:
|
| Elizabeth G. Hill, Legislative Analyst |
|
California's transportation system is currently a major
concern among policymakers and for good reason. According to a recent study, in
1999 California had the dubious distinction of being home to three of the ten
most congested urban areas in the nation; no other state is home to more than
one. This congestion harms the state's quality of life and hampers the movement
of people and goods. In addition to congestion, the condition of our highways
and local streets and roads has been deteriorating in recent years, resulting
in higher repair costs as maintenance is deferred to future years. State funding
for certain transit improvements is also in short supply.
What is being done to address these problems? What are the fund sources for
transportation and how much money is currently available? How are these funds
distributed? Who decides how transportation dollars are spent? This publication
seeks to answer these and other related questions in an effort to help those
interested in finding solutions to our transportation challenges.
This report was prepared by Rebecca
J. Long and Jason A. Weller
under the supervision of Dana Curry.
This report and others, as well as an E-mail subscription service, are available
on the LAO's internet site at http://www.lao.ca.gov.
For information about this report call Ms. Long/Mr. Weller at (916) 445-5921. The LAO is located at 925 L Street, Suite 1000, Sacramento, CA 95814.
• Demand for driving has consistently outpaced population
growth, as well as growth in vehicle registration and licensed drivers over the
last decade. The increase in driving is greatest on urban highways.
• From 1988 to 1998, California's population increased by approximately
18 percent. Yet, vehicle miles traveled (VMT), the best measure of how
much people are driving, grew by about 30 percent or 24 billion miles
in urban areas on the state highway system, and about 21 percent overall.
• Growth in driving far outpaced growth in the registered vehicles (approximately
7 percent) and growth in licensed drivers (approximately 9.5 percent).
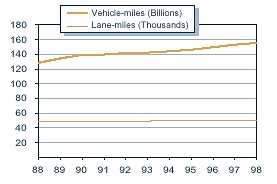
• Supply, on the other hand, as measured in terms of
freeway lane miles, has increased by about 1 percent over the last decade.Today,
California has about 49,000 lane miles of highways, maintained and operated by
the California Department of Transportation (Caltrans). An additional 310,000
lane miles of local streets and roads are maintained and operated by cities and
counties.
• About 925 lane miles of the state highway system consists of high occupancy
vehicle (HOV) lanes which are generally restricted to vehicles with two or more
(and in some cases three or more) occupants during peak hours in order to encourage
carpooling.
• Southern California also has about 80 miles of toll lanes, some of which
offer variable tolls depending on the level of congestion in the lane.
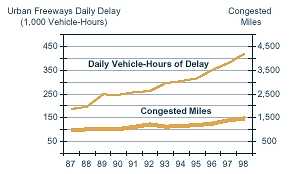
• The imbalance between supply and demand for the state
highway system has caused vehicle hours of delay on urban freeways to more than
double from approximately 197,000 hours per day in 1988 to about 418,000 hours
per day in 1998.
• In 1998, approximately 40 percent of the state's urban freeways
(approximately 1,470 miles) were congested (defined as occurring when vehicles
are traveling at 35 mph or less during peak commute periods on a typical weekday)
up from 27 percent (approximately 1,020 miles) in 1988.
• According to Caltrans' estimates for 1998, congestion on urban highways
costs Californians $7.8 million per day (or about $2.8 billion per
year) in wasted time and excess fuel.
• This delay also has negative environmental consequences, resulting in
an estimated 418 additional tons of emissions per day.
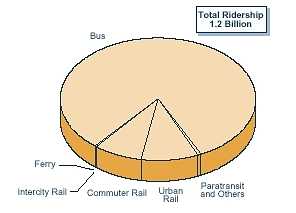
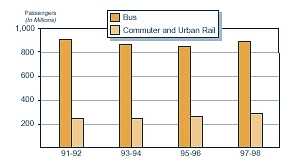
• In 1997-98, over 1.2 billion passenger trips were made on various modes of mass transportation, including bus, rail, and ferry.
• About 82 percent of these trips were on buses.
• Rail transportation constituted about 18 percent of total mass transportation ridership during 1997-98. The bulk of rail travel was on commuter and urban (light) rail systems.
• As for the remaining modes, about 0.5 percent of statewide passenger
trips were on paratransit services. Approximately 0.2 percent of these trips
were on ferries.
1991-92 Through 1997-98
• In 1997-98, there were 215 transit agencies statewide that operated
public transportation bus fleets. These fleets included buses that traveled
on fixed routes and fixed schedules, as well as paratransit vehicles that provided
services to the elderly and disabled communities.
• As for rail transportation, there were nine commuter and urban rail
operators around the state in 1997-98.
• Since 1991-92, total ridership for bus and rail have remained relatively
constant. Over the period, bus riders have decreased while commuter and urban
rail passengers have increased.
Return to California Travels Table of Contents