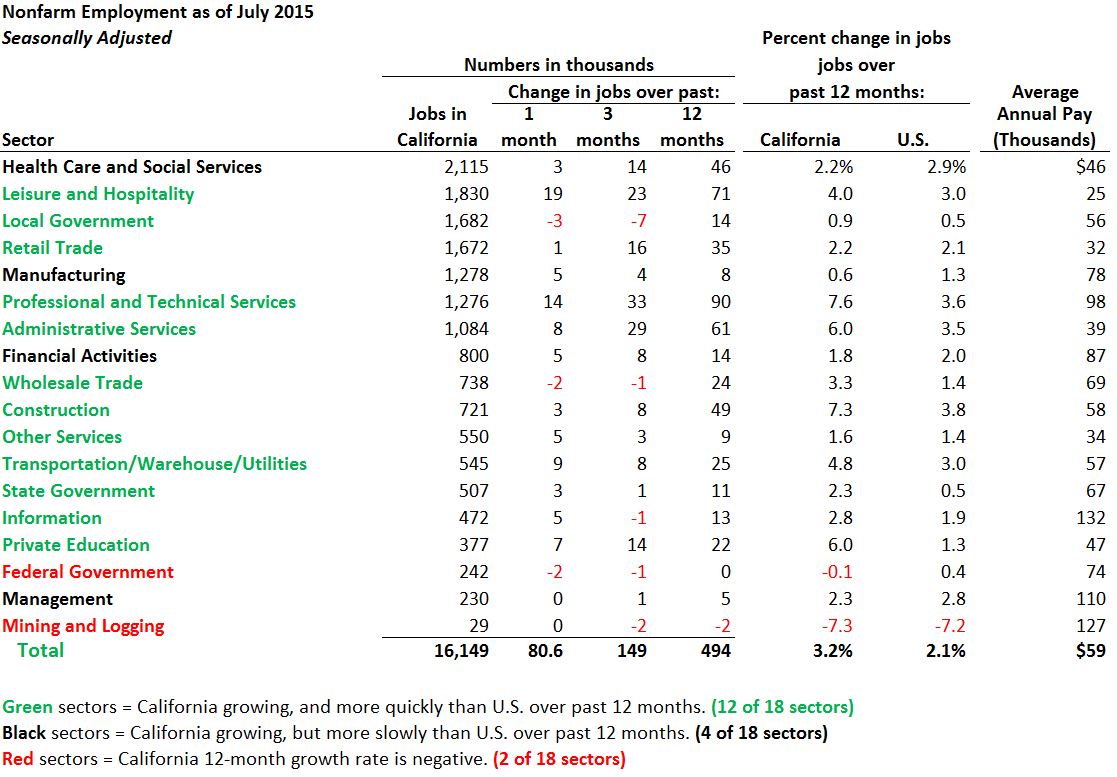
The U.S. Bureau of Labor Statistics (BLS) released summary state jobs data this morning for July 2015. Later, the state Employment Development Department (EDD) released its monthly data for July. Each month, we track California's seasonally-adjusted nonfarm payroll employment growth across 18 economic sectors (described here). As shown below, over the past 12 months, California's job growth has surpassed the nation as a whole in 12 of those 18 sectors, according to EDD data for California and BLS data for the U.S.

Job Growth
Over 80,000 New Jobs in July, According to Government Surveys. According to BLS, on a seasonally-adjusted basis, California's economy created a net 80,700 jobs in July, a strong 0.5% monthly growth rate. (The BLS July job growth total [80,700] differs slightly from EDD's [80,600].) The data shows that most of the core sectors driving California's economy in the long run have been growing strongly. EDD data, for example, shows that the high-paying, technology-focused professional and technical services sector continued its torrid rate of growth in California in July, with around half of the month's job gains in that sector resulting from new consulting jobs. Leisure and hospitality employers did well in July, and the construction industry continued to post job gains.
Future revisions easily could reduce the strong July job growth number, but, setting aside the month-to-month noise in the data, California's job growth over the last year has been quite healthy.
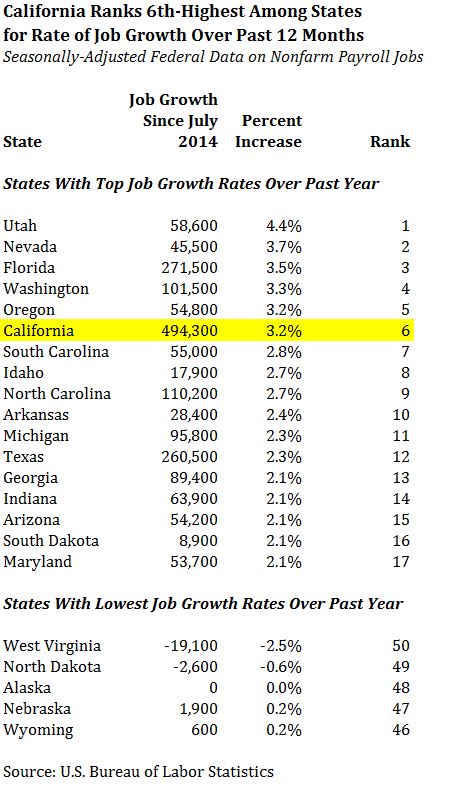
Faster Job Growth Than the U.S. California has been creating jobs at a faster pace than the nation. Over the past 12 months, California has gained 494,300 jobs, up 3.2%. This growth rate ranked 6th highest among the 50 states, according to BLS (trailing Utah at 4.4%, Nevada at 3.7%, Florida at 3.5%, Washington at 3.3%, and Oregon at 3.2%), as shown in the table below. For the nation as a whole, the comparable measure of the number of jobs grew by 2.1% over the last 12 months.
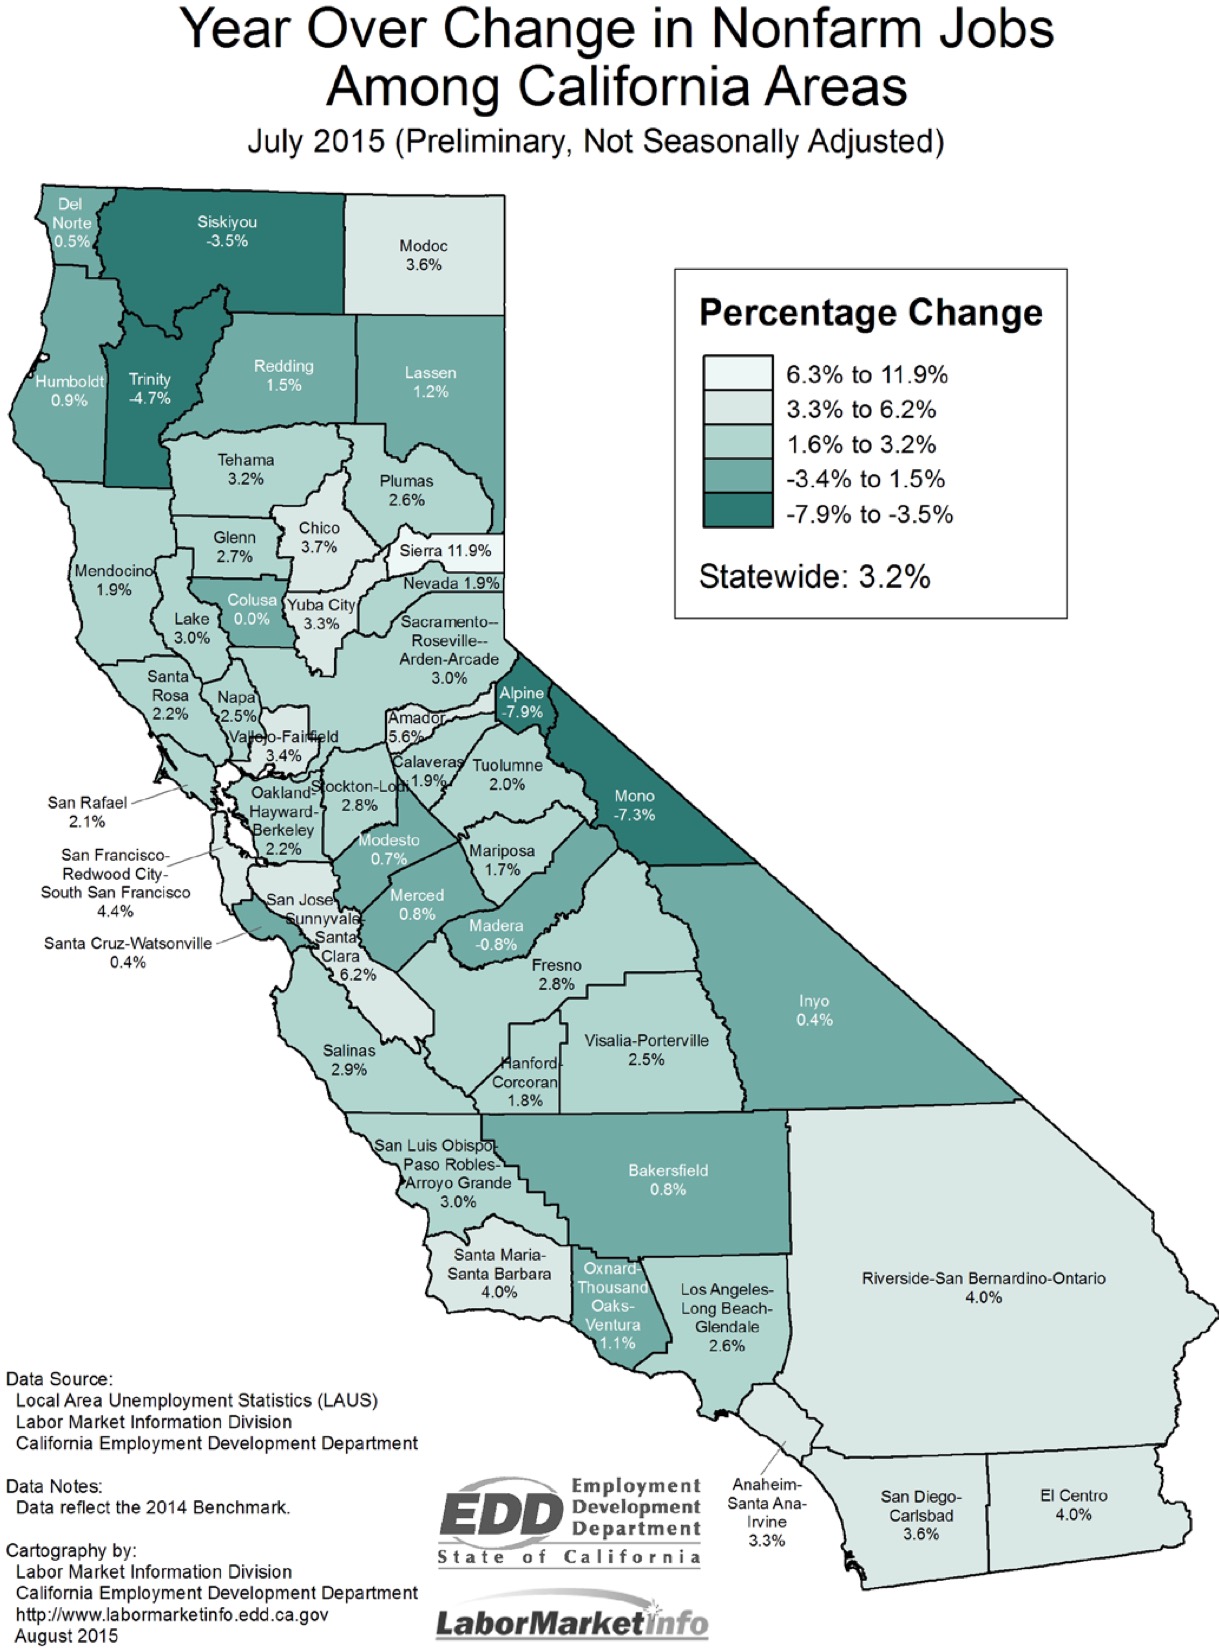
Parts of Bay Area and Inland Empire Among the Areas Leading the State. As shown in the EDD map below, regional rates of job growth across California have varied over the past year. In the map, lighter shades of green indicate faster job growth rates over the past year, while darker shades indicate slower (or negative) job growth rates over the past year, all on a non-seasonally-adjusted basis. Among the parts of the state with the fastest job growth rates over the past year have been San Francisco and the Silicon Valley, the Inland Empire, the Santa Barbara region, and San Diego. Job growth trends in the Central Valley and North State have been mixed. (We provide some additional detail on the regional jobs data in a separate blog post here.)

Unemployment
According to BLS, unemployment in California dropped from 6.3% in June to 6.2% in July. The comparable nationwide unemployment rate in July was 5.3%. As shown in the BLS table below, California (along with Alabama and Louisiana, also with 6.2% unemployment rates) still has the nation's 7th-highest state unemployment rate, trailing West Virginia (7.5%), Nevada (6.8%), Alaska (6.7%), New Mexico (6.5%), Mississippi (6.5%), and South Carolina (6.4%). Over the past 12 months, California's unemployment rate has dropped by 1.2 percentage points. Only Rhode Island and Michigan have experienced larger unemployment rate declines over the past year. (We examine July unemployment and labor force participation data for California in more detail here.)
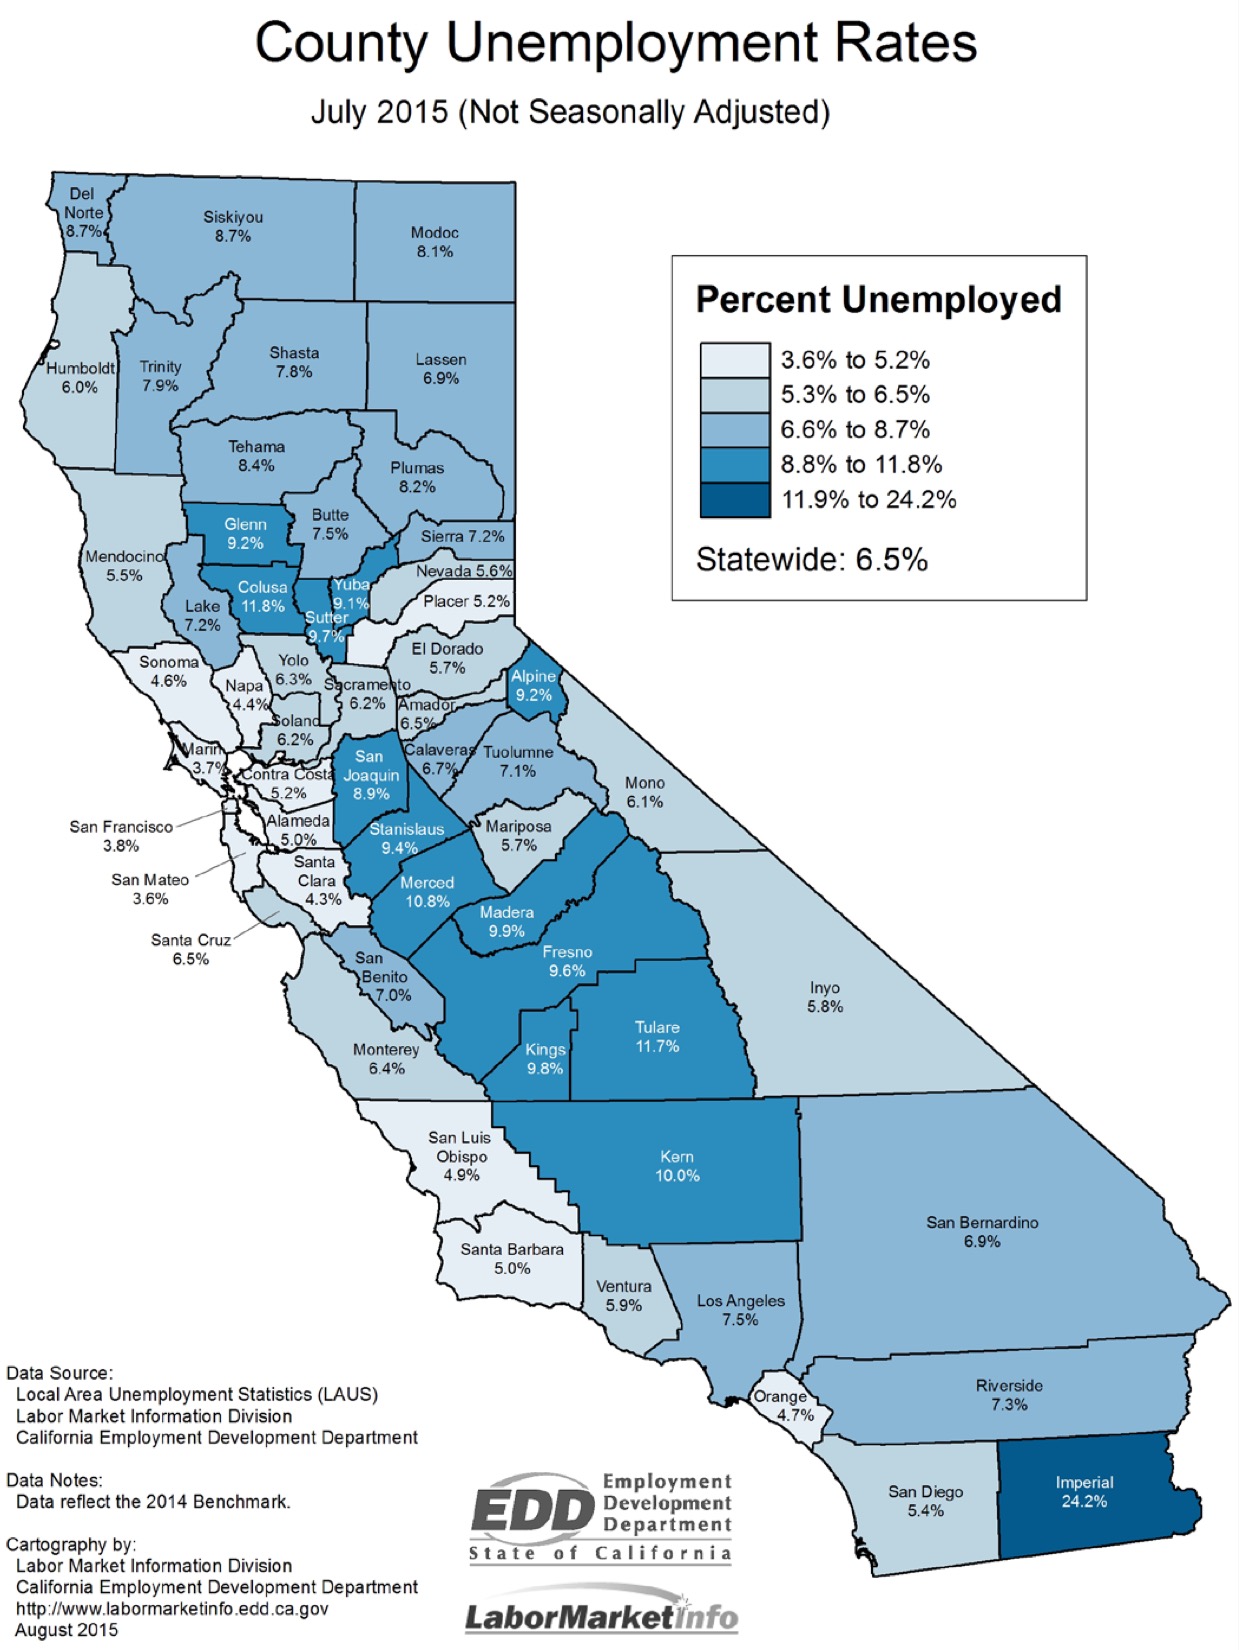
Los Angeles County Leads Statewide Jobless Rate Drop. EDD data shows that the seasonally-adjusted unemployment rate for Los Angeles County declined from 7.5% in June to 7.1% in July, driving the statewide unemployment rate drop. Across the state, unadjusted county unemployment rates ranged from lows of 3.6% in San Mateo County and 3.7% in Marin County to highs of 24.2% in Imperial County and 11.8% in Colusa County. The EDD map below shows unadjusted unemployment rates by county, where lighter shades of blue indicate lower unemployment rates and darker shades of blue indicate higher unemployment rates.


