The Federal Reserve Bank of Philadelphia produces monthly "coincident indices" for each of the 50 states. Combining four state-level economic datasets into one statistic, "the trend for each state's index is set to the trend of its gross domestic product, so long-term growth in the state's index matches long-term growth in its GDP," the Philadelphia Fed notes in describing its methodology. Attempting to summarize recent state economic trends in one statistic, the coincident indices of states across the country are comparable to one another.
California's Economic Growth Over Past Year Ranks 11th, Index Indicates. The July 2015 coincident index data for states was released earlier today, and it is summarized below (ranked by the change in each state's index over the last 12 months). California's 12-month economic growth trend in the coincident index ranks 11th highest among the 50 states. Among the data considered in the coincident indices are state job and unemployment reports, in which California has performed more strongly than the nation as a whole in recent months.
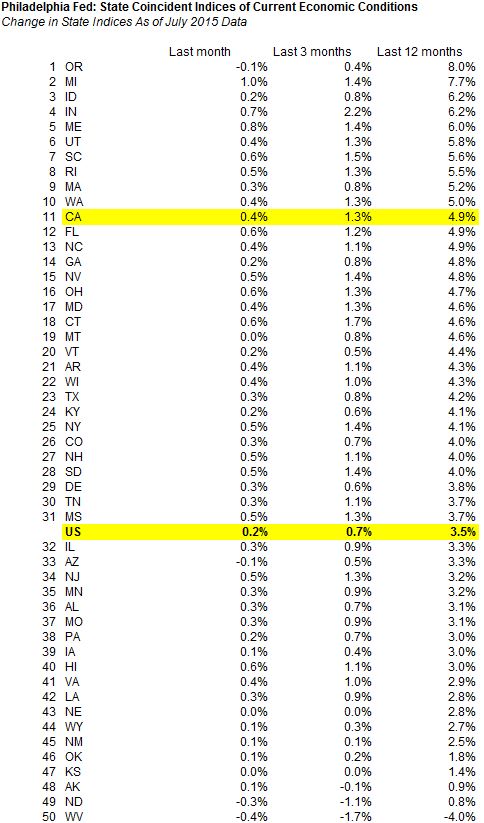
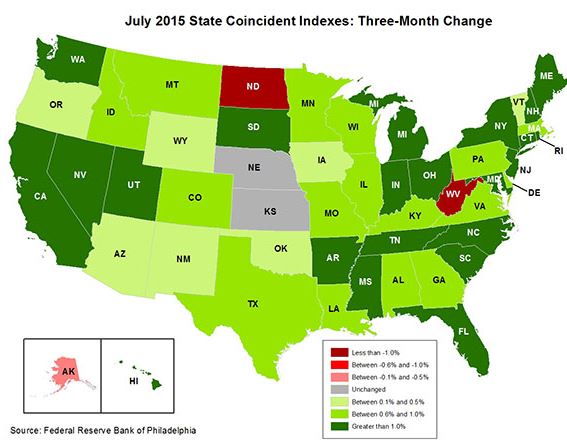
Over Last 3 Months, California Growth Ranks 14th in the Index. The Philadelphia Fed's summary map of its coincident index data emphasizes the growth trend for states over the last 3 months, as shown below. Looking at the last 3 months, California's growth in the index ranks 14th. Therefore, in the map below, California is one of the states colored dark green: the category of states with the most economic growth, according to the coincident index, over the last 3 months.