
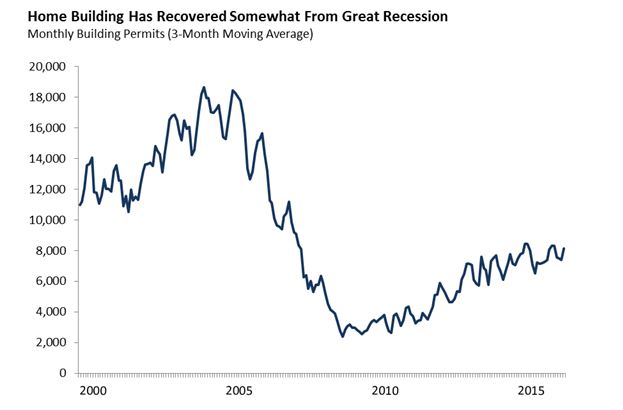
California’s housing markets have recovered since the depths of the Great Recession. Home prices and rents have increased rapidly in recent years. While home building activity also has risen, building remains below historical norms, as the figure below shows.
This modest improvement in building activity raises the question: how do recent building levels compare to state goals for housing production? Periodically, every community in the state is assigned a housing production target through a state-mandated process known as the Regional Housing Needs Allocation (RHNA). Under this process, the state Department of Housing and Community (HCD) estimates the amount of housing each of the state’s regions will need to build to accommodate projected future growth in households. Regional councils of governments take HCD’s estimates and assign a portion to each city and county in their region. Finally, cities and counties modify their local land use plans and zoning rules to incorporate their share of regional housing needs. The process generally is completed every 8 years.
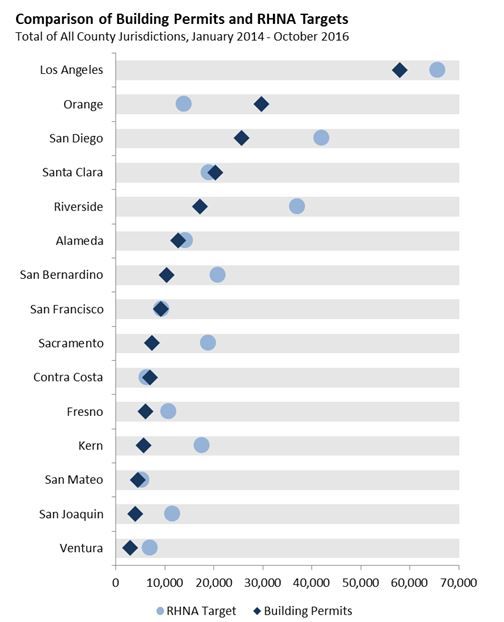
Progress toward RHNA goals has been mixed in recent years. The figure below compares home building permits in the state’s 15 largest counties over the last three years to their RHNA production targets. (Because RHNA targets generally cover an eight year period, the RHNA targets shown in this figure reflect roughly three-eighths of each jurisdiction’s total target.) As the figure shows, most coastal counties (with the exception of San Diego) are meeting or nearly meeting their production goals. On the flip side, home building in the state’s inland areas has fallen short of RHNA targets.
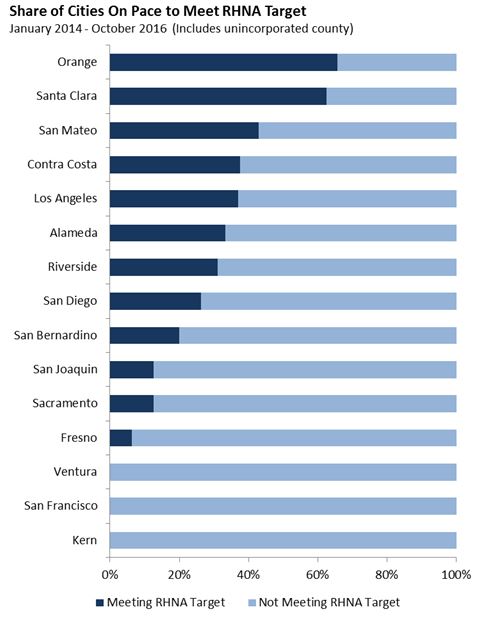
A similar pattern emerges when looking at the share of jurisdictions in each county that are meeting their RHNA targets, as shown in the figure below.
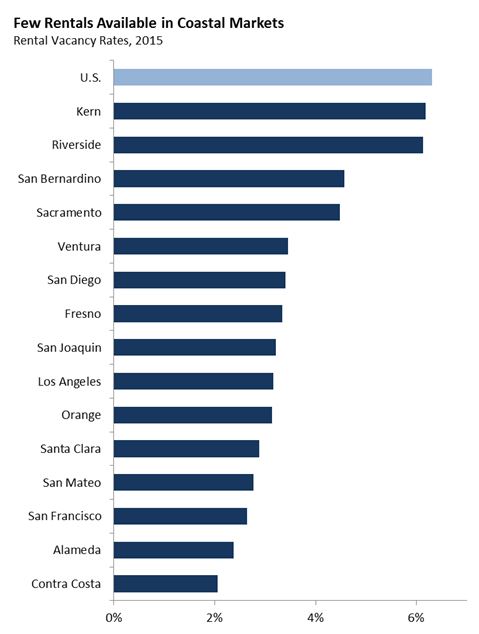
Does this mean that recent housing production in coastal areas has kept pace with demand? This is not the case. Other measures of the adequacy of housing supply suggest that housing remains in short supply in California’s coastal areas. As the figure below shows, rental vacancy rates (the percent of rental homes available for rent to new tenants) in the state’s coastal areas, especially the Bay Area, are extremely low relative to the rest of the state and the country.
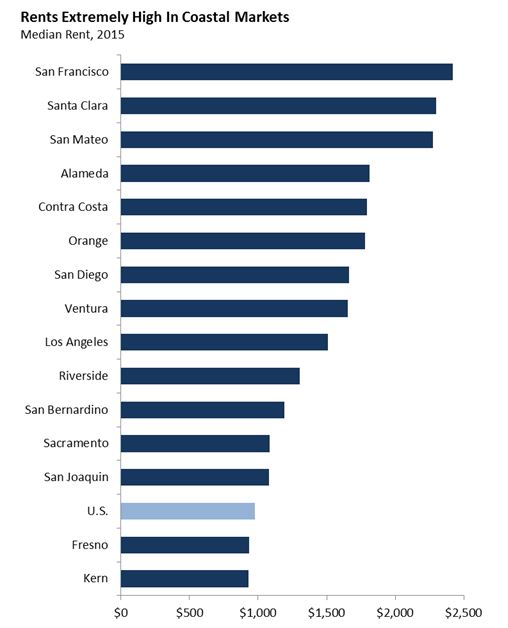
In addition, rents remain extremely high in coastal markets. The figure below shows rents as of 2015. This is the most recent year available from the American Community Survey—which generally is the most comprehensive source of data on rental housing. Other data sources show that high rents have carried over into 2016. For example, data from Zillow shows rents increasing by 3 to 4 percent in the Bay Area during 2016.
It is also notable that building levels in California remain low by national standards. For example, as we pointed out in our November Fiscal Outlook, over the past year, the San Francisco–Oakland and San Jose metro areas (comprised of Alameda, Contra Costa, Marin, San Francisco, San Mateo, and Santa Clara counties) approved about 2.8 building permits per 1,000 residents. This was well below the national average among major urban areas of 3.9 permits per 1,000 residents. In addition, other urban areas with rapidly growing economies similar to the Bay Area—such as Austin, Houston, Portland, and Raleigh—approved over six permits per 1,000 residents during the past year.
Rather than suggesting that home building levels are sufficient in California’s coastal areas, the fact that permitting has kept pace with RHNA targets in these areas may suggest that these production goals do not reflect the full extent of demand for housing in these areas. Production goals likely need to be higher if the high cost of and intense competition for housing in these areas is to be curbed.
Follow @LAOEconTax on Twitter for regular California economy and tax updates.