
November 28, 2016
A Long-Term Outlook:
Disability Among California's Seniors
- Introduction
- Disability and LTSS Landscape
- California’s Population Projected to Change Substantially Between 2015 and 2060
- Projections of Seniors With Disabilities in California From 2015 Through 2060
- Projections of Length of Disability Among Californians Turning 65 Between 2015 and 2019
- California–Specific Projections Are a Necessary First Step in LTSS System Planning
- Additional Information Available on LAO Website
- Appendix
Executive Summary
Rapidly Growing Senior Population and Changing Demographics of California Seniors Raise Issues About Long–Term Supports and Services (LTSS) System. Seniors are major users of LTSS—defined broadly as services and supports provided to the disabled (of any age) who have difficulty performing daily activities. The senior population (adults aged 65 and older) in California is projected to increase more than twofold from roughly 5 million in 2015 to nearly 12 million in 2060. The demographics of the senior population are also projected to change during this period. For example, the senior population is projected to shift from being majority white to majority nonwhite by 2030. The rapid growth and changing demographics of California’s senior population raise issues about seniors’ LTSS needs, LTSS system capacity, and the financial impact of LTSS on personal and state finances. This report presents the results of our projections of disability levels of California’s seniors through 2060 to inform the Legislature and stakeholders about levels of disability and the potential need for LTSS among California’s seniors over the next several decades. These projections provide a useful starting point in understanding how California’s changing population demographics will impact the LTSS delivery system.
Population of California Seniors With Disabilities Projected to Grow Faster Than Overall California Senior Population. We project that the number of seniors in California with disabilities (as defined by limitations in routine activities of daily living, such as dressing or bathing) will increase from 1 million in 2015 to 2.7 million in 2060. This represents 160 percent growth in the population of seniors with disabilities, while California’s overall senior population is projected to grow by 135 percent over this period. The faster growth of the senior population with disabilities is partially driven by the increasing share of seniors aged 85 and older and increasing racial diversity of the senior population.
California Seniors Turning 65 Between 2015 and 2019 Projected to Spend 4.5 Years on Average With a Disability. On average, seniors turning 65 between 2015 and 2019 are projected to live for 23.6 years after age 65 and spend 4.5 of these years with a disability. The average number of years lived with a disability varies based on demographics of the seniors in this cohort. For example, white seniors in this cohort are projected to spend 3.6 years on average with a disability, while Hispanic seniors are projected to spend 5.8 years on average with a disability and nonwhite, non–Hispanic seniors are projected to spend 5.6 years on average with a disability. (Data constraints prevent us from breaking out the nonwhite, non–Hispanic race category into additional groups.)
California–Specific Projections Are a Necessary First Step in Planning for the Growing Senior Population. California–specific projections are necessary to inform the conversation around the future of the LTSS system as California’s senior population grows over the next several decades. Available national–level projections of disability levels (and the related issues of LTSS utilization and LTSS financing), while a useful starting point, are not sufficient to reflect California’s unique demographics and LTSS system. (For example, California’s senior population is projected to be majority nonwhite by 2030, while the senior population nationwide is projected to remain majority white through at least 2060.) As the Legislature, administration, and stakeholders continue to engage in planning for the impact of the growing senior population on the LTSS system, it is necessary to have projections that accurately reflect the uniqueness of California’s population and LTSS system to inform policymaking.
Introduction
Over the next several decades, the senior population (adults aged 65 and older) in California is projected to increase more than twofold from roughly 5 million in 2015 to nearly 12 million in 2060. This increase is largely driven by the aging of the Baby Boomer population who began turning 65 in 2011. A similar increase in the senior population nationwide will also occur during this time frame. However, differences in the demographics of California’s population when compared to the population nationwide will lead to important differences between California’s senior population and the senior population nationwide. For example, California’s senior population is projected to shift from being majority white to majority nonwhite by 2030, while the senior population nationwide is projected to remain majority white through at least 2060.
Long–term supports and services (LTSS) are broadly defined as services and supports provided to the disabled (of any age) who have difficulty performing daily activities. The rapid growth and changing demographics of California’s senior population raise issues about seniors’ LTSS needs, LTSS system capacity, and the financial impact of LTSS on personal and state finances. (We also note that similar issues could be considered for the working–age disabled population, but a discussion specific to that population is beyond the scope of this report.) At the national level, detailed projections of the disability levels and potential LTSS needs of seniors over the next several decades are available to inform the discussion around these issues. However, given California’s demographic differences compared to the United States as a whole, the national–level results may not be applicable to California and to our knowledge similar projections are not available for California’s senior population. To address this information gap, we projected disability levels of California’s seniors through 2060. This report presents the results of our projections to inform the Legislature and stakeholders about levels of disability and the potential need for LTSS among California’s seniors over the next several decades. These projections provide a useful starting point in understanding how California’s changing population demographics will impact the LTSS delivery system. The results presented in this report can also be built upon with further analysis focused on utilization and financing of LTSS over the long term.
Back to the TopDisability and LTSS Landscape
In this section, we discuss how disability is measured and what types of LTSS services are provided to people with disabilities. This applies to the broader population of people with disabilities, including seniors as well as working–aged adults and children. However, this report focuses on seniors, and where possible in this section, we present data specific to the senior population.
Defining Disability and LTSS
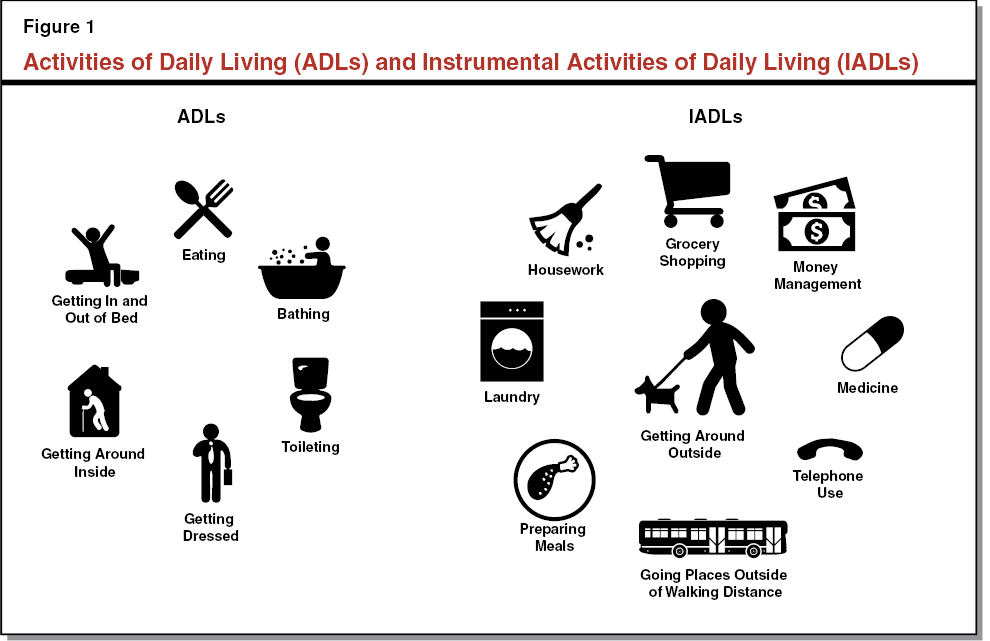
Disability Is Measured by Limitations in Daily Activities. Disability is often measured by limitations in daily activities. These limitations are typically grouped into two categories: (1) limitations in activities of daily living (ADLs) and (2) limitations in instrumental activities of daily living (IADLs). As shown in Figure 1, ADLs are limitations in routine, daily, personal care activities, such as eating or dressing. IADLs are limitations in more complex skills necessary to live independently, such as grocery shopping or money management.
LTSS Are a Range of Services and Supports Provided to People With Disabilities. LTSS are commonly grouped into three categories: (1) institutional care, such as skilled nursing facilities (SNFs); (2) home– and community–based services, such as outpatient facility–based services or paid in–home services, aimed at helping people with disabilities live in the least restrictive setting possible; and (3) informal, unpaid care that is often provided at home by a spouse or other family member.
Paying for LTSS
Payers of LTSS include the state and federal governments, private insurers, and individuals who pay out–of–pocket for their own LTSS. Within the state and federal governments, Medi–Cal and Medicare are the two main payers of LTSS.
Medicare Covers Limited LTSS. Medicare is the federal health insurance program for qualifying persons over age 65 and certain people with disabilities, and is overseen by the federal Centers for Medicare and Medicaid Services (CMS). As a contrast to Medi–Cal (discussed below), individuals are eligible for Medicare regardless of income. Medicare only pays for a limited amount of LTSS. For example, Medicare covers up to 100 days of long–term care in a SNF for individuals receiving skilled care, such as physical therapy, following a recent hospital stay of at least three days.
Medi–Cal Covers a Broader Range of LTSS. Medi–Cal—a joint federal–state health care program for low–income Californians—covers a much broader range of LTSS than Medicare. (Medi–Cal is California’s Medicaid program.) The costs of Medi–Cal services are shared by the state and federal governments. Generally, the federal government pays for one–half of most Medi–Cal costs (although, in some circumstances the federal government pays for a larger amount of the costs), with the state paying the balance. Examples of LTSS covered by Medi–Cal include:
- In–Home Supportive Services (IHSS). The IHSS program provides personal care and domestic services to individuals to help them remain safely in their own homes.
- Community–Based Adult Services (CBAS). The CBAS program—sometimes referred to as “Adult Day Health Care”—is an outpatient, facility–based service program. Program participants live in their own homes, but attend a day program with services provided by a multidisciplinary staff, including: professional nursing services; physical, occupational, and speech therapies; mental health services; therapeutic activities; social services; personal care; meals and nutritional counseling; and transportation to and from the participant’s residence.
- Multipurpose Senior Services Program (MSSP). The MSSP benefit provides intensive case management and home visits for Medi–Cal recipients aged 65 or older who meet the eligibility criteria for a SNF but live outside of institutional settings.
- SNFs. SNFs provide nursing, rehabilitative, and medical care to facility residents. Generally, SNF residents receive their medical care and social services at the SNF.
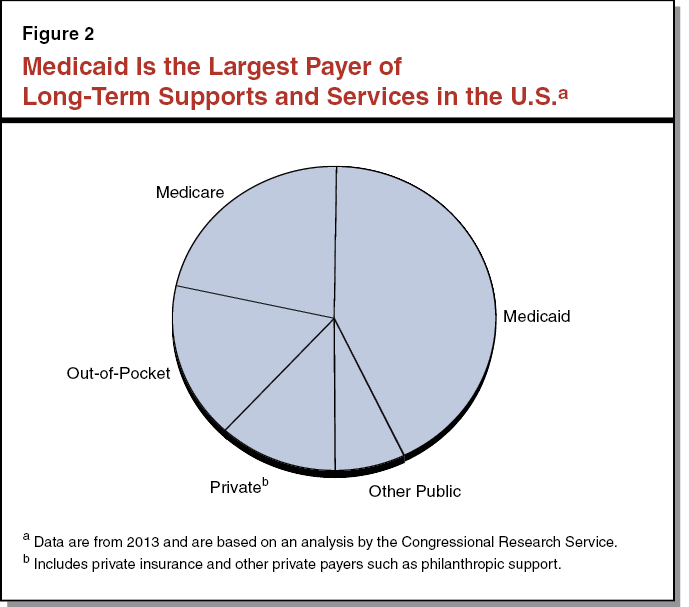
Nationally, Medicaid Is the Largest Payer of LTSS. According to data from CMS on national health spending in 2013, Medicaid spending represented 43 percent of all LTSS spending nationally while Medicare spending accounted for 22 percent. Figure 2 shows national LTSS spending by payer in 2013 (such a breakout is not available for California). In California, the most recent analysis released by CMS indicates that Medi–Cal spending on LTSS was over $14 billion total funds in the 2012–13 federal fiscal year. This includes LTSS–related spending for the entire population served by Medi–Cal, including children, working–age adults, and seniors. An analysis by the Kaiser Family Foundation found that 42 percent of all LTSS spending in 2010 was for the senior population.
Informal, Unpaid Care Also an Important Part of LTSS. In addition to paid LTSS, a large amount of LTSS is provided through informal, unpaid care. This type of care is most often provided by spouses, adult children, or other relatives and may be in addition to paid LTSS. The AARP and the National Alliance on Caregiving estimate that nationwide 34.2 million adults (about 14 percent) served as an unpaid caregiver of an adult aged 50 or older in 2014. These unpaid caregivers spent an average of 24 hours per week providing care such as helping the recipient with ADLs and IADLs or communicating with health care professionals on the recipient’s behalf. In California, more than 6 million adults provided informal care for a family member or friend in 2009 according to an analysis by the University of California Los Angeles. These caregivers provided an average of 21 hours of care per week.
Back to the TopCalifornia’s Population Projected to Change Substantially Between 2015 and 2060
In this section, we provide an overview of the changing population characteristics in California through 2060. The information presented in this section is based on projections from the California Department of Finance and the United States Census Bureau and our analysis of data from the Current Population Survey (a survey of U.S. households that provides demographic and economic information about Americans). See the Appendix for a full list of data sources used in this analysis.
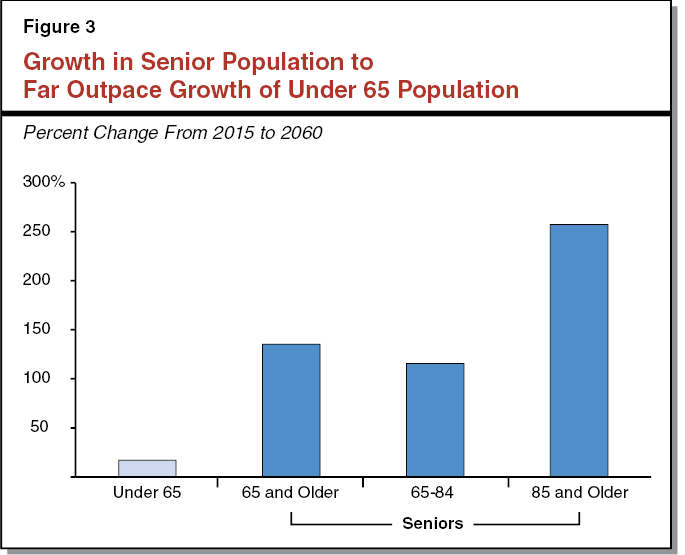
Senior Population Projected to Increase Over Twofold, With Largest Growth Among 85 and Older Population. In 2015, seniors represented 13 percent of California’s population, but by 2060, seniors are projected to represent 24 percent of California’s population. Over this period, the senior population is projected to increase more than twofold from 5.2 million to 12.2 million, while the under 65 population is projected to grow only 17 percent from 33.7 million to 39.5 million (see Figure 3). The largest growth of seniors during this time period is projected to occur among the population of seniors aged 85 and older. The number of seniors aged 85 and older is projected to increase over threefold from about 700,000 in 2015 to over 2.5 million in 2060. This corresponds to a projected increase in the share of seniors aged 85 and older from 14 percent in 2015 to 21 percent in 2060.
Ratio of Working–Aged Adults to Seniors Projected to Decrease by 50 Percent From 2015 to 2060. The projected rapid growth of the senior population relative to the rest of the population results in a projected decrease of roughly 50 percent in the ratio of working–aged adults to seniors by 2060. In 2015, there were 4.7 working–aged adults for every senior in California. By 2060, this ratio is projected to decrease to 2.3 working–aged adults for every senior. Researchers have suggested this may be problematic for the provision of informal care as there may be more seniors who need LTSS and fewer working–aged adults to provide informal care. We revisit this issue later in this report.
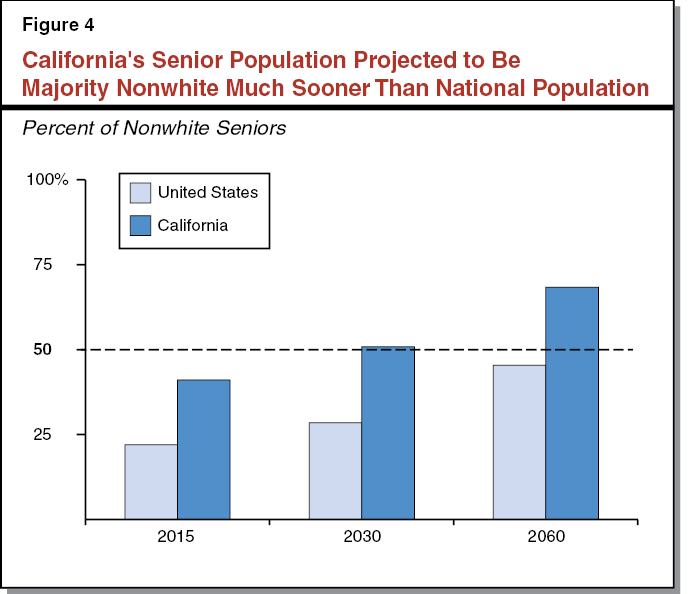
California’s Senior Population Projected to Become Majority Nonwhite While National Senior Population Projected to Remain Majority White. Both in California and nationally, the share of the senior population that is nonwhite is projected to increase (see Figure 4). However, the nonwhite senior population is projected to become the majority in California well before this shift happens nationally. In California, the senior population is projected to shift from being majority white to majority nonwhite by 2030, while nationally, white seniors are projected to remain the majority through at least 2060. As discussed later in this report, rates of disability vary by race; therefore, this projected shift in demographics is likely to have an impact on the number of seniors with disabilities in California.
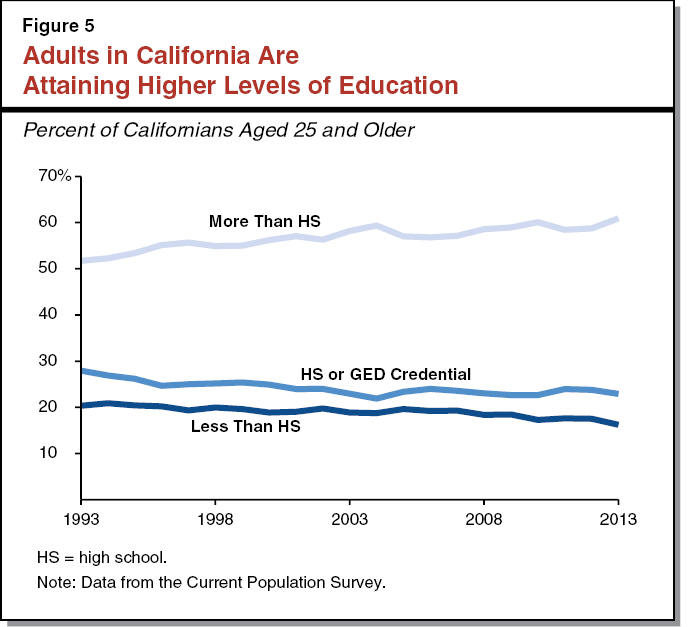
California’s Senior Population May Be More Well–Educated if Current Trends Continue. Consistent with research at the national level, we find that the rate of adults in California attaining more than a high school education is increasing, as shown in Figure 5. This has also translated into higher levels of education among seniors in California. Assuming these trends continue, California’s senior population will be more highly educated in 2060 than in 2015. Rates of disability vary by education level, meaning that trends towards higher levels of education are important to consider when projecting the number of disabled seniors in the future. We discuss this further later in this report.
Projections of Seniors With Disabilities in California From 2015 Through 2060
In this section, we provide projections of the population of seniors with disabilities in California from 2015 through 2060. These projections assume current rates of disability remain constant for subgroups of the senior population. For example, the rate of disability for married Hispanic women who hold a high school degree and are between the ages of 65 and 84 is held constant. This means that any changes in population–wide levels of disability projected in our analysis result from projected changes in the size and demographics of the senior population as opposed to increases or decreases in disability rates. While we project the majority of the senior population will not be disabled in any given year from 2015 through 2060, we project there will be substantial growth in the population of seniors with disabilities during this time period as a result of changes in the size and demographic makeup of the senior population.
Disability Defined Based on Limitations in ADLs. For the remainder of this report, we define disability based on limitations in ADLs (see Figure 1 for a list of ADLs). We generally present results for seniors with limitations in one or more ADLs and for seniors with limitations in two or more ADLs. (We include results specific to seniors with limitations in two or more ADLs because in many cases individuals are required to have at least two ADL limitations to trigger private long–term care insurance benefits if they have such coverage.)
Substantial Increase in Number of Disabled Seniors, but Majority of Senior Population Not Disabled. The number of seniors in California with any ADL limitations is projected to increase from 1 million in 2015 to 2.7 million in 2060 (see Figure 6), although the vast majority of seniors in any given year from 2015 to 2060 are not projected to be disabled. Specifically, among the population of seniors projected to have a disability in 2060, about 1 million are projected to have one ADL limitation and about 1.7 million are projected to have two or more ADL limitations.
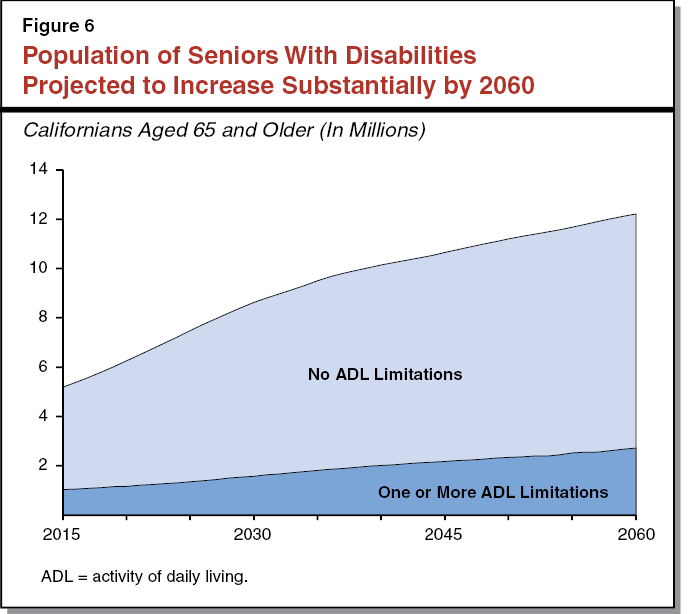
Population of Seniors With Disabilities Projected to Grow Faster Than Overall Senior Population. While California’s overall senior population is projected to grow by 135 percent from 2015 to 2060, the population of seniors with disabilities is projected to grow by 160 percent (see Figure 6). This is the net result of the factors discussed below. (We note that our results do not reflect a causal relationship between these characteristics and disability. We observe in current data that these relationships, such as the relationship between education and disability, exist and assume they continue going forward. We are not speculating as to why these relationships exist currently.)
- Share of Seniors Aged 85 and Older Is Projected to Increase, and Older Seniors Have Higher Rates of Disability. As the share of California’s senior population that is aged 85 and older increases, this shift is likely to have an impact on the number of disabled seniors in California. Currently, rates of disability among seniors aged 85 and older are higher than among seniors aged 65 to 84. If this difference continues as the share of seniors aged 85 and older increases, there will be faster growth in the population of seniors with disabilities than the overall senior population.
- Senior Population Is Projected to Become More Nonwhite, and Nonwhite Population Has Higher Rates of Disability. As California’s senior population shifts from being majority white to majority nonwhite, this will contribute to faster growth among the population of seniors with disabilities than the overall senior population (again assuming current rates of disability by race do not change). Currently, white seniors have lower rates of disability than Hispanic seniors and nonwhite, non–Hispanic seniors. (Data constraints prevent us from breaking out the nonwhite, non–Hispanic race category into additional groups.) As the population of nonwhite seniors grows, this contributes to faster growth in the population of seniors with one or more ADL limitations than the overall senior population.
- Share of Seniors With Higher Levels of Education Projected to Increase, and Rates of Disability Are Lower Among Those With Higher Education. Currently, rates of disability are lower among seniors who have attained more than a high school education than among seniors with a high school or less–than–high–school education. (We note that education is considered to be a proxy for socioeconomic status.) Assuming this difference in rates of disability and current trends towards higher levels of educational attainment continue going forward, this will partially offset the impact of the trends in race and age on the growth of the senior population with disabilities. In other words, the growth rate of seniors with disabilities will not be as high as it would otherwise be absent this impact of increasing educational attainment.
Potential Increased Caregiving Role for Population of Seniors Without Disabilities. As discussed above, the ratio of working–aged adults to seniors is projected to decrease roughly 50 percent from 2015 to 2060. This may mean there are fewer caregivers available for seniors with disabilities. However, focusing only on working–aged adults ignores seniors without disabilities who may be able to provide care for their disabled spouses or other disabled relatives. A recent analysis by the National Academies of Sciences, Engineering, and Medicine found roughly one–third of family members who provided care to seniors were aged 65 or older in 2011. We project that the ratio of seniors without disabilities to seniors with disabilities in California will decrease only 13 percent from 4:1 in 2015 to 3.5:1 in 2060. This may suggest a greater role for seniors without disabilities in providing informal care over the next several decades.
Back to the TopProjections of Length of Disability Among Californians Turning 65 Between 2015 and 2019
In this section, we provide projections of years lived with a disability for the cohort of Californians turning 65 between 2015 and 2019. These results reflect only this cohort as compared to the results presented in the prior section which reflect the full population of seniors in California in each year from 2015 through 2060. We focus on this cohort because we can generally observe their entire remaining life in our projections through 2060.
Disability Projections Among Californians Turning 65 Between 2015 and 2019
Throughout this section, we discuss projections depicted in Figure 7. The figure begins with results for the total senior population turning 65 between 2015 and 2019 and then breaks out the results for this cohort by race, education, and sex. The left column of Figure 7 depicts the average number of years lived after turning age 65 broken out by years lived with no ADL limitations, one ADL limitation, and two or more ADL limitations. For example, we project seniors in this cohort will spend an average of 19.1 years with no ADL limitations, 1.7 years with one ADL limitation, and 2.8 years with two or more ADL limitations. The right column of Figure 7 depicts the average percent of life after turning 65 broken out by no ADL limitations, one ADL limitation, and two or more ADL limitations. For example, we project seniors in this cohort will spend an average of 80.1 percent of life after turning 65 with no ADL limitations, 7.2 percent of life with one ADL limitation, and 11.9 percent of life with two or more ADL limitations.
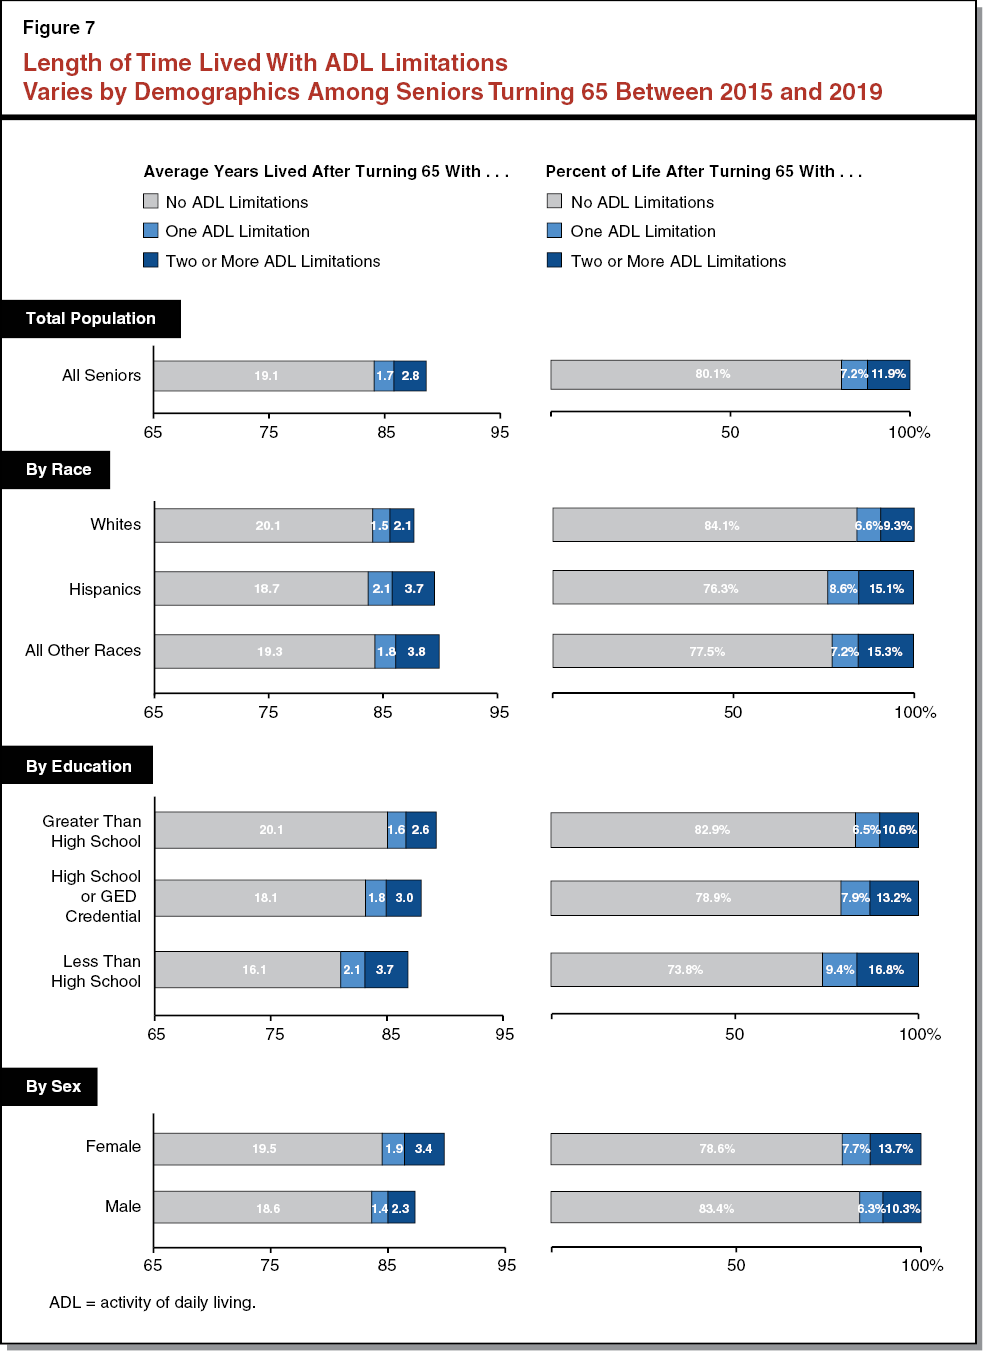
Seniors Turning 65 Between 2015 and 2019 Projected to Spend 4.5 Years and 19 Percent of Remaining Life With a Disability. On average, seniors turning 65 between 2015 and 2019 are projected to live for 23.6 years after age 65 and spend 4.5 of these years (about 19 percent) with one or more ADL limitations. This reflects an average of 1.7 years with one ADL limitation and 2.8 years with two or more ADL limitations. The average number of years lived with a disability varies based on demographics of the seniors in this cohort, as discussed below. While Figure 7 shows the average years lived with ADL limitations, not all seniors in this cohort are projected to have ADL limitations during their life after age 65. Twenty–three percent of seniors in this cohort are projected to spend no years with ADL limitations.
Nonwhite Seniors in This Cohort Projected to Live More Years With a Disability. While seniors on average in this cohort are projected to spend 4.5 years with any ADL limitations, the number of years lived with ADL limitations varies by race. White seniors in this cohort are projected to spend 3.6 years on average with ADL limitations, while Hispanic seniors are projected to spend 5.8 years on average with ADL limitations and nonwhite, non–Hispanic seniors are projected to spend 5.6 years on average with ADL limitations. (Data constraints prevent us from breaking out the nonwhite, non–Hispanic race category into additional groups.)
While nonwhite seniors are projected to live longer than white seniors in this cohort, nonwhite seniors are also projected to spend a larger share of life after age 65 with ADL limitations than white seniors. White seniors in this cohort are projected to live, on average, 15.9 percent of life after turning 65 with at least one ADL limitation, while Hispanic seniors and nonwhite, non–Hispanic seniors are projected to live 23.7 percent and 22.5 percent, respectively, of their life after turning 65 with at least one ADL limitation.
Seniors in This Cohort With More Than a High School Education Projected to Live Fewer Years With a Disability. The average number of years lived with a disability among seniors in this cohort also varies by educational attainment. Seniors turning 65 between 2015 and 2019 who have greater than a high school education spend fewer years on average with one or more ADL limitations than seniors with a high school degree or GED credential and seniors with less than a high school education (4.2 years vs. 4.8 years and 5.8 years, respectively).
Not only do seniors with more than a high school education live longer on average than their counterparts with less education, they are projected to spend a smaller share of their life after turning 65 with one or more ADL limitations on average than seniors with a high school degree or GED credential and seniors with less than a high school education (17.1 percent vs. 21.1 percent and 26.2 percent, respectively).
Female Seniors in This Cohort Are Projected to Live More Years With a Disability. Female seniors turning 65 between 2015 and 2019 are projected to live more years with a disability on average after turning 65 than male seniors in this cohort. Female seniors are projected to live 5.3 years on average with one or more ADL limitations while male seniors are projected to live 3.7 years on average with one or more ADL limitations.
Female seniors in this cohort are projected to live longer after turning 65 than male seniors on average, but female seniors are also projected to spend a larger share of life after turning 65 with one or more ADL limitations on average. Female seniors are projected to spend 21.4 percent of life after turning 65 with at least one ADL limitation on average compared to 16.6 percent of life after turning 65 lived with at least one ADL limitation on average among male seniors.
California Seniors Compared to Seniors Nationally
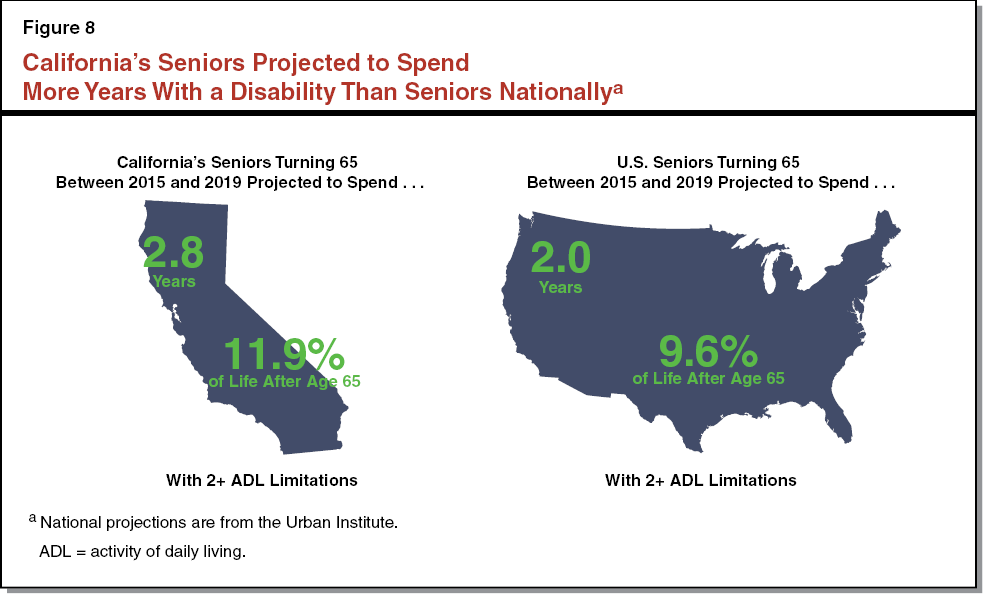
Compared to Seniors Turning 65 Between 2015 and 2019 Nationwide, California’s Seniors Projected to Live More Years With Two or More ADL Limitations. Seniors in California turning 65 between 2015 and 2019 are projected to spend nearly one year longer on average with two or more ADL limitations than seniors nationally (see Figure 8). The Urban Institute projects that seniors nationwide will spend two years on average with two or more ADL limitations compared to our projection of 2.8 years on average for California’s seniors. California’s seniors in this cohort are also projected to spend a larger share of life after turning 65 with two or more ADL limitations than seniors nationally (11.9 percent vs. 9.6 percent).
California–Specific Projections Are a Necessary First Step in LTSS System Planning
This analysis demonstrates the need for California–specific projections to inform the conversation around the future of the LTSS system as California’s senior population grows over the next several decades. The national–level projections that provide information on disability levels (and the related issues of LTSS utilization and LTSS financing), while a useful starting point, are not sufficient to reflect California’s unique population and LTSS system. As the Legislature, administration, and stakeholders continue to engage in planning for the impact of the growing senior population on the LTSS system, it is necessary to have projections that accurately reflect the uniqueness of California’s population and current LTSS system to inform policymaking.
This report begins to fill the need for California–specific information by providing projections of disability among California’s seniors through 2060. To further understand the impact of the aging California population on the LTSS system, it would also be useful to have projections of LTSS utilization and financing. However, such projections are not available at this time. Our office will assess the feasibility of producing such projections in the future subject to available data.
Back to the TopAdditional Information Available on LAO Website
In addition to the findings presented in this report, the LAO website (www.lao.ca.gov) contains additional resources based on our analysis including:
- A summary infographic that highlights key findings from our analysis.
- Supplemental results that provide additional details and explore results for additional subpopulations beyond what is in this report (for example, results are presented for nonwhite seniors who are married compared to nonwhite seniors who are not married).
- Future work that will be added to our website over time, including analyses that provide projections of California’s population of seniors with disabilities under alternative scenarios in which rates of disability (1) decrease over time and (2) increase over time.
Appendix
Data Sources Used in This Analysis
- American Community Survey, 2013 1–year PUMS Data [Data file]. Washington, DC: U.S. Census Bureau, 2013. Available from the American FactFinder website: http://factfinder.census.gov
- Favreault, Melissa, and Judith Dey. (2015). Long–Term Services and Supports for Older Americans: Risks and Financing. Washington, DC: US Department of Health and Human Services, Office of the Assistant Secretary for Planning and Evaluation (ASPE). Retrieved from the ASPE website: https://aspe.hhs.gov/basic–report/long–term–services–and–supports–older–americans–risks–and–financing–research–brief
- Health and Retirement Study (HRS) public use dataset. Ann Arbor, MI: University of Michigan with funding from the National Institute on Aging, 2014.
- HRS Data (Version N) [Data file]. Santa Monica, CA: RAND Center for the Study of Aging with funding from the National Institute on Aging and the Social Security Administration, 2014. Available from the University of Michigan Health and Retirement Study website: http://hrsonline.isr.umich.edu/data/index.html
- Integrated Public Use Microdata Series (IPUMS), Current Population Survey (CPS) [Data file]: Version 4.0. Minneapolis: University of Minnesota, 2015. Available from the IPUMS–CPS website: www.ipums.org
- Rowland, Diane. (2013). What Would Strengthen Medicaid Long–Term Services and Supports (LTSS)? [PowerPoint slides]. Retrieved from: http://ltccommission.org/ltccommission/wp–content/uploads/2013/12/DRowland–PP.pdf
- State Population Projections by Race/Ethnicity, Sex, and Age 2010–2060 [Data file]. Sacramento, CA: State of California, Department of Finance, 2014. Available from the California Department of Finance website: http://dof.ca.gov/research/demographic/projections/
- Survey of Income and Program Participation 2008. Washington, DC: U.S. Census Bureau, 2015.
- Survey of Income and Program Participation 2008. Cambridge, MA: National Bureau of Economic Research (NBER), 2015. Available from the NBER website: http://www.nber.org/data/survey–of–income–and–program–participation–sipp–data.html
- U.S. Population Projections: 2014–2060. Washington, DC: U.S. Census Bureau, 2014 [Data file]. Available from the U.S. Census Bureau website: http://www.census.gov/population/projections/data/national/2014/downloadablefiles.html