Update (3/13/17): We have updated these posts to include health insurance premium subsidies and cost-sharing reductions to insurers. In this update, we also revised some estimates of refundable tax credits to include more recent and accurate data.
LAO Contact

January 18, 2017
Federal Spending in California
Comparing Federal Spending Received to Taxes Paid Nationally
This post compares federal expenditures in California to other states. To do this, we rely on estimates in studies that took a fifty state comparison approach. While we have more confidence in our estimate of federal expenditures in California that we displayed in Post 1, we cannot replicate our estimate for every state. Due to differing methodologies, our estimates of total federal expenditures to California are not directly comparable to the estimates in these studies.
Compared to Other States, California Receives a Smaller Amount of Federal Money Per Person. The Pew Charitable Trusts publishes an annual report on Federal Spending in the States where it estimates that California received $9,172 in federal expenditures per person in FFY 2013-14. (Our estimate of this figure is somewhat higher.) Pew’s estimate of per person expenditures in California is below the national average of $10,200. Figure 1 displays federal spending per person by state in FFY 2013-14, as estimated by Pew. Based on this measure, California ranked 41st (out of fifty states and the District of Columbia). In a blog post published in 2015, we noted this ranking is mostly because California, with a younger population, receives significantly less in federal retirement benefits, such as Social Security. In FFY 2013-14 California received $2,740 per person in retirement benefits, compared to the national average of $3,474. California also receives somewhat less per capita in federal salaries and wages, $752 compared to a national average of $957.
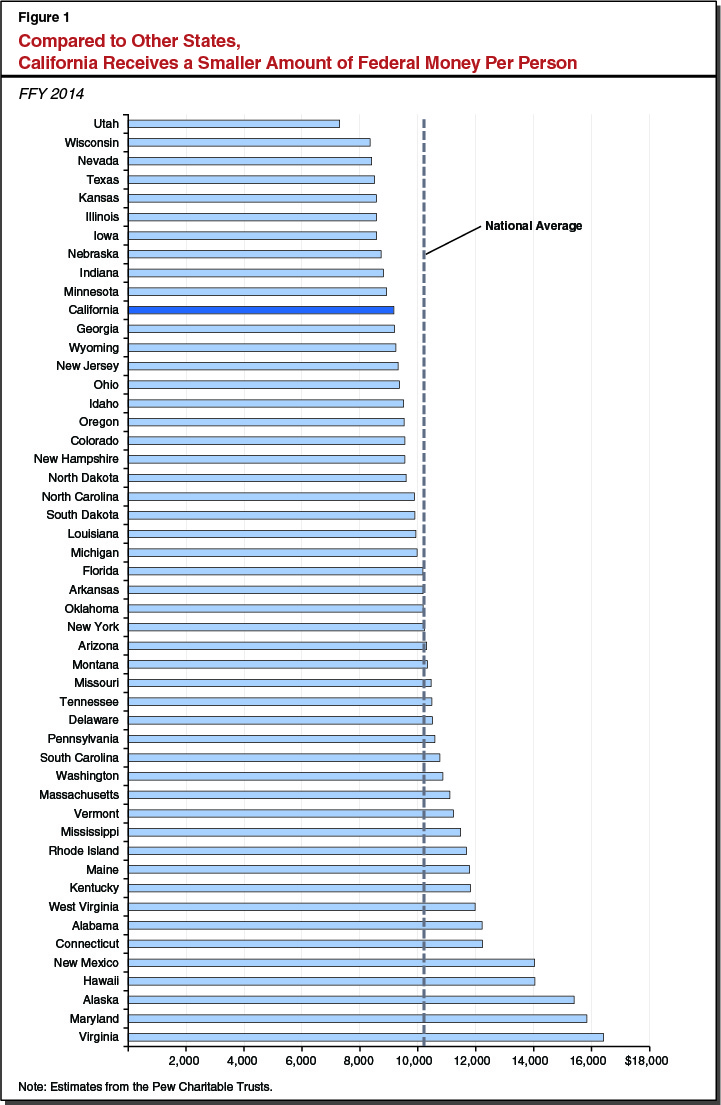
Compared to Other States, Federal Spending Accounts for a Smaller Share of California’s Economy. Pew’s report also compares federal expenditures in each state to the size of its economy. According to the Pew estimates, in FFY 2013-14, federal expenditures made up about 16 percent of California’s economy—less than the national average of 19 percent. On this measure California ranked 42nd among fifty states and the District of Columbia.
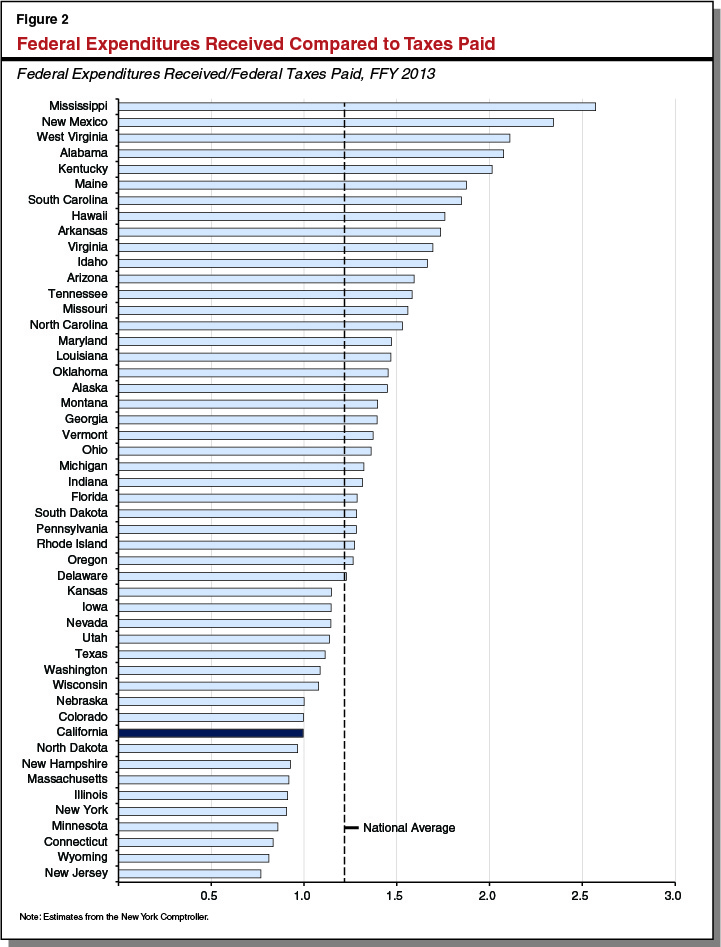
Comparing Federal Expenditures Received to Federal Taxes Paid. Another way of comparing federal expenditures among states is by comparing them to the amount of taxes paid by that state. In 2015, the New York Comptroller published a study that estimates these amounts for all fifty states and the District of Columbia. The study notes that, in FFY 2012-13, the federal government spent nearly $3.5 trillion and brought in about $2.8 trillion in revenue. (The report’s allocated figures exclude some revenues, like customs duties, and expenditures, like net interest on the federal debt, that are not relevant or practical to allocate to the states.) As such, nationally, the federal government spent $1.22 per dollar in taxes received. (If the federal government did not spend more than it received in taxes, this ratio would be closer to $1.00.)
By These Estimates, California Receives $0.99 in Federal Expenditures Per Dollar of Taxes Paid. Figure 2 compares the New York Comptrollers’ estimates of dollars of federal expenditures received per dollar of taxes paid by state. Mississippi, the greatest beneficiary on this measure, received $2.57 in federal expenditures per dollar of taxes paid, while New Jersey, the lowest, received $0.77. According to these measure, in FFY 2012-13 California received $0.99 in federal expenditures per dollar of taxes paid, ranking 42nd among fifty states and the District of Columbia.
Nonetheless, relative to other states, California certainly receives less in federal funding compared to what it pays. Among fifty states, California ranked 41st on the Tax Foundation’s measure, similar to the ranking in the New York Comptroller study. This is mostly because California, with its high population of high-income earners, pays more in federal taxes per person. For example, according to the Tax Foundation study, California paid $8,028 per person in federal taxes, ranking the state 9th on this measure. Coupled with low per-person expenditures, California receives less in federal expenditures compared to what it pays in federal taxes relative to other states.