This chapter discusses our General Fund revenue projections for 1995-96 through 1997-98, based on the standard economic forecast presented in Chapter 2.
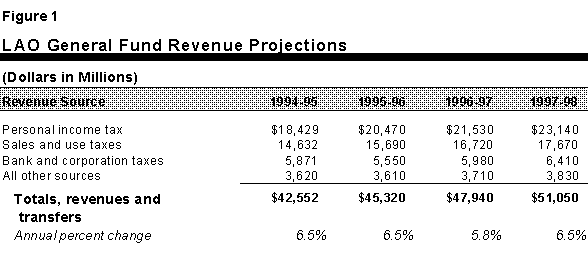
1995-96 Revenues. Following two years of declines, General Fund revenues grew by 6.5 percent in 1994-95. We expect a similar gain in the current year, as shown in Figure 1. This reasonably good growth is the direct result of the strengthening in California's economy, which has lifted personal income, retail sales, and other key revenue-related economic measures. We currently project that General Fund revenues will total $45.3 billion in 1995-96, which is $1.3 billion more than the revenue forecast contained in the 1995-96 budget adopted last August. Our forecast for stronger-than-assumed current-year revenues is consistent with recent cash trends, which show revenues through October up over $675 million, of which about $500 million appears permanent.

1996-97 and 1997-98 Revenues. Consistent with our moderate economic growth forecast, we project that General Fund revenue growth will average 6.1 percent over the following two years, with revenues totaling about $47.9 billion in 1996-97 and $51.1 billion in 1997-98.
General Fund revenues are derived from a variety of sources, including taxes, investment income, fees, and various user charges. However, over 90 percent of all revenues come from the state's three largest taxes--the personal income tax, sales and use taxes, and bank and corporation taxes.
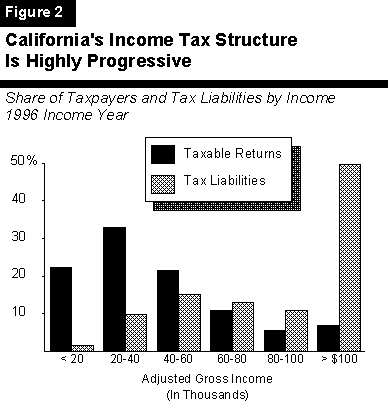
California's Income Tax Is Highly Progressive. Due to the PIT bracket structure and the distribution of income in California, higher-income taxpayers account for a large share of tax liabilities. Figure 2 shows, for example, that the top 7 percent of taxpayers-- those with incomes exceeding $100,000 annually--will account for nearly 50 percent of total tax liabilities in 1996. This high degree of progressivity has important implications for the revenue outlook. It means that the growth in tax liabilities is determined not only by overall increases in personal income, but also how the income gains are distributed between lower- income and higher-income taxpayers. This, in turn, depends partly on how different types of income are growing.
Income Growth to Vary by Type. A significant feature of our economic outlook is that individuals' business-related profits and investment-related earnings will be among the faster growing sources of income during the next three years. These types of earnings tend to accrue to upper-income taxpayers, who are subject to higher marginal tax rates. As a result, we project that overall income tax liabilities will grow more quickly than statewide personal income during the next three years.
Revenue Projections. We forecast that PIT revenues will reach $20.5 billion in 1995-96, an increase of about 11 percent over the prior year. For the following two years, we project that PIT revenues will continue to expand, increasing at an average annual rate of 6.3 percent to reach $21.5 billion in 1996-97 and $23.1 billion by 1997-98. Our estimates reflect the scheduled elimination of the top tax brackets at the end of 1995, which will lower personal income taxes by $325 million in 1995-96, $815 million in 1996-97, and $905 million in 1997-98.
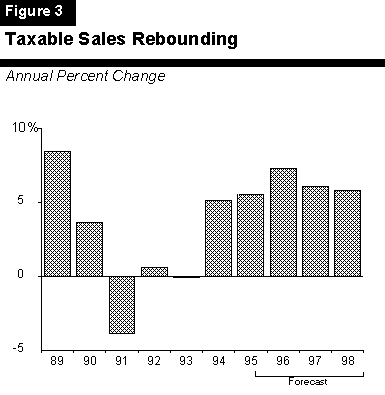
Taxable Sales Rebounding. The key to projecting sales and use tax revenues is forecasting taxable sales. The performance of taxable sales in recent years has mirrored overall California economic activity. Following several weak years, sales began to grow significantly in 1994 and have continued to rise in 1995. As shown in Figure 3, we are projecting that taxable sales will continue to experience reasonably good growth over the next few years.
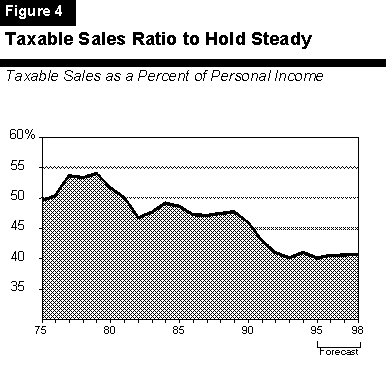
Taxable Sales Ratio to Hold Steady. As indicated in Figure 4, the ratio of taxable sales to personal income has fallen significantly over the past 15 years. This is consistent with the long-term shift in consumer spending toward services, which generally are not taxed. We are projecting that this ratio will be relatively stable over the forecast period at about 40 percent.
Revenue Projections. We project that sales and use tax revenues will total $15.7 billion in 1995-96, 7.2 percent above 1994-95. For 1996-97 and 1997-98, we project that sales and use tax revenues will reach $16.7 billion and $17.7 billion, respectively. The average growth for these two years of 6.1 percent is slightly faster than the increase in personal income.
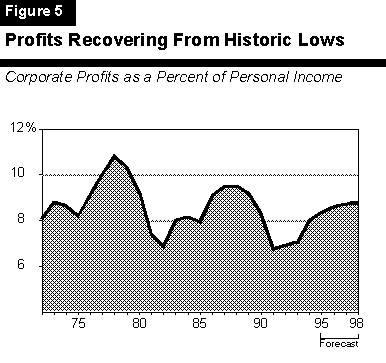
Corporate Profits Improving. After several years of sluggish performance, bank and corporation revenues jumped 23 percent in 1994-95, to $5.9 billion. While one-time payments accounted for part of the gain, the majority was due to improving profits. Corporate tax payments have remained strong as of late 1995, indicating that favorable profit trends currently are continuing. Figure 5 shows that the ratio of corporate profits to state personal income (a key measure of the strength of profits) has rebounded from its historic 1990s low, and is forecast to trend upward. Even with our projected increases, however, the ratio will remain well below the levels attained in the late 1970s and late 1980s.
Revenue Projections. We project that bank and corporation revenues will total $5.6 billion in 1995-96. While this is down from last year, two special factors account for the decline. First, the recent Barclay's court decision resulted in one-time payments of $410 million in 1994-95. Second, legislation passed in 1993 provides a tax credit for equipment purchases by manufacturers beginning in 1995. This will reduce revenues by $365 million beginning in 1995-96.
Beyond the current year, we project that revenues will reach $6 billion in 1996-97 and $6.4 billion in 1997-98. The average 7.5 percent gain in these years reflects slightly above- average projected gains in corporate earnings.
The revenue outlook is highly dependent on the economy's performance. In particular, a serious economic slowdown or recession would have a dramatic effect on receipts from personal income, sales, and corporation taxes over the next three years. The revenue implications of a weaker economy are discussed in Chapter 5.