 |
California's Fiscal Forecast |
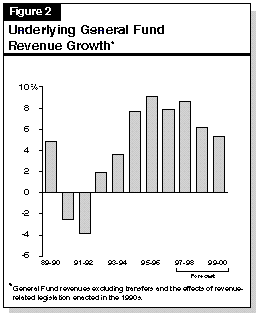
Current-Year Revenues. As indicated in Figure 1, we estimate that revenues and transfers in the current year will total $53 billion, a 7.5 percent increase from 1996-97. Our current estimate is up $507 million from the 1997-98 Budget Act estimate.
| Figure 1 | ||||
| LAO General Fund Revenue Projections | ||||
| (Dollars in Millions) | ||||
| Revenue Source | 1996-97 | 1997-98 | 1998-99 | 1999-00 |
| Personal income tax | $23,400 | $26,150 | $27,700 | $28,900 |
| Sales and use tax | 16,480 | 17,450 | 18,430 | 19,410 |
| Bank and corporation taxes | 5,840 | 5,950 | 6,300 | 6,600 |
| All other sources | 3,605 | 3,488 | 3,339 | 3,446 |
| Totals, revenues and transfers | $49,325 | $53,038 | $55,769 | $58,356 |
| Annual percent change | 6.5% | 7.5% | 5.1% | 4.6% |
At this point, we are assuming that most of the softness from these sources is due to the normal volatility in the month-to-month timing pattern of estimated payments, as opposed to any unexpected, fundamental weakness in investment income or business earnings that underlie such payments. The main reasons for this view are (1) the documented strength of the economy and (2) the fact that withholding and sales tax payments--which normally are good indicators of current economic activity--exceeded the budget estimate during the first four months of this fiscal year.

| Figure 3 | |||
| Fiscal Effects of 1997 Tax Relief Package | |||
| (In Millions) | |||
| 1997-98 | 1998-99 | 1999-00 | |
| Increase in PIT dependent exemption credit | -$15 | -$295 | -$780 |
| Change in calculation of research & development credit | -63 | -58 | -48 |
| Capital gains exclusion on sales of principal residences | -25 | -110 | -70 |
| Alternative Minimum Tax (AMT) exemption increase and indexing | -44 | -74 | -85 |
| Subchapter S corporation conformity to federal law | -18 | -21 | -22 |
| Other provisionsa | -24 | -35 | -81 |
| Total | -$189 | -$593 | -$1,086 |
| aIncludes conformity to federal law regarding Roth Individual Retirement Accounts (IRAs) and Education IRAs, corporate prepayment rules, and various amortization rules. | |||
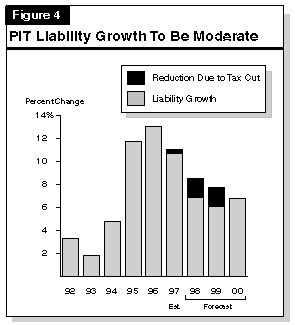
PIT Liabilities. As indicated in Figure 4, PIT liabilities have increased by an average of 11.9 percent during the past three years. These gains partly reflect the general increases in employment and personal income that have occurred in California, but also are due to rapid increases in capital gains, dividend income, bonuses, and business receipts. These forms of income accrue primarily to high-income taxpayers, who are subject to the highest marginal income tax rates.

We forecast that PIT liabilities over the next couple of years will continue to grow, although at a
pace which is more in line with the growth we project for California personal income generally.
Our expectation of a somewhat reduced rate of liability growth is partly related to the outlook for
a mild slowdown in annual personal income gains. It also reflects our assumption that a relatively
smaller share of the income gains will be from above-average increases in bonuses, capital gains,
and other forms of income subject to high marginal income tax rates.
Revenue Forecast. Based primarily on our forecast of PIT liabilities, we currently estimate that fiscal-year PIT collections will total $26.1 billion in 1997-98, an 11.8 percent increase from 1996-97. Our current projection is up $628 million from the 1997-98 Budget Act forecast. We further project that PIT revenues will expand to $27.7 billion in 1998-99, and to $28.9 billion in 1999-00. The revenue estimates for 1997-98 through 1999-00 reflect the impact of the recently enacted tax reduction package discussed above, as well as the impact of the recent federal tax rate reduction on capital gains, which we estimate will increase state PIT revenues by $450 million in 1997-98 and by $250 million annually through the remainder of the forecast period.
The state sales and use tax rate is a combined 6 percent, which includes a 5 percent General Fund rate and a 1 percent rate allocated to special funds. Additional local rates ranging from 1.25 percent to 2.5 percent are imposed by cities, counties, and transportation districts, bringing the combined state-local tax rate to between 7.25 percent and 8.5 percent, depending on the county involved.
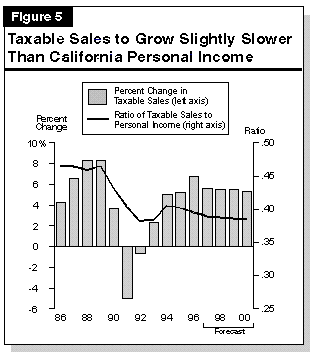
The key factor determining the level of sales and use tax receipts is the strength of taxable spending by consumers and businesses in California. As shown in Figure 5, taxable sales fell sharply during the early 1990s' recession, but have recovered during the subsequent economic expansion. We forecast that taxable sales will continue to expand over the forecast period, increasing by 5.6 percent per year during both 1997 and 1998, before moderating slightly to 5.5 percent in 1999 and 5.2 percent in 2000.

Despite the taxable sales gains projected for the next three years, the share of total personal
income devoted to taxable spending is expected to fall slightly over the next three years. The
declining share reflects the ongoing shift in share of total consumption away from commodities
and toward services (which are not generally taxable).
Revenue Forecast. Based on our projections for taxable sales, we estimate that General Fund sales and use tax receipts will total $17.5 billion in the current year, representing a 5.9 percent increase from 1996-97. This estimate is $120 million above the 1997-98 Budget Act fore-cast, reflecting slightly stronger economic growth in late 1997 and early 1998 than was previously assumed. We project that sales and use tax receipts will grow to $18.4 billion in 1998-99, and further to $19.4 billion in 1999-00.
The key determinant of bank and corporation tax revenues is California taxable profits. (We note, however, that tax receipts in recent years have been significantly influenced by a number of other factors, including large audit-related collections and certain tax law changes.)
California taxable earnings fell sharply in the recession, but bounced back during the early stages of the current economic expansion, growing by as much as 19 percent in 1995. Over the past year, profit growth has subsided some. Although underlying business sales and earnings appear to have been strong, total earnings were affected by one-time charges against earnings related to restructurings in the state's finance and utility industries. As a result, profits grew by an estimated 8 percent in 1996, or about one-half the rate of the prior year. We expect profit growth to continue to moderate over the next three years, increasing at an average annual rate of 5.5 percent between 1997 and 2000.
Revenue Forecast. We project that bank and corporation tax revenues will total $6 billion in 1997-98, a 1.9 percent increase from the prior year. Our current estimate is $78 million below the 1997-98 Budget Act estimate. The small gain from the prior year reflects the impact of both the tax-rate reduction that took effect in January 1997, and the tax package enacted in September of this year. We project that bank and corporation tax receipts will continue to grow in the following two years, reaching $6.3 billion in 1998-99 and $6.6 billion in 1999-00.
A second uncertainty relates to taxpayer responses to recent federal law changes relating to capital gains. Specifically, our forecast assumes that the reduction in the maximum federal tax rate on such gains from 28 percent to 20 percent will result in a moderate increase in capital gains realizations in 1997 and beyond. Our estimates assume that the increased level of these realizations will translate into a $450 million increase in PIT receipts in 1997-98 and approximately $250 million annually through the remainder of the forecast period. These assumptions are somewhat conservative relative to those used by federal revenue estimators in preparing fiscal estimates of the federal implications of the rate reduction. If the increase in realizations turns out to be more in line with the federal assumptions, 1997-98 revenues would be $250 million more than our estimate.
A third, and more general, uncertainty relates to the compositional characteristics of recent and projected taxable income growth in California. As indicated above, much of the extraordinary increases in the PIT during the past two years has been related to major increases in capital gains, investment earnings, and bonuses. Unexpected strength or weakness in these extremely volatile taxable income components could cause revenues to be several hundred millions of dollars higher or lower than our projections--even if our overall estimates of economic growth turn out to be correct.
Continue to Chapter 4: Expenditure Projections
Return to California's Fiscal Outlook Table of Contents