 |
California's Fiscal Forecast |
Chapter 5: Long-Term Considerations
For planning purposes, it is important for the Legislature to have information about the various
factors which will influence the state's longer term fiscal condition beyond 1999-00. Although
the near-term budgetary outlook is favorable over the forecast period, the budget's condition in
later years will depend on a variety of factors. This chapter discusses some of these factors. As
shown in Figure 1, they include demographic trends, economic and revenue developments,
current-law expenditure trends, and policy-related decisions affecting both revenues and
spending.
| Figure 1 |
| Key Factors in California's Long-Term Fiscal Outlook |
|
|
|
|
|
|
DEMOGRAPHICS
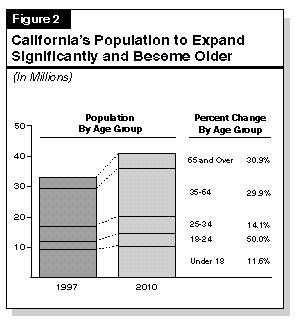
California's population will be experiencing significant changes in the future, in terms of both numbers and composition. As shown in Figure 2, we project that the state's population will exceed 40 million by 2010. This represents a growth of more than 7.9 million persons (about 24 percent--or an average increase of 1.7 percent annually) from 1997. The figure also shows that all population age segments will increase, but at varying rates. This will lead to changes in the population's age mix. These trends will have a variety of fiscal implications for the state. For example, over the period, the college-age population will increase by roughly 50 percent, or about twice as fast as the population generally. In contrast, the under-18 population will increase much more slowly--only 12 percent in total.
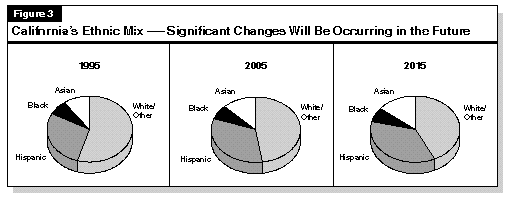
There also will be various other demographic changes occurring. For example, Figure 3 shows that the state's ethnic mix will be changing significantly.

LONG-TERM ECONOMIC AND REVENUE GROWTH
The principal determinant of revenue growth over the long term is the performance of the California economy. This reflects the fact that the state's tax collections over time are strongly influenced by California employment, personal income, profits, and spending. Assuming that California's economy experiences, on average, moderate economic growth (for example, employment growth of 2 percent to 3 percent annually) and reasonably low inflation (in the range of 2.5 percent to 3.5 percent annually), we estimate that revenues would grow at an average rate of 5 percent to 6 percent per year. As recent experience has shown, revenue growth in any individual year can vary significantly from this range, depending on the stage of the business cycle, as well as year-to-year fluctuations in such volatile factors as taxable capital gains and audit receipts.STATE PROGRAMS
As discussed below, significant long-term fiscal considerations are associated with a variety of program areas within the state budget.CalWORKs
Long-Range Projections. Our long-term projections indicate that spending will remain just under $3 billion in 2000-01 and 2001-02 and will then decline by over $200 million per year in 2002-03 and 2003-04. This out-year spending reduction is mostly attributable to (1) modest declines in welfare-to-work and support services costs as the existing caseload moves through the system, (2) continued caseload declines from service intervention, and (3) the impact of the five-year time limit on adults. By 2003-04 we project that state spending will be at the federal maintenance-of-effort floor. We note that these projections assume restoration of the statewide 4.9 percent grant reduction and the statutory cost-of-living adjustment beginning in 1998-99.Impact of a Recession. Our spending projections assume continued economic growth. Because federal funding for CalWORKs is provided as a block grant, the state bears all of the risk in the event of a recession. For example, if a recession occurred and it resulted in a 5 percent caseload increase during 1999-00, projected CalWORKs spending would increase by over $500 million in that year alone.
Healthy Families Program
The newly enacted Healthy Families Program, along with Medi-Cal, offer health coverage to almost all of the uninsured children in the state who are in low-income families (with incomes of up to 200 percent of the federal poverty level). Currently, there are about 500,000 uninsured children in California in families whose incomes are in this range, but not low enough to qualify for Medi-Cal coverage. The administration estimates an annual General Fund cost of $170 million for the Healthy Families Program (when fully implemented), based on the cost of covering all of these uninsured children.Over the long term, the cost of this program will depend on the actual participation rate of families and on the amount of "crowd out" of private coverage. Some families with uninsured children will not participate in the program, and this will tend to reduce costs somewhat below the estimate. On the other hand, the availability of low cost children's health coverage may crowd out dependent coverage provided by employers of lower-wage workers and shift coverage of these children to the Healthy Families Program. The cost of crowd out could be substantial and probably would outweigh savings from less than full participation by uninsured families. There are almost 900,000 low-income children who currently have some form of private health coverage in California. Depending on the extent of crowd out that occurs, the cost of covering all eligible children could increase by up to several hundred million dollars annually.
Proposition 98
A significant factor affecting the level of General Fund support for all state programs is the extent to which funding is directed to Proposition 98 under the formula contained in the State Constitution. In other words, funds earmarked for K-14 education are not available for other state programs. Proposition 98 spending depends on the growth in personal income, General Fund and local property tax revenues, total state population, and K-12 student attendance.Over the forecast period, we estimate that Proposition 98 will absorb a large portion of new General Fund revenues each year. (For example, in 1998-99, we estimate that 56 percent of the $3 billion in newGeneral Fund tax revenues will go toward the Proposition 98 guarantee.) As a result, we forecast that Proposition 98's share of state General Fund revenue will increase from 41 percent in 1996-97 to 43 percent in 1998-99.
Beyond the forecast period, it is much more difficult to predict Proposition 98's share of the General Fund budget. Under the moderate economic growth scenario noted above, we think it is likely that Proposition 98's share of the budget will stabilize. It is possible in future years, however, that slower student enrollment growth and faster growth in local property taxes could result in a decrease in the General Fund share going to Proposition 98.
Higher Education
Our projection of cost increases at the University of California (UC) and the California State University (CSU) assumes a 1.4 percent annual rate of enrollment growth through 1999-00, which is consistent with current rates of college participation and anticipated increases in the college-going population.Long-term enrollment growth will depend largely on demographic changes. For instance, increased enrollments over the next decade will depend in large part on increases in the young-adult population. This group is projected over the next decade to grow at over 2 percent annually, as the children of the "baby boomers" move into their college-age years. (Many refer to this growth as the next "tidal wave" of students.)
How these population numbers translate into increased higher education enrollment is subject to much uncertainty about the percentage of college-age students who will be eligible, apply, and ultimately attend the community colleges, UC, and CSU. Assumptions regarding the participation rates of young adults and older Californians are critical. These rates are influenced by general economic conditions, the educational goals and achievement of students, and the tuition and benefits of various public and private education opportunities. We estimate that if recent participation rates for all ages continued into the future, the annual increase in higher education enrollment would average about 1.2 percent.
Department of Corrections
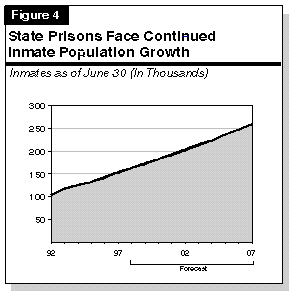
Figure 4 shows that we anticipate that the prison population, which is now about 155,000, will reach about 260,000 by June 2007. This continued high level of inmate growth represents a major operational and fiscal challenge to the state. Should it persist, we estimate the Department of Corrections' (CDC) support budget would reach almost $6.6 billion by the 2006-07 fiscal year, or roughly double the present funding level, after adjusting for anticipated federal funds. The CDC support budget would grow at an average annual rate of about 8.7 percent, compared with an annual 5 percent to 6 percent growth in revenues that would occur for the state General Fund under a moderate economic growth outlook during that same ten-year period.
Based on the CDC's projections, the inmate population will reach the capacity of the state prison system (two inmates per cell and double-bunking in dormitories and gymnasiums) by early 2000. If new state prisons were to be authorized in mid-1998, they could not be occupied until mid-2001--about 16 months after the system reaches capacity given current prison population projections. The CDC projections indicate that inmate population will increase by about 14,000 inmates during this 16-month period. On this basis, the state will need to accommodate these inmates--the equivalent of almost three prisons--in other than new prisons.
During the period from 2001 to 2007, an additional 67,000 inmates are projected to enter the system. Accommodating these inmates in new state prisons would require one-time capital outlay costs of about $3.2 billion for 13 prisons. However, the cost of CDC operations and capital outlay could be lower if the Legislature and Governor or the courts took actions which either slowed inmate population growth or provided alternative forms of punishment for some offenders.
Trial Court Funding
Under Chapter 850, Statutes of 1997 (AB 233, Escutia and Pringle), costs to the counties for support of trial courts are capped. The state will be responsible for all future growth in trial court costs, including costs resulting from workload increases, inflation adjustments, and new programs. These cost increases will likely be significant (at least $30 million to $80 million annually in the out years). An important factor in determining the state's future costs will be the amount of control the state (particularly the Judicial Council) exercises over the operations and expenditures of the trial courts which, up to now, have largely been controlled by counties and the courts themselves.In addition, Chapter 850 establishes two task forces to examine and make recommendations to the Legislature on two significant areas regarding the change in state and local responsibility for funding the courts. The first is related to the future personnel structure of the trial courts (including studying whether trial court personnel should be court employees, state employees, or continue as county employees). The second is related to future funding responsibility for court facilities, which are the obligation of the counties under Chapter 850. Depending on the actions of the Legislature and Governor with regard to whatever recommendations are produced by these task forces, the state's long-term costs could change significantly.
State Infrastructure
In our spending projections, we forecast that expenditures on debt service (for both general obligation and lease-payment bonds) will reach 4.8 percent of General Fund revenues by 1999-00. These debt service payments primarily pay for existing facilities. The state, however, will face significant demands for additional capital outlay expenditures in the coming years.Figure 5 shows the capital outlay needs projected for the next five years. It indicates that state
agencies and K-12 education have needs totaling about $35 billion over that period. Most of the
identified projects fall in the areas of transportation, education, and corrections. The amount for
higher education is significantly less than in prior years. This is because the Chancellor's Office
of the Community Colleges has identified significantly fewer statewide needs.
| Figure 5 | |
| Projected Capital Outlay Needs
For the State and K-12 Education 1997-98 Through 2001-02 | |
| (In Millions) | |
| Five-Year Total | |
| Executive | $70 |
| State and Consumer Services | 540 |
| Transportation | 14,920 |
| Resources | 670 |
| Health and Welfare | 260 |
| Youth and Adult Corrections | 1,980a |
| K-12 Education | 11,000b |
| Higher Education | 3,900 |
| General Government | 210 |
| Total | $33,550 |
| aIncorporates LAO estimate for new prison construction. Assumes that 14,000 inmates will have to be accommodated in other than new state prisons due to a short-term lack of space. Building new prisons for these inmates would cost an additional $800 million. | |
| bAssumes historical costs and continuance of existing state programs for funding school facilities. | |
In recent years, the vast majority of capital outlay has been financed with state bonds. The major exception is transportation, which is financed primarily from state special funds and federal funds. Presumably, future capital outlay projects would be financed similarly.
Deferred Maintenance. In addition to the need for capital improvements, the state faces the consequences of a long-term problem of deferring routine ongoing maintenance of state and K-12 facilities. This has resulted in large backlogs of deferred maintenance--a problem that is most pronounced in education facilities. The deferred maintenance backlogs total billions of dollars for K-12 schools and hundreds of millions of dollars at the universities. Any long-term solution to this problem involves not only addressing the current backlogs but also sufficiently increasing ongoing maintenance efforts in order to avoid any further buildup of deferred maintenance.
Return to California's Fiscal Outlook Table of Contents