Legislative Analyst's Office, May 1998
 |
California
Counties
A Look at Program Performance
Part IV
|
While many county programs address specific
crises, or help people in need, counties also administer programs
that benefit all Californians on a regular basis. For example,
counties build and maintain roads, operate libraries, administer
elections, provide animal control, and inspect restaurants for
sanitary conditions.
Ideally, Californians would have access to
cross-county information measuring outcomes of all of these
programs. Unfortunately, few such data are available. This final
chapter focuses on two county program areas where reasonably good
information does exist: roads and libraries.
In the case of both of these programs,
counties have significant authority to adjust the level of
services they provide their residents. For example, counties may
add a lane to a county road, open a library branch office, and
adjust their book purchasing or road maintenance budgets.
Counties typically finance their road programs with state
subventions of gas tax revenues, and their libraries with
property taxes or other county general purpose revenues.
In a state as mobile as California, traffic
safety is a major concern. California counties are responsible
for monitoring the safety of all roads in their unincorporated
areas (except state highways and freeways), and making
improvements to increase safety. For example, counties: install
lights, signals, and signs; mark lane lines; build additional
lanes; and correct dangerous curves and road conditions.
While county road safety improvements play an
important role in promoting traffic safety, a county's traffic
accident rate is related to other factors as well. These factors
include driver behavior, the availability of alternate routes,
climate, and the level of traffic enforcement. All in all, county
road safety improvements probably lower a county's accident rate
at the margin, and help explain some of the large differences
among county accident rates.
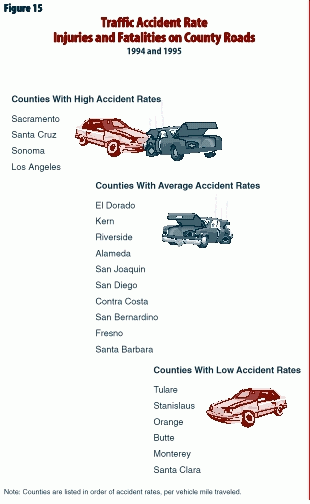
Figure 15 displays the traffic accident
rate on county roads for the 20 counties with the most miles
traveled on county roads. The figure indicates whether each
county's accident rate is above, at, or below the statewide
average. Non-injury-causing accidents are not reflected in the
figure. The accident rate of the highest county on the figure
(Sacramento) is four and a half times that of the lowest county
on the figure (Santa Clara).
In
addition to making traffic safety improvements, counties are
responsible for maintaining most roads in their unincorporated
areas. To maintain a road's surface quality, counties
periodically add seal coats and repave. When pavement is not well
maintained: riding comfort is diminished; vehicles must travel at
reduced speeds and may incur damage; and road conditions
deteriorate rapidly--often resulting in higher overall road
maintenance costs in the long run.
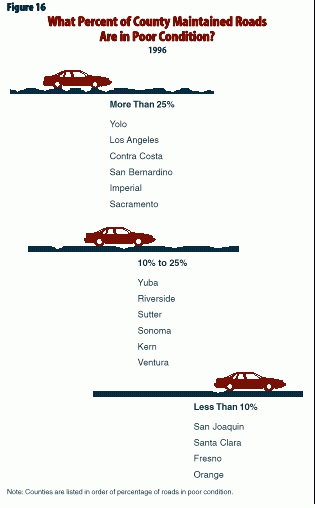
Ideally, each county (or transportation
planning agency) would compile comparable pavement quality
information. While such data are not regularly compiled, in 1996
the California Department of Transportation (Caltrans) inspected
pavement conditions on segments of over 1,000 randomly selected
county roads, excluding minor residential streets. These road
segments averaged one to two miles in length. In the case of 16
counties, we believe Caltrans inspected enough roads to estimate
the overall quality of county pavement conditions.
As Figure 16 displays, in six counties
more than 25 percent of county roads were in poor or very
poor condition. In these cases, the pavement is so deteriorated
that it has large potholes, deep cracks, or signs of pavement
distress across at least 50 percent of the surface. In
contrast, less than 10 percent of the roads in four other
counties are in such a deteriorated condition. In reviewing the
data, we note that the quality of road pavement often appears to
be correlated with better road safety.
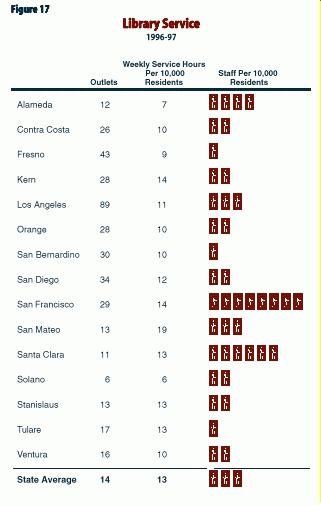
Most counties have a public library department
organized under the state's County Free Library Law. These
libraries provide services to county residents not served by a
city or special district library.
Counties have great discretion in operating
their libraries. Some counties devote most of their library
resources to a downtown library. Other counties maintain many
branch offices and send bookmobiles to rural areas. Because of
these differences, Figure 17 provides three different
"looks" at library accessibility for the 15 largest
county free library systems:
As Figure 17 indicates, San Francisco,
San Mateo, and Santa Clara Counties provide high levels of
service in terms of library staff and hours. Fresno County, in
contrast, has a lower level of staff, but more outlets.
County library systems provide many services
to meet the information and reading needs of its residents:
books, periodicals, reference materials, Internet access,
presentations, and more. While there are little data available
comparing counties on this full range of services, county free
library systems report information on the number of books and
other materials residents check out. We believe the level of
materials circulated serves as a good indicator of resident
satisfaction and library accessibility.
Figure 18 compares counties on the basis
of annual circulation per resident served. In general, residents
check out more books in counties where libraries have more staff
and are open longer, such as Santa Clara and San Francisco. Some
county library systems achieve high circulation levels, however,
with limited library availability. Solano and Alameda County
libraries, for example, both report circulating about six
documents per resident even though they have low or modest levels
of library operation, staffing, and outlets.
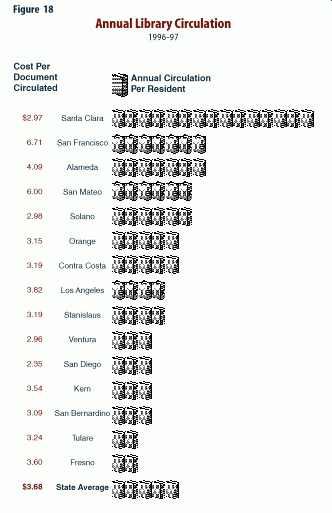
Figure 18 also provides information on
county library expenditures per document circulated. While most
county costs are in the range of $2.75 to $3.25 per document,
some county costs are considerably higher. These higher costs
could be due to higher levels of non-circulation-related library
services, higher staff salaries, lower efficiency, or other
factors.
Given the wide range of general services that
counties provide their residents, it is unfortunate that data
limitations permit inclusion of only four figures summarizing
county performance in two program areas: roads and libraries.
Ideally, data would be available on county elections, planning
and building permit issuance, transit availability, restaurant
inspection responsibilities, and more. We also would have liked
to include more complete information on county roads and library
programs, such as road congestion, travel times, and library
customer satisfaction. With more complete information, county
residents and policymakers would be better able to gauge the
quality of county services.
In reviewing the information presented in this
chapter, we find that Orange and Santa Clara Counties
consistently rate highly. Road quality in Sacramento and Los
Angeles Counties appears to be particularly poor. In Fresno
County, road quality appears high, while library services are
very low.
To our knowledge, this small report
represents California's first compilation of broad, cross-county
program performance measures. While acknowledging the limitations
of this report--that is, some program measures are imperfect,
others are missing, and others may reflect policies that a county
has already correct--edit is instructive to review the data as a
whole to see if any trends are apparent. If some counties
regularly performed better than others, the factors which
contributed to these positive outcomes could be examined.
Based on our review and discussions with
counties, we developed three plausible--yet overlapping--theories
to explain why some counties might perform better than others.
Specifically:
Theory One: Counties With
Higher Per Capita General Purpose Revenues Might Perform Better.
Counties with higher per capita general purpose revenues (money
counties may spend on programs of their own choosing) have
greater ability to expand programs to meet demand. As we discuss
in Why County Revenues Vary: State Laws and Local Conditions
Affecting County Finance, counties receive very different
levels of general purpose revenues.
Theory Two: Counties With a
Greater Percentage of High Income Residents Might Perform Better.
Counties with more high income residents may face less demand for
criminal justice, indigent health, and social service programs.
This may allow a county to "do a better job"
administering these services to a smaller proportion of their
residents, and leave more funds to pay for other county services,
such as roads and libraries. In addition, counties with more high
income residents may find it easier to raise fees, taxes, or
assessments. Even if these additional funds are not available for
general program purposes, the extra funds may relieve fiscal
pressures on a county and increase fiscal flexibility.
Theory Three: Counties With A
Smaller Proportion of Residents Needing Services Might Perform
Better. Because of differences in local economies,
demographics, and other factors, county program caseloads differ
in size. Differences in county caseload sizes do not always
reflect differences in resident incomes. Counties with lower
demand for indigent health, social services, and criminal justice
services may find it easier to achieve successful outcomes.
We examined the performance data in
conjunction with information on county general purpose revenues,
resident income, unemployment, and caseload size. In many cases,
our sample size was too small to perform a statistical analysis,
so our comments are drawn from a qualitative evaluation of the
data, unless stated otherwise.
Overall, we found some support for the
theory that counties with more high income residents perform
better. Specifically, the two counties that typically ranked the
highest in our report (San Mateo and Santa Clara), as well as two
counties which ranked highly but for which data were limited
(Marin and San Francisco), stand out as the state's counties with
the wealthiest residents. We note that three of these four
counties also have relatively low social service and criminal
justice program caseloads (San Mateo, Santa Clara, and Marin),
and three counties appear to have higher than average per capita
general purpose revenues (San Mateo, Marin, and San Francisco).
Beyond these four very wealthy counties,
however, we found that the relationship between county
performance and resident income, per capita general purpose
revenues, and caseload became much less clear. That is, some
counties with low resources, poor people, and high caseloads
performed much better than would be expected. Examined
statistically, we found only one measure in which program
performance correlated positively with income or county
revenues--library circulation.
Virtually every county performed well in
at least one program area. For example, although Merced and
Fresno Counties have low per capita general purpose revenues,
rising crime rates, and high unemployment rates, both counties
showed considerable success in their child protection, welfare,
and child support programs. Los Angeles and Sacramento Counties
posted large declines in the rate of violent crime, and provided
a relatively high level of sheriff and/or probation services. San
Diego, Orange, Riverside, and San Bernardino Counties rated well
across several measures, a level of performance which is
particularly notable given the very low level of per capita
general purpose revenues available to these counties. Alameda and
Contra Costa Counties had more success than many other urban
counties in collecting child support payments and in road safety.
While this report poses more questions
than it answers, the process of developing this report resulted
in three conclusions.
First, in order to undertake a more
complete review of county program performance, and to "sort
out" the influences of caseload characteristics and other
variables, California needs more information about county
programs. Throughout the book we identify the type of information
needed and the appendix provides a summary of the information
needed to assess county performance in administering programs of
statewide interest. We note that in several program areas--drug
and alcohol, mental health, and child welfare
services--additional data collection efforts are underway.
Second, there is probably some
relationship between county program performance and resident
income, county revenues, and caseload size. The extent of this
relationship, however, will not be apparent until the state has
better measures of county program performance.
Finally, quality county program
management matters. In developing this report, we found many
examples of exemplary county efforts. Sometimes, counties
achieved considerable program successes despite significant
resource limitations and caseload demands. Given the importance
to California of successful county programs--these efforts are
particularly commendable.
Return to California Counties Table of
Contents
Return to LAO Home Page