Legislative Analyst's Office, May 1998
 |
California
Counties
A Look at Program Performance
Part I
|
- A Permanent Home Within Four Years
- How Often Do Children in Foster Care Change Homes?
- How Often Do Children Reenter Foster Care?
- Overall Child Protection Index
- Where Are Welfare Rates Declining
Fastest?
- Collecting Child Support
- Helping People With Addictions
- Waiting for Substance Abuse
Services
- Drug and Alcohol Deaths
- Which Counties Have the Most Crime?
- Where Has Violent Crime Fallen Most?
- When Jails Are Crowded
- Sheriffs' Services
- Supervising Offenders
- How Safe Are County Roads?
- Road Conditions Ahead
- Is the Library Open?
- Books in Circulation
Californians depend on counties for
many important services. Counties prosecute, jail, and supervise
most criminals; operate libraries; work to protect children from
abuse; help residents with health, mental health, and substance
abuse problems; fix potholes; and serve their residents in many
other ways. For many programs, counties serve as local agents to
implement the state's priorities. Counties frequently administer
their programs under guidelines in state law.
Despite the importance of county
programs, there is little information on their results, or
"outcomes." This shortage of information makes it
difficult for policymakers, residents, or county administrators
to gauge a county's performance, or to observe changes in county
performance levels over time.
This report compiles the best
information available on county programs--and gives Californians
a snapshot view of county performance. Whenever possible, this
report displays information comparing the outcomes of county
programs. For some programs, however, information on program
outcomes is not available, and the report instead displays
information on key county inputs (such as staffing levels or
treatment slots) that we believe are associated with program
success. Finally, for some programs, such as mental health, adult
protection, and public health, we could not obtain satisfactory
information on county outcomes or inputs. In these
cases, the report does not provide information on the program.
In selecting the program outcome and
input measures included in the report, we focused on measures
where differences in county management or policies explained at
least part of the results. In many cases, we performed
statistical analyses to examine the relative influence of
demographic and economic factors, and other factors beyond a
county's control.
This report's size reflects the small
amount of information currently available on county performance.
Given the data limitations and other extenuating factors, we
caution the reader from assuming that differences in county management
fully explain every county's performance. Specifically, a
county's relative ranking under some of the report's performance
measures may be influenced by the county's demographic
characteristics and access to revenues. As we described in a
companion report, Why County Revenues Vary: State Laws and
Local Conditions Affecting County Finance, counties differ
greatly in their revenues and program demand. In addition,
because of information limitations, some important county
activities are not included in this report, or are measured
imperfectly.
While recognizing these limitations, we
publish this report in the hope of launching a dialogue about the
outcomes of important county programs. It is also our hope that
someday Californians may have a more complete report on county
program performance.
The report is presented in a graphical
format, with chapters summarizing county program performance in
four program areas: children's programs, social services and
health, criminal justice, and roads and libraries. The charts
typically summarize data for the state's 15 to 20 most populous
counties, or the most populous counties for which reliable data
are available. In addition, the data supplement in the back of
the report includes available data for the remaining counties.
The report's final chapter presents our findings on county
performance as a whole.
California's county-administered
Children's Services and Foster Care programs are designed to
protect children from abuse and neglect. When a case of abuse is
confirmed, counties work to help the family in crisis and may
place the child temporarily--or permanently--in another home.
While
county child protection programs operate under many federal and
state laws and guidelines, counties have some discretion over the
level of services provided and how their programs are
administered.
In our
analysis, we relied primarily on data compiled by the Child
Welfare Research Center at the University of California at
Berkeley (in Performance Indicators for Child Welfare
Services in California: 1996). We note that these measures
pertain only to program activities after the county has made
the decision to remove the child from the parents' home. If
there were data on those cases where the county did not
remove the child from the home after a report of abuse or neglect
and then there was subsequent maltreatment, a more complete
picture of county performance in child protection would be
available.
The next
three figures compare county performance in (1) moving children
from temporary foster care to a permanent home within four years,
(2) providing children in foster care with stable placements, and
(3) reducing the likelihood that children who are reunified with
their families will again be victims of abuse or neglect (that
is, the rate of recidivism). A fourth figure combines county
performance scores in the aforementioned areas of permanence,
stability, and recidivism into an overall index of performance in
child protection.
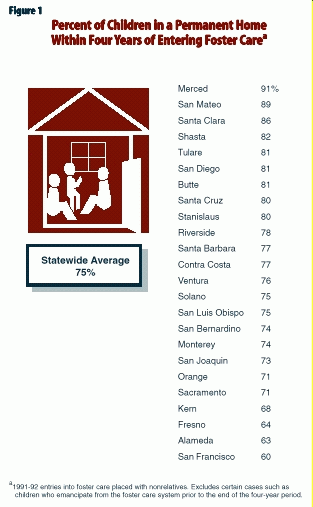
One of the priorities of child
protection programs is to move children expeditiously from
temporary foster care to a secure, stable ("permanent")
home. This could be either reunification with the family, or
placement with an adoptive family or guardian. Figure 1
compares county scores on a permanence index (as developed by the
University of California at Berkeley Child Welfare Research
Center) for children who first entered foster care in 1991-92 in
24 of the largest counties. Los Angeles County was dropped from
the sample because of incomplete data. The index is constructed
from data on children whose time in placement was primarily spent
in nonrelative foster care. This is because many children placed
in long-term foster care with relatives are in secure, stable
homes.
Figure 1 indicates that there is
a wide range in county performance in moving children from foster
care to a permanent home, ranging from a high of 91 percent in
Merced County to a low of 60 percent in San Francisco County. The
statewide average is 75 percent.
It is
widely accepted in the child development field that multiple
foster care placements create instability, which can be
detrimental to a child's development. Figure 2 reports the
proportion of children experiencing no more than two different
placements in their first spell in foster care, among those
children who entered foster care in 1989-90 and remained in care
for at least six years. The figure shows 14 large counties for
which reliable data are available. Los Angeles County was dropped
from the sample because of incomplete data.

San Francisco had the most
stable foster care placements among these large counties, with 70
percent of children experiencing no more than two different
placements in the first six years in foster care. By contrast,
San Diego County had a rate of 40 percent, meaning 60 percent of
their foster children experienced three or more placements in the
first six years of their first spell in foster care.
We note
that there may be an inverse relationship between the measures of
permanence and stability. That is, counties that score well on
the permanence index will have relatively few children remaining
in foster care at the end of six years, but those children who do
remain may be particularly difficult to maintain in a stable
placement. This may result in a number of changes in their home
placements. Finally, we note that the stability measure is
calculated using data on both relative and nonrelative
placements, and that children placed in nonrelative foster care
tend to have less stable spells in foster care than is implied by
the overall measure reported here.
Figure 3 shows the
"recidivism" rates for the 25 largest counties.
Specifically, this figure reports for those children who left
foster care due to family reunification or placement with a
guardian from 1993 through 1996, the proportion who reentered
foster care within three years, or by the end of the sample
period (December 31, 1996).
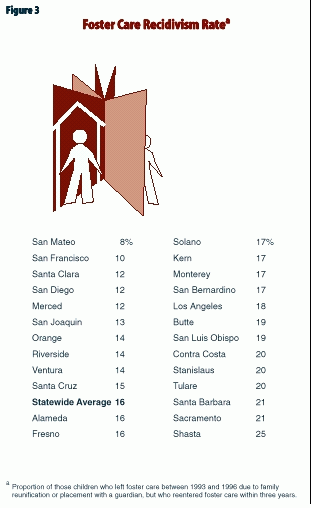
San Mateo County has the lowest
recidivism rate among the 25 largest counties in California (8
percent); Shasta's recidivism rate is more than three times
greater (25 percent). The statewide average is 16 percent.
Some care should be used in
interpreting the recidivism measure. First, the extent to which
the event that precipitated reentry involved abuse to the child
is not known. Second, the measure reported here understates
the true rate at which children reenter care within three years
of reunification. This is because, for some children in the
sample, three years had not elapsed between reunification and the
end of the sample period. Finally, we note that the recidivism
measure is calculated using data on both relative and nonrelative
foster care placements. The reentry rates for children placed in
nonrelative foster care tend to be higher than the rates for
children in relative placements, so the measure reported here understates
the reentry rate for children in nonrelative placements.
It is useful to compare
simultaneously, county performance on the measures of permanence
and recidivism. A few counties--in particular San Mateo, but also
Merced, Santa Clara, and San Diego--do well on both measures.
These counties appear to have particularly effective child
protection programs based on these measures: they move children
quickly from foster care to a permanent home, and relatively few
children reunified with their families return to foster care. On
the other hand, Sacramento and Kern Counties are below average on
both measures: children in these counties move to a permanent
home relatively slowly, and a relatively high proportion of those
children reunified with their families return to foster care.
Figure 4 compares county scores
on a child protection index that combines the permanence,
stability, and recidivism performance measures. A county's index
score is the weighted average of its scores in each performance
area, relative to the highest performing county. In other words,
if a county had the highest score on each of the three
performance measures, then its child protection index score would
be 100 percent; if the county's score in each area were 75
percent of the highest county score, then its index score would
be 75 percent.
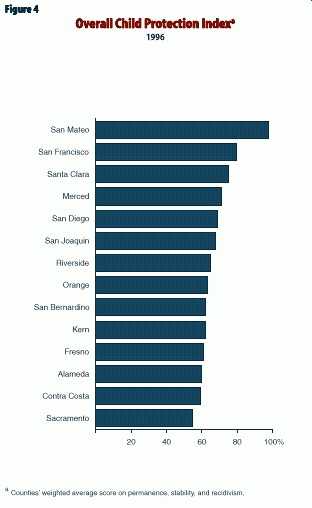
We weighted performance in
recidivism twice as heavily as performance in each of the areas
of permanence and stability because we believe that
recidivism--which is related directly to the act, or threat of,
abuse or neglect--represents a particularly important program
outcome.
San Mateo County had the highest
overall level of performance in child protection and clearly
stood out among the 14 counties shown in Figure 4, scoring at or
near the top in permanence, stability, and recidivism. Sacramento
County had the lowest overall level of performance.
Measuring differences in child
well-being due to county service interventions is a very
challenging task. The best available performance measures reflect
the actions of a county after it decided to remove a
child from the parents' home. Currently, there is relatively
little information about the quality of county
"front-end" decisions. If there were data on subsequent
maltreatment in the cases where the county did not
remove the child from the home after a report of abuse or
neglect, then a more complete snapshot of county performance in
child protection would be available.
We note that county performance
may be influenced, to some extent, by demographic variables that
are beyond the control of the county. However, in our statistical
analysis we found no significant relationship between county
performance in child protection and demographic variables,
including poverty, unemployment, crime, unwed births, ethnicity,
and median county income.
Return to California Counties Table
of Contents
Continue
to California Counties Part II--Social Services and Health
Return to LAO Home Page