
 |
California CountiesA Look at Program PerformancePart III |
Although the programs counties operate are crucial to California's criminal justice system, there is little information on county program outcomes. This is because, in part, central missions and goals of most programs have not been clearly defined. In addition, some criminal activities within counties are heavily affected by actions of others, particularly cities within the counties, and demographic factors beyond a county's control. For these reasons, it was difficult to assemble information assessing how well counties are operating their criminal justice programs. In this chapter, we review (1) data on key county criminal program inputs and activities, and (2) some performance measures that, while less than perfect, are the best that are available.
Using crime rates as a performance measure of county criminal justice systems has significant limitations. First, crime rates reflect residents' reports of crimes to law enforcement agencies, and studies have shown residents generally underreport crime. Second, law enforcement agency data often are not audited for accuracy. Third, some factors related to crime, such as the demography of the population, are not controllable by counties, and other factors, such as the availability of jobs, are affected by entities other than just the counties. Finally, one of the most significant forces in fighting crime--city police departments--are not under the control of the county at all. Despite these limitations, we believe that crime rates should be considered when assessing the performance of county criminal justice programs. This is because the data tell something about the overall success of county programs (for example, prevention and rehabilitation) which contribute to the level of crime in a county.
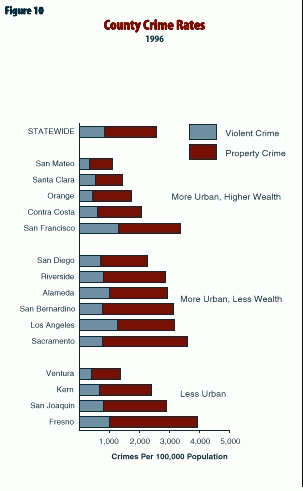
The 1996 crime rates for large counties are shown in Figure 10. For purposes of comparison, we grouped counties based on their extent of urbanization and per capita income. As Figure 10 shows, there is substantial variation within each of the categories.
Ideally, to assess individual county performance, changes in violent crime rates would be examined in conjunction with factors that are within the control of the county (such as county probation and sheriff activities, and prevention and rehabilitation programs). The analysis would exclude factors over which counties have no control (such as demographics and the activity of city police departments). Data limitations, however, preclude such an analysis. Thus, Figure 11 compares overall changes in violent crime among large counties.
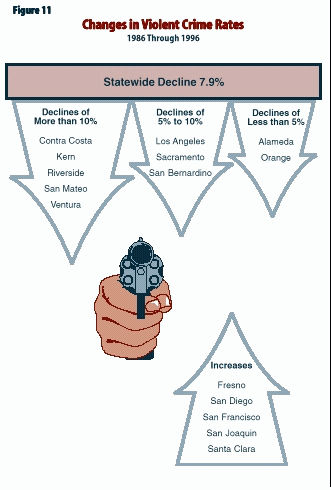
As the figure shows, violent crime in the state declined over ten years by about 8 percent. Violent crime dropped in most counties. Declines among the large counties ranged from 1.4 percent (Alameda) to 46 percent (San Mateo). In counties where the violent crime rate rose, the increases varied from less than 1 percent (San Francisco) to 17 percent (Santa Clara). The two counties that experienced the most significant decline and increase--San Mateo and Santa Clara, respectively--had relatively low violent crime rates at the beginning of the period of comparison.
Ideally, to assess county performance, the likelihood of a released offender (or person awaiting a trial) committing another crime would be examined. Because these data are not available, Figure 12 displays for the 15 largest counties, information pertaining to oneaspect of county jail programs: county capacity to house offenders and people arrested. Specifically, the left side of the figure shows the number of people (per 10,000 people in the county's population) whom the county released from jail due to lack of jail space. While there is considerable variation among counties in this rate of release, counties statewide released about 29,000 inmates each month in 1997 - 7,000 inmates awaiting trial and 22,000 inmates before the end of their sentences. Some jails report that sentenced inmates served less than 20 percent of their sentences before being released due to jail overcrowding.
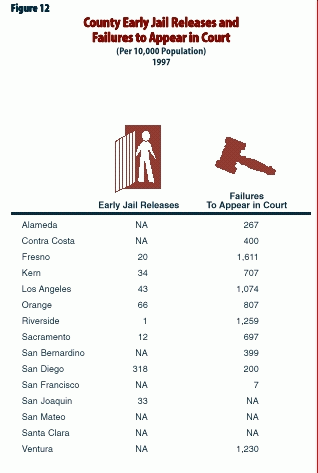
The right side of the figure reflects another measure relating to jail overcrowding: the rate at which individuals released from jail before trial (or who were never placed into jail due to overcrowding) failed to appear in court and have not been located ("unserved warrants"). Statewide, there are more than 2.6 million cases of these failures to appear in court. Ten percent of these cases involve felony charges.
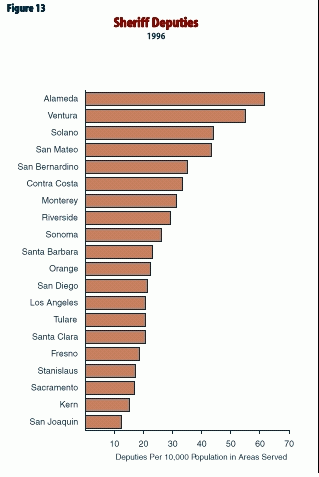
Ideally, to assess the performance of county sheriff operations, the relative success of the county sheriff in preventing or deterring criminal activity through law enforcement and community-based anticrime activities would be examined. Given that such cross-county information is not available, the facing figure shows a key county criminal justice program "input" related to the sheriff--the number of sheriff's deputies per 10,000 population in the area served by sheriff patrol (residents of the county's unincorporated areas and contract cities).
As Figure 13 illustrates, for the 20 largest counties, the variation in number of sheriff deputies is considerable. In general, we find little correlation between the size of a county and the number of deputies.
Specifically, counties supervise almost three-quarters of all adults convicted of a felony. In some cases, this supervisory role begins directly after conviction; in other cases, counties supervise adult offenders after they are released from county jail. In 1996, county probation departments supervised almost 290,000 adult offenders.
County probation departments have broader responsibilities with regard to juvenile offenders. In addition to supervising juvenile offenders released into the community, county probation officers supervise the detention of most juvenile offenders. Typically, young offenders are detained in their homes, group or foster care homes, juvenile halls, ranches, or camps.
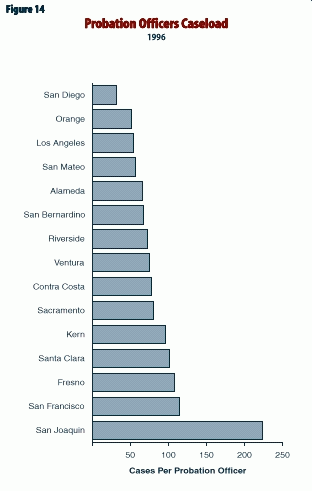
Ideally, to examine county probation department performance, the recidivism data of adult and juvenile offenders who have been on probation would be examined. Such information, however, is not available at the state level. Thus, Figure 14 provides information for the 15 largest counties on a key program inputthe adult and juvenile caseloads per probation officer. In general, counties where probation officers supervise many adults or juveniles are less likely to provide the type of individual attention necessary to alter future criminal behavior. In reviewing the information on probation officers caseload, we note that some counties that released many people from jail early offer a higher than average level of probation supervision (San Diego, Orange, and Los Angeles).
The most notable measure of criminal justice program success that California does not have is the recidivism rate of criminal offenders--the rate at which offenders released from custody commit new criminal offenses. Recidivism rates indicate how successful county criminal justice systems are at rehabilitating offenders (for example, through drug treatment, employment, or education programs) and deterring them from committing new crimes (by punishing and dissuading). Although many county programs collect recidivism data, the data are generally of poor quality and almost impossible to compare across jurisdictions. Collection of a consistent, uniform set of offender recidivism data would go a long way to measuring criminal justice program performance.
In reviewing the information on criminal justice programs in this chapter, some patterns emerge.
Few counties that consistently scored well in terms of county criminal justice program inputs (jail
space, failure to appear in court, number of sheriffs, and probation officers caseload) failed to
post a decline in violent crime rates over the last decade. Of counties with declining violent
crime rates, San Mateo was notable with a 46 percent decline. Our data show that San Mateo had
virtually no early releases from jail or failures to appear in court, and a very low level of
caseloads assigned to their probation officers. Conversely, Fresno County ranked poorly in terms
of each of the public safety input measures, has a high crime rate, and posted a 7.3 percent
increase in violent crime over the last decade.
Continue to California Counties Part IV--Roads and Libraries