
|
|
1998 Cal Facts
|
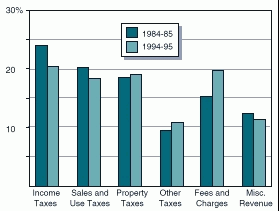
Share of Total Revenues by Source
| State Taxes | Current Rate | Comments/Description |
| Personal Income | Marginal rates of 1% to 9.3% (7% AMTa) | Married couples with gross incomes of $21,246 or less need not file. The top rate applies to married couples' income in excess of $67,346. |
| Sales and Use | 6%b | Applies to final purchase price of tangible items, with exemptions for food and certain other items. |
| Bank and Corporation General Corporations Financial Corporations | 8.84%c (6.65% AMT) 10.84% (6.65% AMT plus adjustment factor) |
Applies to net income earned by corporations doing business in California. For financial corporations, a portion of the tax is in lieu of certain local taxes. |
| Vehicle Fuel | 18� per gallon of gasoline or diesel fuel | Tax is collected from fuel distributors or wholesalers with equivalent taxes levied on other types of vehicle fuels. |
| Alcohol and Cigarette
Wine and beer Sparkling wine Spirits Cigarettes |
20�/gallon 30�/gallon $3.30/ gallon 87�/pack |
Tax is collected from manufactures or distributors. Similar taxes are collected on sale of other tobacco products. |
| Estated | 0.8% to 16% | The estate tax is a "pick-up" tax to take advantage of the maximum state credit allowed against the federal estate tax, at no net cost to taxpayers. |
| continued |
| State Taxes | Current Rate | Comments/Description |
| Horse Racing License Fees | 0.4% to 2% | Fees/taxes are levied on amounts wagered. Rate is dependent on type of racing and bet, and where the wager is placed. |
| Insurance | 2.35% | Insurers are subject to the gross premiums tax in lieu of all other taxes except property taxes and business license fees. |
| Local Taxes | Current Rate | Comments/Description |
| Property | 1% (plus any rate necessary to cover voter-approved debt) | Tax is levied on assessed value (usually based on purchase price plus the value of improvements and a maximum annual inflation factor of 2%) of most real estate and various personal and business property. |
| Local Sales and Transaction | 1.25% to 2.5% | Collected with state sales and use tax. Revenues go to cities, counties and special districts. |
| Vehicle License Fees | 1.5% | Tax is applied to depreciated purchase price. It is collected by the state and distributed to cities and counties. |
| Other Local | Varies by jurisdiction | Types of taxes and rates vary by jurisdiction. Includes utility users tax, business license tax, and transient occupancy taxes. |
| a Alternative Minimum Tax. | ||
| b Includes rates levied for state-local program realignment and local public safety. | ||
| c A 1.5 percent rate is levied on net income of Subchapter S corporations. | ||
| d Inheritance and gift taxes have been repealed but still apply to gifts and deaths prior to 1982. | ||
Amounts Per $100 of Personal Income
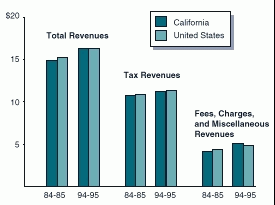
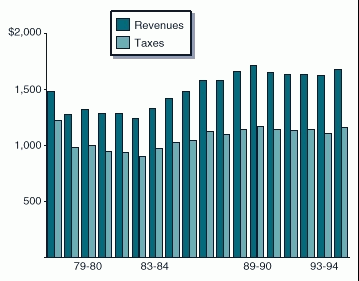
1977-78 Dollars
| Measure/ Election |
Major Provisions |
| Proposition 13/ June 1978 |
|
| Proposition 4/ November 1979 |
|
| Proposition 6/ June 1982 |
|
| Proposition 7/ June 1982 |
|
| Proposition 37/ November 1984 |
|
| Proposition 62/ November 1986 |
|
| continued |
| Measure/ Election | Major Provisions |
| Proposition 98/ November 1988 |
|
| Proposition 99/ November 1988 |
|
| Proposition 162/ November 1992 |
|
| Proposition 163/ November 1992 |
|
| Proposition 172/ November 1992 |
|
| Proposition 218/ November 1996 |
|
| Proposition 10/ November 1998 |
|
| State Level | Legislative Approval | Voter Approval |
| Taxes | 2/3 | None |
| General obligation bonds | 2/3 | Majority |
| Other debta | Majority | None |
| Fees | Majority | None |
| Local Level | Governing Body Approval | Voter Approval |
| City or county "general" taxes (revenues used for unrestricted purposes) | 2/3 (Majority for charter cities) |
Majority |
| City or county "special" taxes (revenues used for specific purposes) | Majority | 2/3 |
| All school or special district taxes | Majority | 2/3 |
| General obligation bonds | Majority | 2/3b |
| Other debta | Majority | None |
| Property assessments | Majority | Majority of affected property owners. Votes weighed by assessment liability |
| Property--Related fees | Majority | 2/3 of voters, or majority of affected property ownersc |
| Fees--All other | Majority | None |
| a Includes revenue and lease payments bonds and certificates of participation. | ||
| b Exception: Article XVI, Section 18 specifies that bonds used for repairing or replacing unsafe public school buildings can be approved by a majority of voters. | ||
| c No vote required for gas, electric, water, sewer, refuse, or developer fees. | ||
| Counties | 58 |
| Cities | 471 |
| Special districts | 4,816 |
| K-12 school districts | 999 |
| Community college districts | 71 |
| Total | 6,415 |
| Large Counties (1996-97) |
Per Capita Property Taxes | Large Cities (1995-96) |
Per Capital Property Taxes |
| Los Angeles | $126 | Oakland | $129 |
| Contra Costa | 99 | Los Angeles | 127 |
| Alameda | 99 | Long Beach | 122 |
| Santa Clara | 95 | Sacramento | 105 |
| Sacramento | 88 | San Diego | 94 |
| San Diego | 81 | Fresno | 81 |
| San Bernardino | 61 | San Jose | 61 |
| Riverside | 59 | Anaheim | 54 |
| Orange | 40 | Santa Ana | 49 |
| Statewide County Average | $106 | Statewide City Average | $78 |
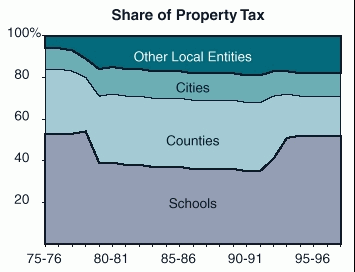
Four factors explain the large differences among property tax receipts. Cities and counties tend to receive more property taxes if they:
| Year | Description |
| Property Tax Shifts | |
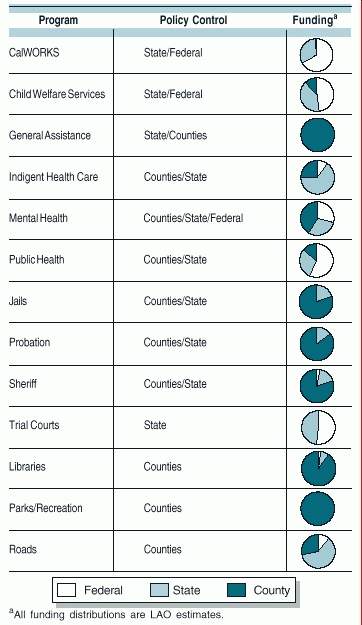
| 1992 and 1993 | Ongoing Revenue Shifts. State shifted property taxes from counties and other local entities to schools in order to reduce state education costs. Subsequently, these reduced county revenues have been substantially offset in the aggregate by various mechanisms, including funding for public safety (Proposition 172 sales tax revenues, COPS funding, and changes to trial court funding) and general assistance mandate relief. |
| Health and Social Services | |
| 1991 | Realignment. Shifted authority from the state to counties, and increased counties' share of costs, for many health and social services programs. Provided new revenue sources to counties to offset increased county costs. |
| 1997 | Welfare Reform. Provided counties with more flexibility regarding (1) delivery of welfare-to-work services and (2) recipient participation requirements. Provided fiscal incentives for counties to assist recipients in getting jobs. |
| Trial Court Funding | |
| 1988 | Brown-Presley Act. Increased state funding for county-operated trial courts, through the establishment of block grants. |
| 1991 | Realignment. Increased state funding of trial courts, as well as increased state revenues from court fines. |
| 1997 | Spending Cap. Placed cap on county expenditures for trial courts, resulting in future increases in state costs. |
| 1998 | Reduced County Share. Further reduced the required county contributions for trial court funding. |
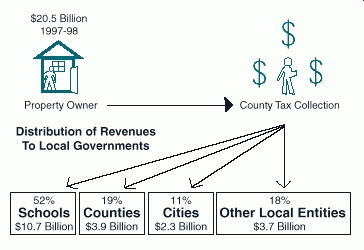
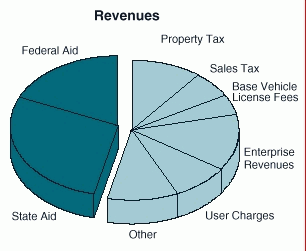
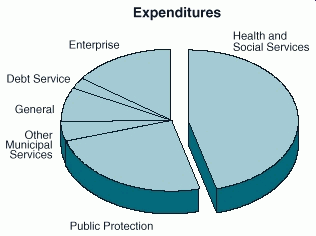
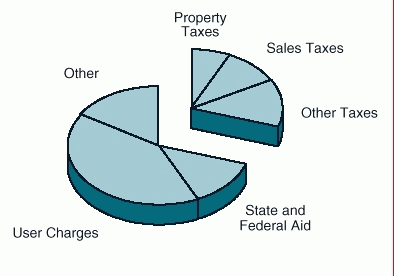
1995-96 Revenues (excluding San Francisco)
Continue to 1998 Cal Facts State Finances
Return to 1998 Cal Facts Table of Contents