Legislative Analyst's Office, December 1998
|

|
1998 Cal Facts
State Finances
|
State Revenues Anchored by Income and Sales Taxes
1998-99
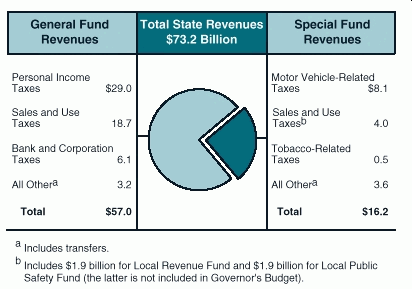
- General Fund revenues account for over three-quarters of total state revenues.
- Personal income taxes are the largest single revenue source--over half of General Fund revenues and almost 40 percent of total revenues.
- Sales and use taxes are the next largest revenue contributor, comprising one-third of General Fund and one-quarter of special fund revenues.
- Special funds are used for specific purposes, with motor vehicle-related taxes the largest component.
Underlying General Fund Revenue Base Has Resumed Growth
(In Billions)
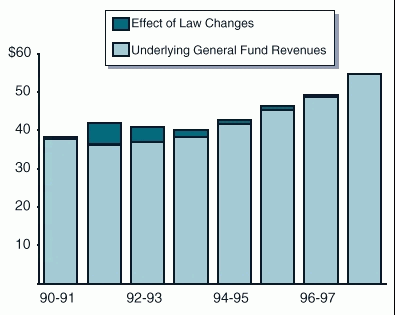
- The figure shows total General Fund revenues and the contribution from both underlying trends and tax and revenue law changes.
- The underlying General Fund revenue base (the base with law changes eliminated) was stagnant throughout the early 1990s, but then began to recover in
1994-95.
- By 1997-98, tax and revenue law changes were a small part of total General Fund revenues.
California's Income Tax Structure Is Highly Progressive
1996
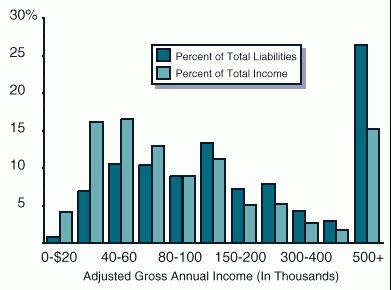
- California has a highly progressive income tax structure--that is, taxes as a percent of income rise as one's income increases.
- In 1998, personal marginal income tax rates ranged from 1 percent to 9.3�percent, with an alternative minimum tax (AMT) rate of 7 percent.
- The top 4 percent of taxpayers--those with annual incomes in excess of $150,000accounted for 30 percent of taxable income and about half of total tax
liabilities.
Capital Gains--An Increasingly Important Revenue Source
Capital Gains Realizations (In Billions)
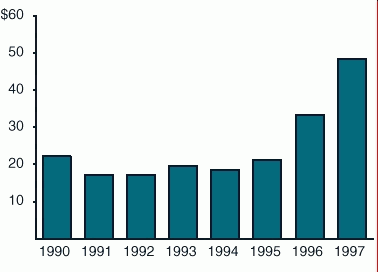
- Capital gains account for approximately 11 to 12�percent of personal income tax liabilities.
- Capital gains realizations have increased every year since 1994. However, capital gains grew especially rapidly in 1996 and 1997--by 57�percent and
45�percent, respectively.
- This strong growth was a key factor in causing higher-than-expected revenues in 1996-97 and 1997-98.
- The year-to-year growth of capital gains can be quite erratic and is very sensitive to economic conditions.
Sales Tax Rates Vary by County
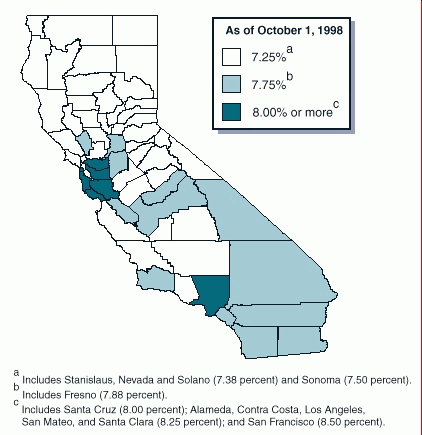
- Sales tax rates vary by county because of the optional sales taxes which counties can choose to levy.
- Existing sales tax rates range from a low of 7.25 percent in counties with no local option taxes, to a high of
8.5 percent in the City and County of San Francisco.
State Spending Has Recovered Following Recession
Real, Per-Capita Spending (1998 Dollars)
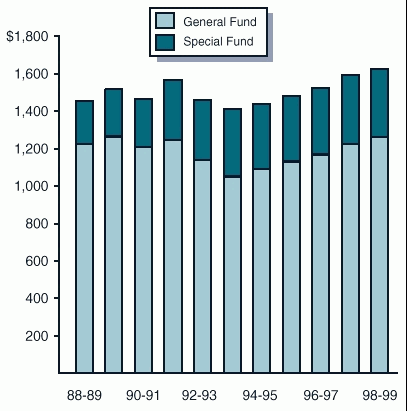
- For 1998-99, total real per capita spending will be $1,627.
- Between 1988-89 and 1998-99, this spending grew at a 1.1�percent annual rate. Real General Fund spending per person grew at a 0.3�percent rate.
- Real per capita spending fell between 1991-92 and 1993-94, due to the emergence of severe budgetary problems associated with the recession. With the
resumption of economic growth following the recession, spending growth resumed.
Education, Health, and Social Services Dominate Spending
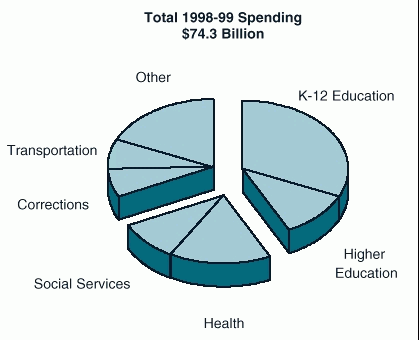
- Education's share of total spending is about 44�percent ($32.1�billion). Education's share of General Fund spending is higher--55�percent.
- Together, education, health and social services, and corrections account for 75�percent of total state spending in 1998-99.
Annual Cost Per Participant Varies Widely Among Major Programs
1998-99
|
Number of Participants
(In Millions) |
Average Cost Per Participant |
| General Fund |
Total Government |
|
|
|
|
| Corrections |
| Prison |
0.2 |
$21,000 |
$21,000 |
| Youth Authority |
0.01 |
34,000 |
34,000 |
| Education--studentsa |
| K-12 |
5.5 |
$4,100 |
$5,700 |
| UC |
0.2 |
15,800 |
15,800 |
| CSU |
0.3 |
8,000 |
8,000 |
| Community Colleges |
1.0 |
2,200 |
3,700 |
| Health and Welfare--beneficiaries |
| Medi-Cal |
4.8 |
$1,289b |
$2,738b |
| CalWORKs |
1.9 |
947 |
2,824 |
| SSI/SSP |
1.0 |
2,129 |
5,803 |
| Foster Care |
0.1 |
3,680 |
15,100 |
|
|
|
|
| a Does not include federal funds or lottery funds. |
| b Include Medi-Cal spending in Healthy Families program. Excludes disproportionate share hospital funding. |
|
|
|
|
- The costs shown are averages. The range of individual costs is especially large in the Medi-Cal program. On average, each Medi-Cal beneficiary costs
$2,738, but nursing home patients cost about $32,700 annually.
Spending Growth Varies By Program Area
1988-89 Through 1998-99
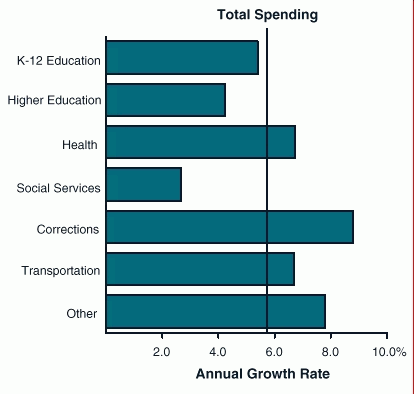
- Total state spending has increased at an average annual rate of 5.8�percent over the last ten years.
- However, spending growth varied from a low of 2.7�percent for social services programs to a high of 8.8�percent for corrections.
- The growth rate of state spending for K-12 education (which is just below the state average) reflects budget actions that shifted a larger share of local
property taxes to schools in order to reduce state spending dictated by Proposition�98. Including these property tax shifts would increase the K-12 growth
rate to 7�percent.
Most Federal Spending Occurs Outside the State Budget
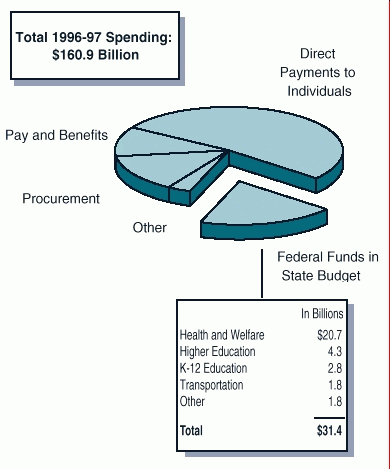
- Of total federal spending in California in 1996-97 (roughly $161 billion), only about 20�percent ($31�billion) flowed through the state budget to support state
programs.
- Health and social services spending comprises roughly two-thirds of the federal spending that passes through the state budget. Education accounts for
another 23�percent.
Continue to 1998 Cal Facts Program Trends Part I
Return to 1998 Cal Facts California's State Fiscal Structure
Return to 1998 Cal Facts Table of Contents
Return to LAO Home Page


