Legislative Analyst's Office, December 1998
 |
1998 Cal Facts
Program
Trends
Part I
|
|
K-12 School Revenues
1997-98
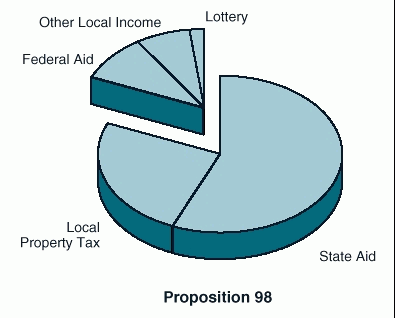
- Proposition 98 is the shorthand term for the state's constitutional minimum spending requirement for K-14 education. This annual spending guarantee is met
from two revenue sources: state aid and local property taxes.
- The state provided just over half of all school revenue in 1997-98, while local government sources (property taxes and other local income) contributed 33
percent.
- The remaining revenues came from the federal government (9 percent) and the state lottery (2 percent). Lottery revenues provide around $116 per student.
Seventy-five percent of lottery funds are used towards teacher salaries and benefits.
K-12 School Expenditures
1997-98
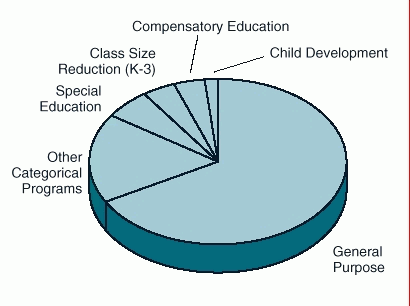
- School "revenue limits" are general purpose funds--supported by both state funds and local property taxes--that provide the resources for basic school
programs. These funds account for almost two-thirds of all school expenditures.
- Remaining school expenditures provide for specific educational needs--such as special education, transportation, and class size reduction. These
"categorical" funds constitute around one-third of school spending.
The Average Cost of a California School
1995-96
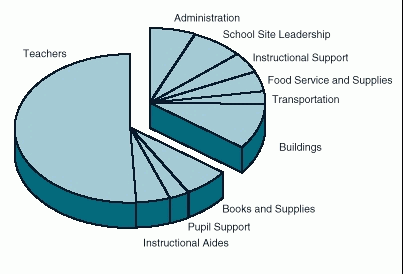
- The costs of services delivered in the classroom account for about two-thirds of K-12 costs. Over half of the total costs are for teachers, with an additional 14
percent for instructional aides, pupil support personnel (counselors, psychologists, nurses), and books, supplies and equipment.
- Nonclassroom school site costs comprise 29 percent of school spending. These costs consist of school site leadership (administrators and clerical support),
building maintenance, instructional support, and other expenses.
- Administration, which consists of district administration and county and state oversight, accounts for 6 percent of the costs of an average school.
Growth in K-12 Enrollment Will Slow Significantly
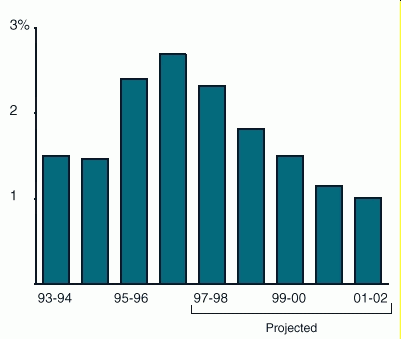
- K-12 enrollment is projected to increase by 1.8 percent in 1998-99, bringing total K-12 enrollment to 5.7 million students.
- Growth rates in each of the next three years are expected to decrease to between 1 percent and 1.5 percent. This is in contrast to the last three years, when
rates exceeded 2 percent.
- Each 1 percent increase in K-12 enrollment requires an increase of approximately $240 million (General Fund) to maintain annual K-12 expenditures per
pupil.
Proposition 98 Funding Per Student Continues to Rise
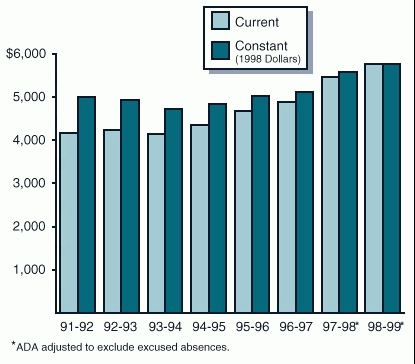
- California's spending per pupil (adjusting for inflation) continues to rebound from lows during the recession.
- In 1998-99, Proposition 98 spending per pupil increases to $5,735. This represents an increase of $281, or 5.2 percent, above 1997-98.
- Despite recent increases in per-pupil spending, California funding per pupil remains below the national average.
Demand for New Teachers Increases Significantly
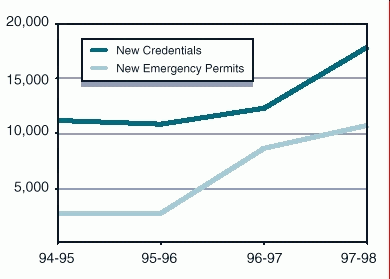
- Implementation of kindergarten through grade three class size reduction has significantly increased the need for teachers.
- The number of teachers with new emergency permits rose significantly in 1996-97 to meet the immediate need for teachers due to class size reduction.
- Increases in new teaching credentials include recent graduates from teacher preparation programs as well as past emergency permit holders and out-of-state
teachers.
Higher Education Enrollment Growth To Be Moderate and Sustained
Average Annual Headcount Growth, by Decade
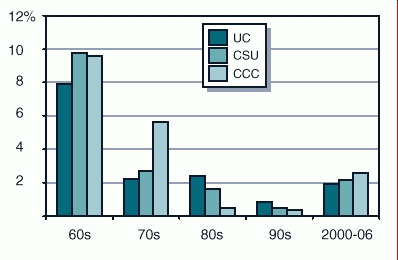
- The Department of Finance projects that total headcount enrollment at UC, CSU, and the community colleges in 2006 will be 417,000 higher than in the
peak enrollment year of 1991. This would represent an annual increase of 1.2�percent from 1991 through 2006.
- By comparison, enrollments grew by an average of 2.7�percent per year from 1970 through 1991.
- By historical standards, projected enrollment growth into the 21st century will be moderate and sustained.
Resources for Higher Education at Historic Highs
Inflation Adjusted Spending Per Student
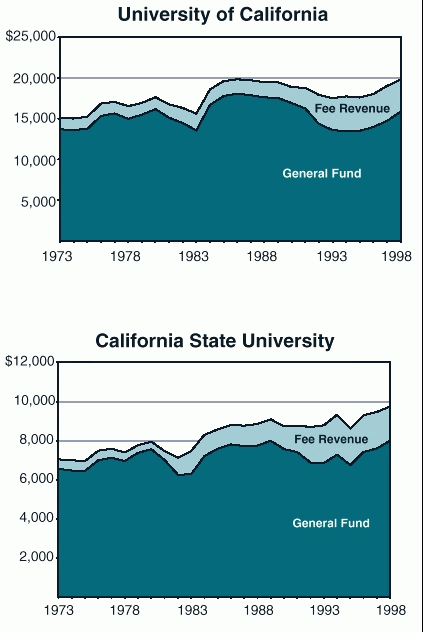
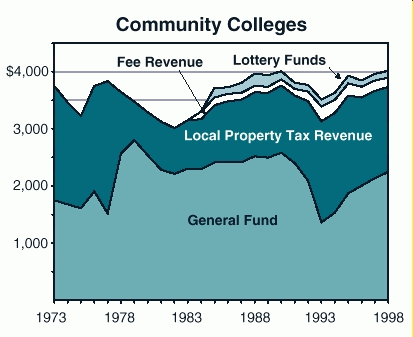
- Spending per student at the University of California (UC), California State University (CSU), and California Community Colleges (CCC) are at historic
highs over the past 25 years.
- These resources in 199899, after adjusting for inflation, are 10�percent, 18�percent, and 10�percent higher than the average from 1973 through 1998 for the
UC, CSU, and CCC, respectively.
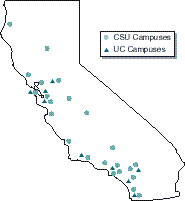
California Public Universities
1997-98 Full-Time Equivalent Students
| CSU |
FTE Students |
|
University of California |
FTE Students |
| Bakersfield |
4,585 |
|
Berkeley |
28,737 |
| Chico |
12,857 |
|
Davis |
22,053 |
| Dominguez Hills |
7,070 |
|
Irvine |
16,593 |
| Fresno |
14,880 |
|
Los Angeles |
31,886 |
| Fullerton |
17,826 |
|
Riverside |
9,190 |
| Hayward |
11,142 |
|
San Diego |
17,873 |
| Humboldt |
7,037 |
|
San Francisco |
3,573 |
| Long Beach |
20,229 |
|
Santa Barbara |
17,746 |
| Los Angeles |
14,448 |
|
Santa Cruz |
10,160 |
| Maritime Academy |
492 |
|
Total UC |
157,811 |
| Monterey Bay |
1,533 |
|
|
|
| Northridge |
19,554 |
|
|
|
| Pomona |
14,819 |
|
|
|
| Sacramento |
17,885 |
|
|
|
| San Bernardino |
10,088 |
|
|
|
| San Diego |
24,434 |
|
|
|
| San Francisco |
19,654 |
|
|
|
| San Jose |
19,292 |
|
|
|
| San Luis Obispo |
15,758 |
|
|
|
| San Marcos |
3,433 |
|
|
|
| Sonoma |
5,882 |
|
|
|
| Stanislaus |
4,889 |
|
|
|
| Total CSU |
266,790 |
|
|
|
College Participation Rates Are At Or Above Historic Highs
Percent of 18 to 24 Year Olds in College
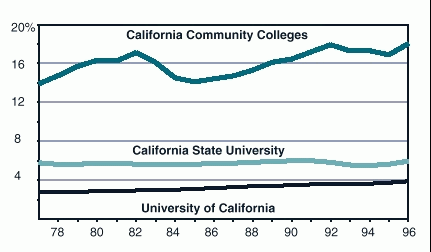
- Californians of prime college-going ages (between the ages of 18 and 24) are attending UC, CSU, and the community colleges at historically high rates.
- Participation rates for these Californians in 1996, for example, were 20�percent, 4�percent, and 11�percent higher than in 1977 for UC, CSU, and the
community colleges, respectively.
Continue to 1998 Cal Facts Program Trends Part II
Return to 1998 Cal Facts State Finances
Return to 1998 Cal Facts Table of Contents
Return to LAO Home Page


