Legislative Analyst's Office, December 1998
 |
1998 Cal Facts
Program
Trends
Part II
|
|
Resident Student Fees Are Significantly Below Comparison Institutions
1998-99
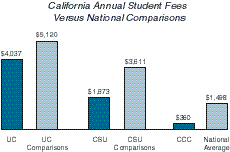
- Fees at UC are 21 percent below the average of the four public universities with which the state compares UC faculty salaries.
- CSU fees are 52 percent below its 15 "comparison" public universities.
- Community college fees are 76 percent below the average of community college fees nationwide.
- Fee revenues account for 20 percent (UC), 18 percent (CSU), and 4 percent (CCC) of instructional funding for each system.
CalWORKs Program: Major Features
| Participation Requirements |
|
- Weekly Hours. Adults in single-parent families must participate in work or approved education or training
activities for 26 hours in 1998-99 and 32 hours in 1999-00 and thereafter. An adult in a two-parent family
must participate for 35 hours per week.
|
- Welfare-to-Work Activities. Specifies the following sequence of services: job search; assessment;
welfare-to-work activities (education and training); and community service employment.
|
- Sanctions. The adult portion of the grant is removed if the adult fails to participate in work activities or
community service.
|
| Time Limits |
- Welfare-to-Work Services. New applicants are limited to 18 months of job training/education services.
Counties may extend the 18 month limit by 6 months if the extension is likely to lead to nonsubsidized
employment or if no jobs are available. Able-bodied adults must begin community service employment at
the end of these time limits if a nonsubsidized job is not available.
|
- Five-Year Time Limit/Safety Net. After five cumulative years on aid, the amount of the grant is reduced by
the portion for the adult. Counties have the option of providing the subsequent aid in the form of cash or
vouchers.
|
| Grants |
- Earned Income Disregard. Allows recipients to retain up to $225 in earned income with no reduction in
their grant. Each dollar of earnings above $225 results in a fifty cent reduction in their grant.
|
|
CalWORKs Caseload Declining
CalWORKs Cases
(In Thousands)
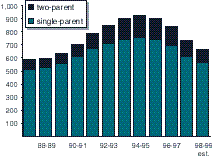
- After peaking in 1994-95, the caseload declined 20 percent by 1997-98 and is projected to decline an additional 9.3 percent in 1998-99.
- About two-thirds of the recent decline in the caseload can be explained by demographic trends and the state's economic expansion.
- The remaining decline may in part be explained by: (1) an "announcement effect" of welfare reform that affected behavior prior to policy changes; (2) a labor
market effect whereby welfare recipients benefit more as the economy approaches full employment (where the supply of labor is more scarce); and (3)
implementation of the CalWORKs program.
SSI/SSP Caseloads Leveling Off
SSI/SSP Cases
(In Thousands)
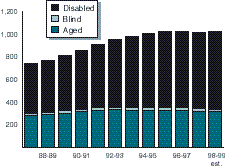
- The SSI/SSP program provides cash assistance to low income persons who are elderly, disabled, or blind.
- Following a period of rapid growth through the early 1990s, the caseload growth has moderated, in part because of federal law changes that restrict eligibility
for disabled children and certain noncitizens.
- California has created a temporary state-only funded program for certain noncitizens. In 1998-99, the average monthly state-only caseload is projected to be
approximately 1,700.
CalWORKs and SSI/SSP Maximum Monthly Grants
January 1999
| Program |
Amount |
|
|
| CalWORKsa |
|
| Low-cost counties |
$582 |
| High-cost counties |
611 |
| SSI/SSP |
|
| Individuals |
$676 |
| Couples |
1,201 |
|
|
| a Family of three. |
|
|
- When combined with Food Stamps, California's maximum CalWORKs grant is about 75 percent of the federal poverty guideline. Of the ten largest states,
California will provide the highest maximum grant, effective November 1998.
- California's SSI/SSP grant for individuals is 101 percent of the federal poverty guideline. The grant for couples is 133 percent of the poverty guideline. Of
the ten largest states, California provided the highest maximum SSI/SSP grants as of January1998.
Most Reports of Child Abuse/Neglect Are Closed After Initial Intake
1996
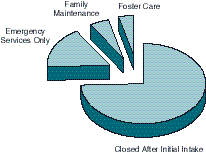
- There were about 707,000 reports of child abuse/neglect in 1996. Between 1989 and 1996, the number of reports of abuse/neglect rose from 71 to 81 per
1,000 children in the statewide population.
- Most reports (75 percent) were closed after the initial telephone assessment or in-person investigation. One in six reports resulted in a case which was closed
after emergency services (crisis intervention, counseling) were provided.
- A small proportion of reports of abuse/neglect resulted in an ongoing Child Welfare Services case in which (1) the child was removed from his/her home and
placed in foster care (4 percent) or (2) the child remained in his/her home and the family received ongoing "family maintenance" services designed to reduce
the risk of future abuse/neglect (5 percent).
Types of Foster Care Placements
| Placement Type/Description |
Caseloada
1998 |
Monthly Grant Per
Child (1998-99) |
|
|
|
| Foster Family Homes |
79,000b |
$375 - $528 |
- Provides 24-hour care and supervision to no more than six foster children
in the foster parent's home.
|
- Foster care grant may be supplemented for care of children with special
needs.
|
| Foster Family Agency Homes |
17,800 |
$1,362 - $1,607 |
- Foster parents are affiliated with nonprofit foster family agencies which
provide professional support.
|
- These placements are intended to serve as an alternative for group home
placement.
|
| Group Homes |
6,700 |
$1,254 - $5,314 |
- A facility of any capacity that provides 24-hour nonmedical care,
supervision, and services to children.
|
- Generally serve children with higher emotional or behavioral problems
who require a more restrictive environment.
|
- May vary from small, family-like homes to larger institutional homes.
|
| a Excludes approximately 4,800 foster children supervised by county probation departments. Most of these foster children are
placed in group homes. Also excludes approximately 4,100 foster children placed in county shelters, medical facilities,
specially licensed small family homes, and specialized pilot projects. |
| b Includes children placed with relatives who may receive CalWORKs rather than AFDC-FC grants. |
|
Use of Foster Family Agency Homes Increasing
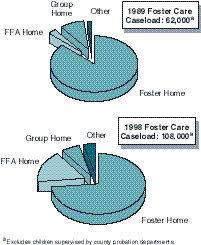
- California's average monthly foster care caseload increased from 62,000 in 1989 to 108,000 in 1998 an average annual increase of about 6 percent.
- The proportion of children placed with foster family agency (FFA) homes increased from 3 percent to 17 percent between 1989 and 1998.
- These changes are probably the result of (1) FFA homes being used as alternatives to group homes, and (2) former foster family homes becoming affiliated
with foster family agencies (which generally provide higher grants and additional support services).
Medi-Cal Caseload Falls But Cost per Eligible Still Grows
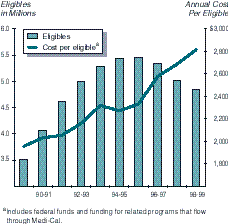
- The Medi-Cal caseload grew rapidly during the early 1990s due to (1) eligibility expansions and (2) increased welfare caseloads during the recession. Since
1995-96, however, the Medi-Cal caseload has declined somewhat, reflecting lower welfare caseloads.
- Despite recent caseload declines, the total cost of the Medi-Cal program remains roughly flat because the cost of services per eligible person continues to
rise. This is due to: (1) increased health care costs; and (2) a shift to a more expensive caseload "mix," (the number of families on welfare has declined, but
the number of higher-cost elderly and disabled remains essentially unchanged.)
California's Crime Rate Reduced Substantially Since 1980 Peak
Rate Per 100,000 Population
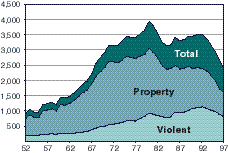
- The crime rate reached its peak in 1980, declined for four years, increased slightly in the late 1980s, and has declined each year since 1991. The 1997
California Crime Index (CCI) is now roughly equivalent to the rate in 1967.
- Most researchers believe that there are many reasons for the decline since the 1980 peak, including the aging of the population (particularly the aging of
"baby-boomers"), the decline in drug seizures (particularly "crack" cocaine), incapacitation and deterrent effects of recently enacted criminal penalties,
improved economy (and thus more jobs), better policing techniques (such as "community-oriented" policing), and relatively peaceful gang situations in some
urban areas.
Violent Crime Down Substantially Over Past Ten Years
Change in Violent Crime Rates, 1987 to 1997
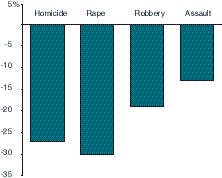
- Violent crime--the types of crime that have the most significant negative personal consequences on citizens and usually generate very high costs to
society--has declined 16 percent over the past decade.
- It is particularly significant that the largest drops have occurred in homicide (down 27percent) and rape (down 30percent), because these crimes were
already the types of violent crime that were least likely to be committed.
- The reasons for the drop in violent crime probably include the same reasons cited for the drop in overall crime (see page 66).
Crime Rate Declines Marginally Despite Sharp Rise in Imprisonment
Crime Rate/Incarceration Rate Indexed to 1972
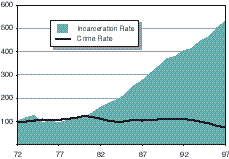
- California's incarceration rate has increased more than 400percent since 1972 while the crime rate has declined about 20percent.
- Some researchers argue that this situation should be expected because they believe that incarcerating more people for a longer period of time has no impact
on the crime rate. Others disagree and argue that the crime rate would have increased markedly if the rate of imprisonment had not increased so significantly.
Felony Arrests Highest Among the Young
1997 Rate Per 100,000 Age-Eligible Population
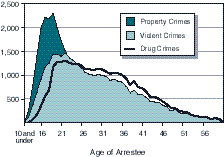
- The felony arrest rate peaks at age 18 for property crime and age 21 for violent and drug-related crime.
- The peak ages for arrest have actually increased in recent years. In 1993, the arrest rate for property crime peaked at age 16 and age 18 for violent crime.
- Although persons age 21 and under have a higher arrest rate than persons over the age of 21, they account for a smaller proportion of total arrests
(30percent for persons age 21 and under versus 70percent for persons over the age of 21). (Data not shown in figure.)
California's Crime Rate Near Middle of Other Large States
1996 Rate Per 100,000 Population
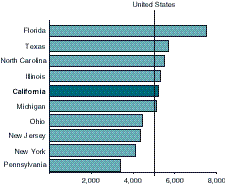
- Using measures of crime employed by the federal government, California's 1996 crime rate is only slightly higher than the nation's rate and is fifth highest
among the ten largest states.
- Florida's 1996 rate was the highest among the large states and was 44percent higher than California's rate. California's rate was about 2percent higher than
the rate for the other 49 states and the District of Columbia.
- As in California, the national crime rate and the rates for the ten largest states have been on the decline in recent years.
Crime Rates Vary Widely Among Large Counties
1996 Crime Rates Per 100,000 Population
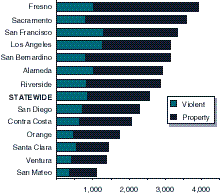
- Among the counties with populations of 500,000 or more, Fresno had the highest crime rate in 1996about 53percent higher than the statewide rate. San
Mateo's rate was the lowest and was less than half the statewide rate.
- Variations among county crime rates are probably explained by factors such as demography (areas with larger populations of young men tend to have higher
crime rates), wealth (and thus availability of jobs and crime-fighting resources), degree of urbanization, and location of certain factors associated with crime
(such as gangs and drug sellers).
Continue to 1998 Cal Facts Program Trends Part III
Return to 1998 Cal Facts Program Trends Part I
Return to 1998 Cal Facts Table of Contents
Return to LAO Home Page


