This is one of the LAO's responses to the 2017-18 May Revision. Other LAO responses are here.
Figures 1 and 3 in this post were corrected on June 17, 2017. The prior versions of these figures included a formatting error that resulted in incorrect data being displayed in some columns. These errors were limited to this web post only and, therefore, did not affect our revenue outlook.
In the coming days, our office will release high-level summaries of our updated state fiscal outlook. All elements of our state fiscal outlooks are premised on sets of economic assumptions. As is usually the case at May Revision, we only have time to prepare one economic scenario: in this case, a scenario in which moderate economic growth continues over the next several years.
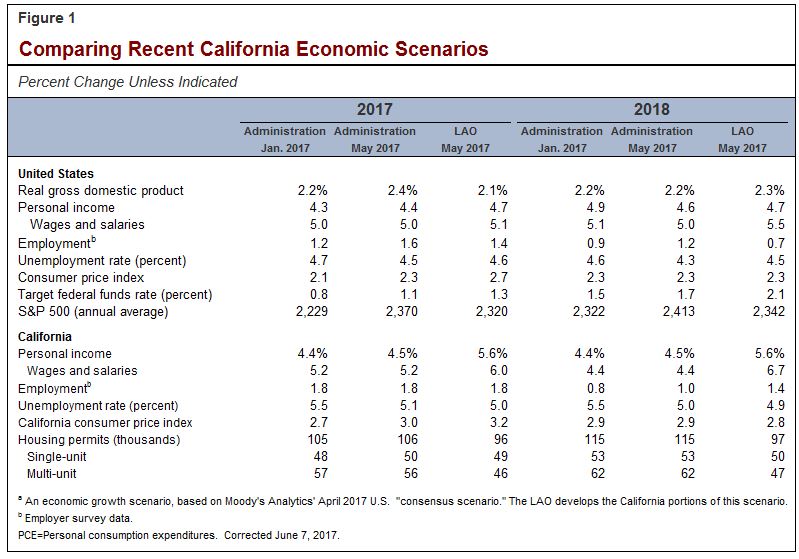
Our May Revision economic growth scenario is based on the “consensus scenario” compiled last month by Moody’s Analytics, a national economic data firm, that estimates the average of a range of publicly available forecasts from various institutions and professional economists. In Figure 1 below, we highlight key U.S. and California economic variables through 2018 in our economic growth scenario, as well as the administration’s economic forecasts in both January and now.
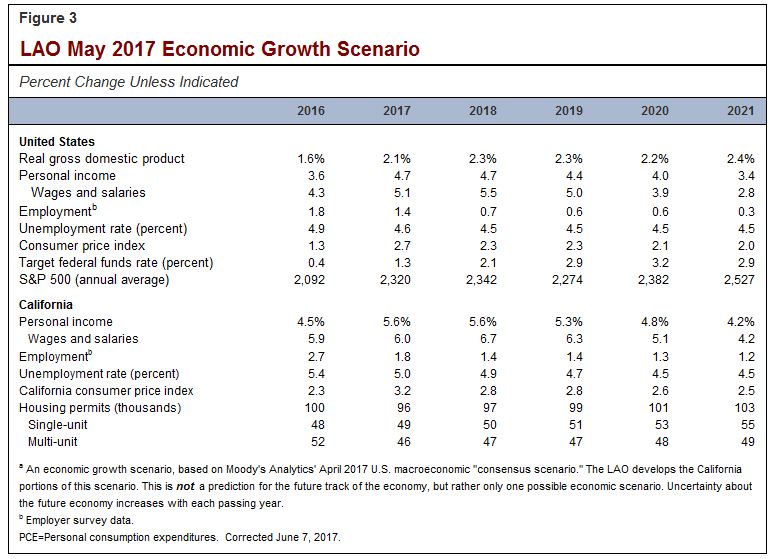
Economic Scenarios and Uncertainty. Figure 3 at the end of this post lists the key economic assumptions under our new economic growth scenario through 2021. As we discussed in our November 2016 Fiscal Outlook, it is not possible to accurately predict the future path of the economy. The consensus scenario we are using now is only one possible track for the economy. Even over the next year, economic performance could be notably weaker or stronger than that scenario assumes, and this uncertainty grows with each passing year thereafter. Based on what is known today, however, it seems reasonable to us for California’s elected leaders, when considering the 2017-18 state budget plan, to assume there will be moderate economic growth—similar to that in our current economic growth scenario—over the next year. The Department of Finance’s new economic forecast also reasonably assumes moderate economic growth over the next year.
The discussion below highlights some areas of economic uncertainty relevant to California’s state budget. Other areas of uncertainty also exist, such as the state budget’s dependence on the economic health of the Bay Area and persistent constraints in the supply of new housing, both of which were discussed in our November 2016 outlook.
The Uncertainties of “Full Employment”
The U.S. economy as a whole—now eight years into one of the longest economic expansions on record—is at the level considered by many economists to represent “full employment.” With a near-record low 4.9 percent statewide unemployment rate, parts of California also are at full employment. Compared to the low point of the economic downturn in late 2009 and early 2010, 2.5 million more Californians are working. Some inland areas—especially the Inland Empire—have seen noteworthy job growth recently. Full employment, however, may bring new economic challenges and uncertainties in the coming months, as we discuss below.
What Is “Full Employment?” There is no way for everyone wanting to work to be employed at any given time. There are various reasons this is the case: people always are switching from one job to another, wrapping up a temporary seasonal job, moving to another home, or graduating from school and looking for work. “Full employment,” therefore, is consistent with some joblessness. Different economists define full employment differently. Many consider it to be the economic situation in which essentially all workers who can easily and usefully be hired are working, such that additional employment only occurs by luring people from other jobs by offering them higher wages that may trigger higher inflation in the overall economy. In other words, full employment can be seen when the labor market is as tight as it can possibly be without significant price inflation. The precise level of joblessness consistent with full employment cannot be measured easily. Many economists, however, now think the U.S. economy as a whole appears to be at or near the full employment level, while parts of California also appear to be at or near full employment.
What Next for Such an Economy? Economic growth occurs when the economy produces more goods and services. This generally occurs as the workforce grows, as other new productive resources are tapped, and/or the productivity of firms increases in other ways. At the full employment level, economic growth can become more difficult to achieve. For one thing, it is difficult to grow the labor force. At full employment, there are relatively few workers “on the sidelines,” waiting for the right job opportunity to join or rejoin the job market. Moreover, in today’s environment, international immigration into the U.S. appears to be falling, and the baby boomer generation is leaving the workforce in large numbers. Productivity growth, meanwhile, has been weak in recent years, following the severe economic downturn of 2008 and 2009 that seems to have discouraged business investment, risk taking, and labor mobility. All of these factors may inhibit the growth of the economy over the next several years.
Inflation and Workforce Constraints Possible. Our economic growth scenario assumes somewhat higher inflation and interest rates, a slowing of job growth, and increasing wage growth, at least in the near term. But the economy may not progress in exactly this fashion. For example, the limited numbers of available workers could contribute to slower job growth. Inflation or interest rates could potentially rise more than we envision. These changes, in turn, could hurt business profitability in some scenarios, leading to lower stock prices and taxable capital gains. These sorts of issues theoretically could stall economic growth during some periods of the coming years or lead to a recession.
The Uncertainties of Federal Policy
Significant Policy Changes Seem Likely. The nation’s new President and many members of Congress favor major changes in key federal policies that affect California’s state budget and the economy here. Some of the policy areas that federal leaders seek to change are:
-
Health Care. California’s health care landscape looks very different from before the implementation of the Affordable Care Act, passed during the prior presidential administration. As we discussed in a recent report, the number of individuals without health insurance has fallen in California from 6 million in 2013 to around 3 million, as of 2015. This has helped expand the health care sector of the economy. Proposed federal changes could reduce federal funding and provide more flexibility to states. This potentially could reduce the number of insured Californians and slow the growth of the health care economy.
-
Taxes. Various proposals could reduce business taxes and change individual income taxes in a number of ways. The President, for example, has proposed lowering marginal income tax rates and, at the same time, eliminating the deduction for state and local tax payments—a deduction that disproportionately benefits Californians, as well as residents of a few other states. Changes in the overall amount of taxes paid by California residents and businesses could help or hurt the state’s economy, depending on the details. Lowering business taxes, for example, could provide firms with resources to invest more in ways that benefit the economy in the short term or the long term. On the other hand, if federal tax revenues are reduced without accompanying cost reductions, federal budget deficits could climb, which could place upward pressure on interest rates paid by both consumers and businesses.
-
Immigration. The President has promised to change how immigration laws are enforced. California’s economy has long relied in part on immigrant labor—both in low-wage industries like farm labor and high-wage sectors like technology. Changes to immigration policy could affect the availability of labor in those sectors and others and affect California’s future economic growth.
-
Trade. The President recently signed an executive order ending the U.S.’s participation in the proposed Trans-Pacific Partnership trade agreement with several Pacific Rim countries. He also has signaled his intent to renegotiate the North American Free Trade Agreement with the nation’s largest trading partners, Canada and Mexico. California firms export electronic components, vehicle and machinery parts, agricultural commodities, and other items abroad, while the state’s large logistics industry moves goods from ports and distributors in California and other states and vice versa. Changes in international trade agreements have the potential to affect those industries, as well as prices paid by consumers and businesses for goods and services subject to new trade restrictions.
Parameters and Timing of Policy Changes Unknown. It has proven difficult for the President and leaders of the majority party in Congress to secure enough votes to pass initial proposals in some of these policy areas. Accordingly, the parameters of federal policy changes and their timing remain uncertain. This adds to the uncertainty in any economic scenario. Economists have to make assumptions about future federal policies in their economic scenarios. For example, economists now are making different assumptions about what personal and corporate income tax changes will be adopted at the federal level. Compared to our economic growth scenario, different federal policy outcomes could either speed up or slow down economic growth.
The Uncertainties of the Stock Market
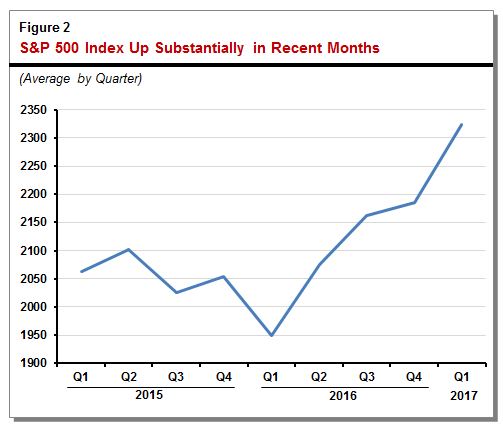
Stocks Now May Be Overvalued. The price of stocks is related, over the long term, to corporate earnings. Accordingly, price-to-earnings (PE) ratios are one key metric used to evaluate stock prices. Stocks have risen sharply in recent months, as shown in Figure 2, which shows the Standard and Poor’s (S&P) 500 index of major U.S. companies. The resulting PE ratio of the S&P 500 also has risen. At about 24-to-1 as of May 5 (according to the The Wall Street Journal), the S&P 500’s PE ratio is well above long-term averages, which are around 15-to-1. Since 1990, PE ratios have typically been higher than in past decades, but the median since 1990 is still just 21-to-1. Even that 21-to-1 ratio reflects years prior to the dot-com bust when, in retrospect, PE ratios in the high 20s and low 30s probably indicated an overvalued stock market. In short, today’s PE ratios suggest to many that there is a significant probability of stock price stagnation or declines in the near term.
LAO Scenario Assumes Stock Stagnation Through 2019. Under our office’s economic growth scenario, reflecting the Moody’s Analytics consensus scenario described earlier, we assume that stock prices stagnate for the rest of 2017 and in 2018 and 2019 as well. These stock prices have the effect of reducing somewhat the PE ratio: bringing it downward to about 22-to-1 by the end of 2019. This stock price stagnation will affect the amount of taxable capital gains in our personal income tax estimates, which we will release in the next day or two. The Department of Finance's economic forecast also now assumes minimal stock price growth after 2017.
Stock Market Volatility Likely. No one can predict month-by-month stock gyrations with any precision. The stock price stagnation assumed under our economic growth scenario is by no means a worst case scenario for stocks and taxable capital gains over the next few years. If PE ratios fell closer to long-term averages, much larger drops are possible during that period, and this would result in significantly fewer taxable capital gains, thereby affecting the bottom line of California’s state budget. On the other hand, if corporate profits do better than expected over the next few years, this could help drive stock prices further upward in the near term, increasing taxable capital gains and California’s budget reserves.
The key U.S. and California economic variables in our economic growth scenario are listed below.
Follow @LAOEconTax on Twitter for regular California economy and tax updates.


