State Revenue Tracking: Focus on Four Key Months
July 18, 2018
State Revenue Tracking: Focus on Four Key Months
Budget watchers monitor monthly revenue reports to compare how actual resources are tracking with estimates. Results from some months are more important than results from other months due to when different types of tax payments are submitted to the state. To help budget watchers better assess the state’s revenue situation, we explain these patterns with a particular focus on the state’s main revenue source—the personal income tax (PIT).
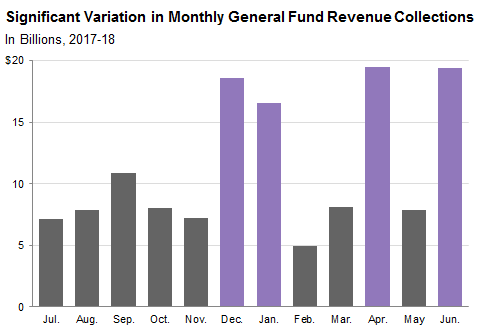
Over Half of Revenues Collected in Four Key Months. The figure below shows revenue collections by month during 2017-18. The state collected 54 percent of its General Fund revenues in four key months—December, January, April, and June. While revenue results in other months are important, budget watchers should pay particular attention to these key months.
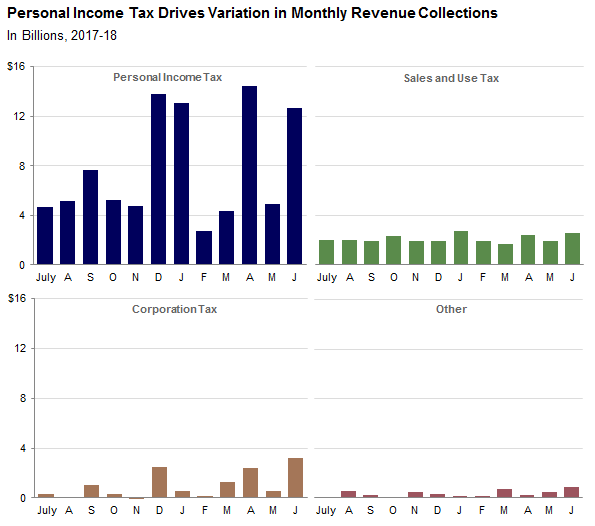
Personal Income Tax Responsible for Monthly Fluctuations. The chart below shows monthly collections by tax. The PIT drives variation in monthly revenue collections due to when different types of PIT payments are submitted to the state. Below, we dive into the daily patterns for different types of tax payments to explain this variation.
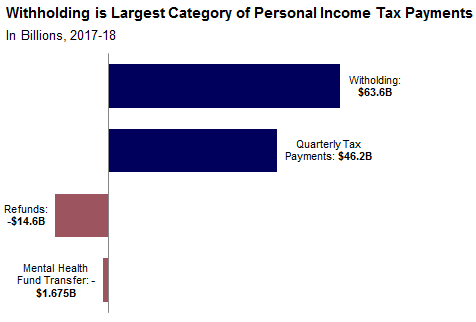
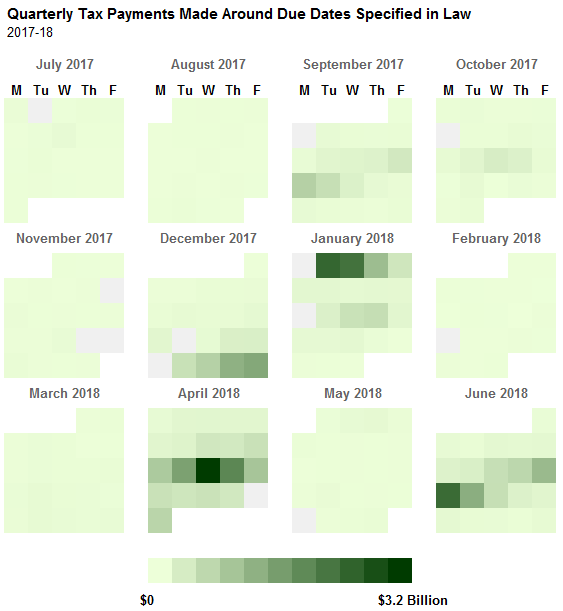
Variation in PIT Collections Largely Explained by Quarterly Tax Payment Deadlines. As the chart below shows, most PIT collections are from paycheck withholding. Tax filers who do not prepay all their taxes through paycheck withholding must make quarterly tax payments to the Franchise Tax Board (FTB). Much of these payments come from filers who receive a large share of their income from business income, capital gains, and other non-wage income. These payments represent the second largest category of PIT payments.
The due dates for these payments in 2017-18 were September 15, January 16, April 17, and June 15. The heatmap below shows the daily collections of these quarterly payments and their concentration around these four key due dates. (Filers may opt to make their January payment in December, explaining the surge late in that month.)
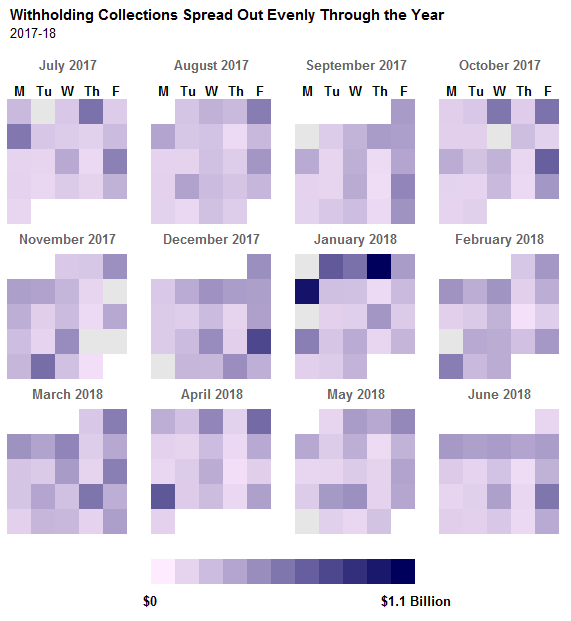
Withholding Collections Spread Relatively Evenly Throughout the Year. The Employment Development Department (EDD) collects PIT withholding from workers’ paychecks. The bulk of withholding collections comes from employee wages and salaries. The heatmap below shows daily withholding collections during 2017-18. Because wages and salaries are relatively stable throughout the year, withholding collections are also relatively stable. EDD also collects withholding on bonus income, which explains the spike in early January 2018. Note that, as shown in the legend, the largest withholding collection days in January 2018 reached just over $1 billion, much smaller than the peak days of over $3 billion in quarterly tax payments shown in the green heatmap above.
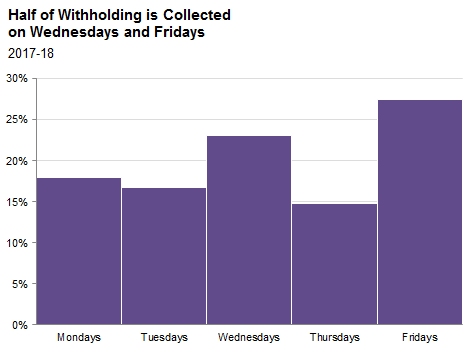
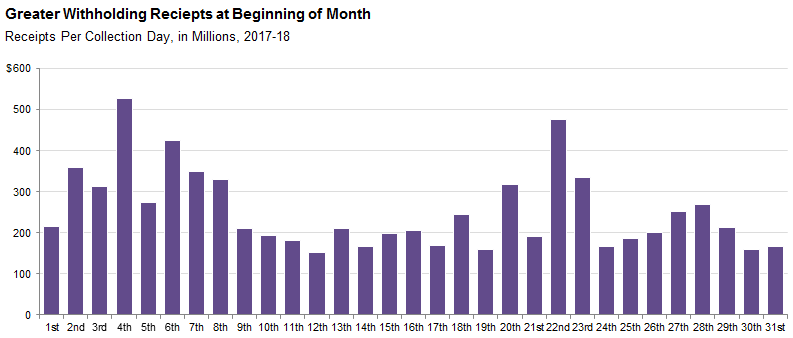
While relatively difficult to discern a pattern from the withholding heatmap, the subsequent charts show that about half of withholding collections are processed by EDD on Wednesdays and Fridays, and that collections tend to be greater at the beginning of the month. The patterns generally are explained by employer pay schedules and corresponding payment due dates set by EDD. For example, employers issuing paychecks every two weeks with over $500 in withholding must submit payment to EDD by the following Wednesday or Friday, depending upon the calendar day on which they issue payroll.
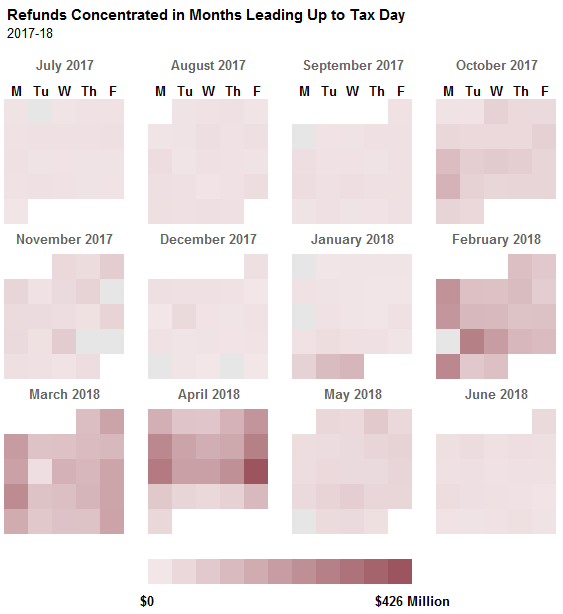
Refunds Primarily Issued in Lead-Up to Tax Day. Unsurprisingly, FTB issued around two-thirds of PIT refunds in 2017-18 between February and April, the period between when taxpayers receive the W-2 forms needed to file their tax returns and the tax filing date. (Some taxpayers opt to file extension returns in October, explaining the small surge in refunds in that month.) Note that the highest value in the refunds chart is $426 million, meaning that the refunds pattern is a much smaller factor in the monthly PIT variation than estimated and final payments or withholding.