California's Fiscal Forecast |
| Figure 1 | ||||
| LAO Economic Forecast | ||||
| Percent Change (Unless Otherwise Indicated) | ||||
| 1997 | 1998 | 1999 | 2000 | |
| United States | ||||
| Real GDP | 3.7 | 2.3 | 2.2 | 2.5 |
| Wage and salary jobs | 2.2 | 2.0 | 1.4 | 1.2 |
| Consumer Price Index | 2.4 | 2.3 | 2.8 | 3.1 |
| Unemployment rate (%) | 5.0 | 4.9 | 5.2 | 5.3 |
| Housing starts (millions) | 1.45 | 1.42 | 1.41 | 1.38 |
| California | ||||
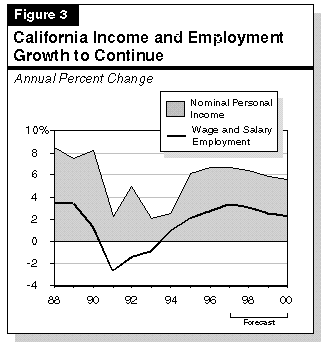
| Personal income | 6.7 | 6.4 | 5.8 | 5.6 |
| Wage and salary jobs | 3.4 | 3.1 | 2.6 | 2.3 |
| Consumer Price Index | 2.2 | 2.5 | 2.7 | 3.1 |
| Population | 1.4 | 1.7 | 1.8 | 1.8 |
| Unemployment rate (%) | 6.4 | 5.7 | 5.5 | 5.4 |
| Housing permits (thousands) | 107 | 132 | 144 | 148 |
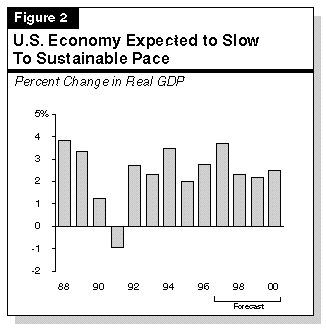
Unemployment and Inflation Rates Are Down. As a result of ongoing economic growth, both the national and California unemployment rates continued to fall in 1997. As of September 1997, the California rate stood at 6.3 percent, down from 7.1 percent 12 months earlier. The U.S. rate is now down to 4.7 percent, which is near its lowest level in three decades. Despite the tightness in national labor markets and other signs that the U.S. economy is operating at near full capacity, wage and price pressures have not yet emerged. In fact, most measures of inflation fell in 1997 relative to 1996. For example, the U.S. Consumer Price Index (CPI) rose just 2.2 percent between September 1996 and September 1997, down from the prior-year increase of 2.6 percent.
Consumer expenditures and business spending on capital equipment are expected to be the main
forces behind the continued expansion, reflecting high confidence levels as well as the continued
emphasis on investments in new technologies.
Inflation to Remain Low. Figure 1 also shows that we forecast that inflation will remain low. After dipping to just 2.3 percent in 1998, the U.S. CPI is projected to rise slowly to 3.1 percent by the year 2000. This outlook assumes some acceleration in wages, but it also assumes that strong foreign competition will limit the ability of domestic businesses to significantly raise product prices over the next several years.
Stock Market Turmoil Poses Risk. The recent volatility in the stock market is not expected to have a major impact on the national economy. Even with the declines experienced in late October and early November, the market remains significantly above its level at the beginning of 1997. However, further declines of a sufficient magnitude could depress consumer and business wealth, confidence, and ultimately, spending in the U.S. economy. As of mid-November, a wide diversity of opinion existed as to the market's likely future course, especially in the near term, ranging from continued expansion to significant downward corrections.
State's Expansion Broadening. The California economic expansion continues to broaden, both in terms of industries and geographic regions that are contributing to the overall growth in the state.
In terms of industries, Figure 4 shows that employment in the state's high-technology
manufacturing and services sectors is expected to continue growing at a healthy pace over the
next three years, moderating only slightly from the recent past. Growth in these sectors will be
joined in 1998 and beyond by significant increases in two industries that have lagged in the
current economic expansion--aerospace and residential construction activity.
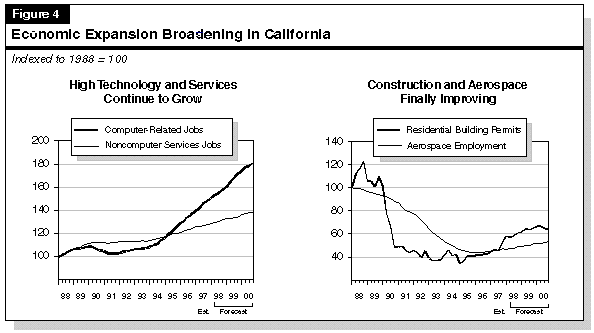
Aerospace Stabilizing. After declining dramatically for several years in the early 1990s,
aerospace employment has finally turned the corner, and is now growing modestly again. The
growth in this sector partly reflects expanding production of commercial aircraft and parts in this
state, as well as a stabilization of defense-related contract spending. While this sector is expected
to recoup only a fraction of the jobs lost in the previous decade, the gains will give an added
boost to California in the late 1990s.
Home Construction Picking Up. A key positive factor for California's economy in 1998 is the outlook for growing home construction activity. Based on improving home sales and an upturn in home prices, we forecast permits for new construction to increase 14 percent this year, to 107,000 units, before growing further to 132,000 units in 1998 and 144,000 units in 1999. Although these totals are still well below those of the 1980s, when permits for new construction averaged more than 200,000 per year, the gains have positive implications for both the economy and revenues. For example, increased home construction will boost state sales tax receipts related to the sales of building materials, home furnishings, appliances, and other home-related goods.
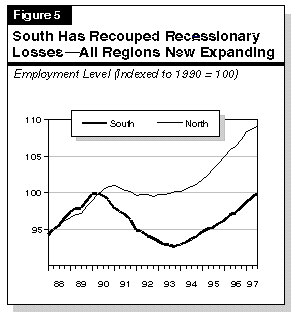
We expect that economic growth in the two regions will converge over the next two years, with the north moderating some from its recent pace, and the south continuing to accelerate.
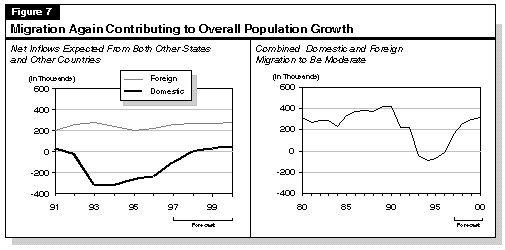
Net Migration Rebounding. Figure 7 shows our forecast for net migration and its two major
components--net domestic migration (population flows between California and other states) and
net foreign migration (population flows between California and other nations). It indicates that
total net migration (right panel) is projected to rebound to close to its prerecession level by the
end of the forecast period. The primary reason involves a sharp turnaround in net domestic
migration (left panel). Specifically, we forecast that net domestic migration will turn positive
after 1998, compared to net population outflows to other states in excess of 300,000 at the depth
of the recession.
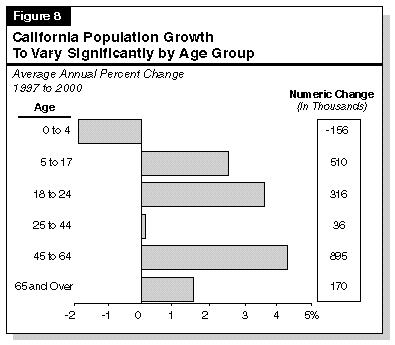
Growth to Vary by Age Group. Figure 8 shows our population growth projections by age
category, in terms of both percentage and numerical change. The most rapidly growing groups
are the 45-to-64 age group and K-12 school-age children (aging baby boomers and their
children). These various age-group projections have significant implications for state
expenditures in many different program areas, including education, health, and welfare. For
example, population growth in the 5-to-17 and 18-to-24 age groups influence K-12 and higher
education enrollments.
Continue to Chapter 3: Revenue Projections
Return to California's Fiscal Outlook Table of Contents