At key times during the state’s budget cycle, we post tables containing important information about the education parts of the budget. Specifically, we post tables in January, May, and October. The January tables generally reflect the Governor’s Budget proposal, the May tables reflect the Governor’s May Revision, and the October tables reflect the final enacted budget. The tables currently highlighted are for the state’s enacted 2015-16 budget. The tables cover all areas of education, with tables on K-12 education, adult and workforce education, community colleges, universities, financial aid, child care and preschool.

October 19, 2015
EdBudget Tables
Proposition 98 Overview- Tracking Changes in Estimates of Proposition 98 Minimum Guarantee
- Proposition 98 Funding by Segment and Source
- Key Proposition 98 Information Underlying June Budget Package
- 2014-15 Proposition 98 Changes
- 2015-16 Proposition 98 Changes
- Budget Pays Down $3.8 Billion of K-14 Mandate Backlog
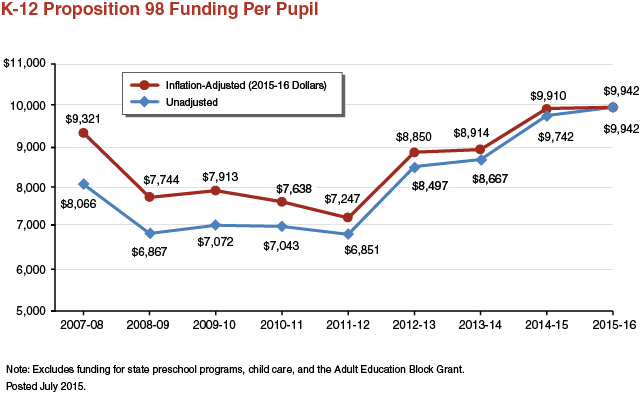
- Proposition 98 Funding Per Pupil
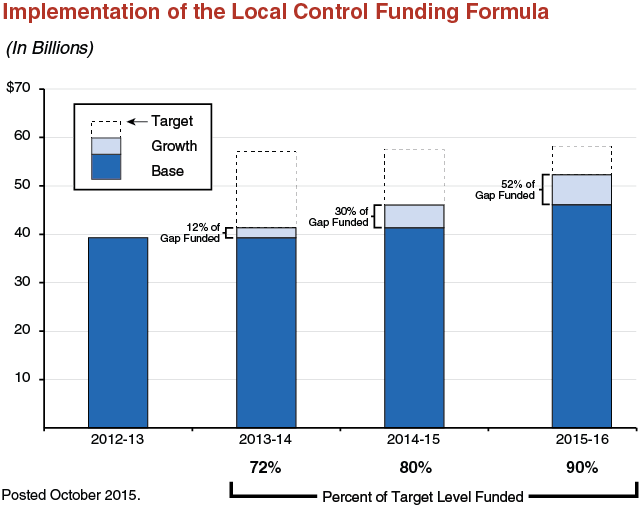
- Implementation of the Local Control Funding Formula
- Package of Special Education Actions
- Additional Workload, Staffing, and Funding for the California Department of Education
- Time Line for Required Adult Education Block Grant Activities
- Funding for Major Workforce Education and Training Programs in California
- Child Care and Preschool Budget
- 2015-16 Child Care and Preschool Changes
- Child Care and Preschool Subsidized Slots
- Higher Education Core Funding
- Higher Education General Fund Support
- 2014-15 Higher Education General Fund Changes
- 2015-16 Higher Education General Fund Changes
- Community College Programs Funded by Proposition 98
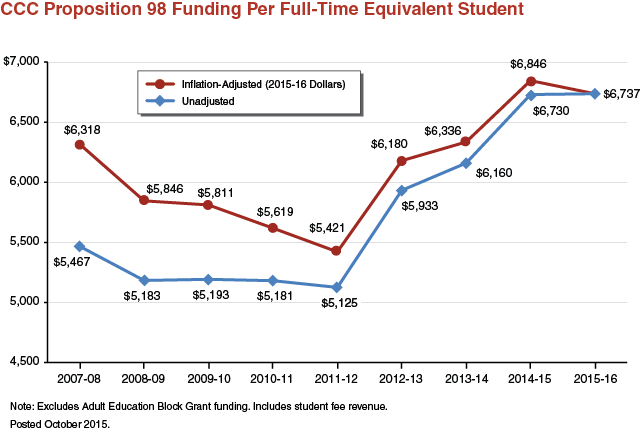
- California Community Colleges Proposition 98 Funding Per Full-Time Equivalent Student
- Declarations, Reports, and Requirements for UC and CSU
- UC Performance Improvement and Cost Reduction Measures
- Higher Education Annual Tuition and Fees
- Higher Education Enrollment
- Cal Grant Spending
- Cal Grant Recipients
- Summary of Middle Class Scholarship Awards and Policy Changes
Proposition 98 Overview
Tracking Changes in Estimates of Proposition 98 Minimum Guarantee
(Dollars in Millions)
|
June 2014 |
June 2015 |
Increase from June 2014 |
||
|
Amount |
Percent |
|||
|
2013–14 |
$58,302 |
$58,914 |
$612 |
1.0% |
|
2014–15 |
60,859 |
66,303 |
5,444 |
8.9 |
|
2015–16 |
— |
68,409 |
7,550a |
12.4 |
|
aReflects increase from June 2014 estimate of 2014–15 minimum guarantee. Posted October 2015. |
||||

Proposition 98 Funding by Segment and Source
(Dollars in Millions)
|
2013-14 Revised |
2014-15 Revised |
2015-16 Enacted |
Change From 2014-15 |
||
|
Amount |
Percent |
||||
|
Preschool |
$507 |
$664 |
$885a |
$220a |
33% |
|
K-12 Education |
|||||
|
General Fund |
$38,162 |
$43,888 |
$43,151 |
-$737 |
-2% |
|
Local property tax |
13,736 |
14,432 |
16,380 |
1,947 |
13 |
|
Subtotals |
($51,898) |
($58,321) |
($59,530) |
($1,210) |
(2%) |
|
Adult Education Block Grant |
$25b |
— |
$500 |
$500 |
— |
|
California Community Colleges |
|||||
|
General Fund |
$4,223 |
$4,975 |
$4,801 |
-$175 |
-4% |
|
Local property tax |
2,182 |
2,263 |
2,613 |
350 |
15 |
|
Subtotals |
($6,406) |
($7,238) |
($7,414) |
($176) |
(2%) |
|
Other Agencies |
$78 |
$80 |
$80 |
— |
— |
|
Totals |
$58,914 |
$66,303 |
$68,409 |
$2,106 |
3% |
|
General Fund |
$42,996 |
$49,608 |
$49,416 |
-$192 |
-0.4% |
|
Local property tax |
15,918 |
16,695 |
18,993 |
2,298 |
14 |
|
aIncludes $145 million for existing wraparound care, formerly funded with non-Proposition 98 General Fund. Excluding this accounting shift, growth is $75 million (11 percent). bFor adult education consortium planning grants. Available for expenditure in 2013-14 and 2014-15. Posted October 2015. |
|||||
Key Proposition 98 Information Underlying June Budget Package
(Dollars in Millions)
|
2013-14 Revised |
2014-15 Revised |
2015-16 Budget Act |
|
|
Minimum Guarantee |
|||
|
General Fund |
$42,996 |
$49,608 |
$49,416 |
|
Local property tax |
15,918 |
16,695 |
18,993 |
|
Total Guarantee |
$58,914 |
$66,303 |
$68,409 |
|
Inputs |
|||
|
General Fund taxesa |
$101,476 |
$112,068 |
$116,619 |
|
K-12 average daily attendance |
5,993,001 |
5,994,522 |
5,995,889 |
|
State civilian population |
38,193,963 |
38,552,049 |
38,883,323 |
|
Growth Factors |
|||
|
Per capita personal income |
5.1% |
-0.2% |
3.8% |
|
Per capita General Fundb |
5.5 |
9.9 |
3.7 |
|
K-12 average daily attendance |
0.5 |
— |
— |
|
State civilian population |
0.9 |
0.9 |
0.9 |
|
Assessed property values |
4.7 |
6.2 |
5.5 |
|
K-14 cost-of-living adjustment |
1.6 |
0.9 |
1.0 |
|
Outcomes |
|||
|
Proposition 98 operative “test” |
2 |
1 |
3 |
|
Spike protection effect |
— |
-$424c |
— |
|
Test 3 supplemental payment |
— |
— |
$99 |
|
Maintenance factor: |
|||
|
Amount created/paid (+/-) |
— |
-5,402 |
— |
|
Amount outstanding |
$6,157 |
743 |
772 |
|
PSSSA Deposit? |
— |
— |
No |
|
aReflects General Fund revenues that affect the calculation of the minimum guarantee. bReflects per capita General Fund plus 0.5 perent (one of the Test 3 factors). cDue to a revenue spike in 2014-15, a portion of the increase in the 2014-15 minimum guarantee is backed out from the calculation of the minimum guarantee moving forward. PSSSA = Public School System Stabilization Account. Posted October 2015. |
|||
2014-15 Proposition 98 Changesa
(In Millions)
|
Technical Adjustments |
|
|
Make Local Control Funding Formula growth adjustments |
$306 |
|
Otherb |
149 |
|
Subtotal |
($455) |
|
K-12 Education |
|
|
Pay down mandate backlog |
$2,748 |
|
Eliminate deferrals |
897 |
|
Fund teacher training and support block grant |
490 |
|
Fund career technical education (CTE) grants |
150 |
|
Provide learning and behavioral supports for special educationc |
10 |
|
Fund Internet technology management, training, and technical assistance |
10 |
|
Finish developing evaluation rubricsd |
— |
|
Subtotal |
($4,306) |
|
California Community Colleges |
|
|
Pay down mandate backlog |
$393 |
|
Eliminate deferrals |
94 |
|
Create basic skills transformation program |
60 |
|
Extend CTE Pathways Program |
48 |
|
Fund maintenance and instructional equipment |
48 |
|
Fund CCC Innovation Awards |
23 |
|
Create basic skills partnership pilot program |
10 |
|
Support implementation of baccalaureate degree pilot program |
6 |
|
Subtotal |
($683) |
|
Total, 2014-15 Changes |
$5,444 |
|
a All actions shown, except for technical adjustments, reflect one-time spending. bIncludes various property tax adjustments and adjustments to state agencies receiving Proposition 98 funding. cPart of special education package. d Provides $350,000 for the State Board of Education. Posted October 2015. |
|
2015-16 Proposition 98 Changes
(In Millions)
|
Technical Adjustments |
|
|
Back out prior-year fundsa |
-$6,554 |
|
Otherb |
335 |
|
Subtotal |
(-$6,219) |
|
K-12 Education |
|
|
Fund LCFF increase for school districts |
$5,994 |
|
Fund career technical education grants (one time) |
250 |
|
Increase preschool funding |
220c |
|
Fund various special education activities |
50 |
|
Fund Internet infrastructure grants (one time) |
50 |
|
Provide 1.02 percent COLA for select categorical programs |
40 |
|
Pay down mandate backlog (one time) |
31 |
|
Increase funding for the Charter School Facility Grant Program |
20 |
|
Increase funding for Foster Youth Services |
10 |
|
Other |
-3 |
|
Subtotal |
($6,663) |
|
California Community Colleges |
|
|
Fund adult education consortia |
$500 |
|
Increase apportionment funding (above growth and COLA) |
267 |
|
Fund 3 percent enrollment growth |
157 |
|
Pay down mandate backlog (one time) |
117 |
|
Augment Student Success and Support Program (SSSP) for matriculation services |
100 |
|
Fund maintenance and instructional equipment (one time) |
100 |
|
Augment SSSP for implementation of local student equity plans |
85 |
|
Hire additional full-time faculty |
62 |
|
Provide 1.02 percent COLA for apportionments |
61 |
|
Fund CDCP noncredit courses at credit rate |
50 |
|
Provide funds to restore enrollment earned back by districts |
42 |
|
Supplement Cal Grant B awards for full-time CCC students |
39 |
|
Augment Extended Opportunity Programs and Services |
35 |
|
Fund new apprenticeships in high-demand occupations |
15 |
|
Increase funding for established apprenticeships |
14 |
|
Augment SSSP to fund dissemination of effective institutional practices |
12 |
|
Augment SSSP for technical assistance to improve district operations and outcomes |
3 |
|
Fund administration of higher Cal Grant B awards (one time) |
3 |
|
Provide 1.02 percent COLA for select categorical programs |
2 |
|
Subtotal |
($1,663) |
|
Total, 2015-16 Changes |
$2,106 |
|
aIncludes one-time funds for retiring deferrals, paying down the K-14 mandate backlog, and supporting various other one-time initiatives. bIncludes LCFF growth adjustments, growth for K-12 categorical programs, and annualized funding for 4,000 preschool slots initiated in 2014-15. cIncludes $145 million for existing wraparound care, formerly funded with non-Proposition 98 General Fund. LCFF = Local Control Funding Formula; COLA = cost-of-living adjustment; and CDCP = Career Development and College Preparation. Posted October 2015. |
|
Budget Pays Down $3.8 Billion of K-14 Mandate Backlog
(In Millions)
|
K-12 Education |
California Community Colleges |
Totals |
|
|
Pay down scored to: |
|||
|
2013-14 |
$319 |
$94 |
$413 |
|
2014-15 |
2,748 |
393 |
3,142 |
|
2015-16 |
31 |
117 |
148 |
|
Settle-up payment |
82 |
28 |
110 |
|
Prior-year reappropriation |
24 |
— |
24 |
|
Totals |
$3,205 |
$632 |
$3,837 |
|
Posted October 2015. |
|||
K-12 Education
Package of Special Education Actions
2015-16 (In Millions)
|
Program Area |
Action |
Amount |
|
Proposition 98 Funds |
||
|
Infant and toddler services |
Increase funding for districts to serve children with disabilities ages birth to three (brings total funding to $119 million). |
$30.0 |
|
Preschool slots |
Fund 2,500 additional part-day State Preschool slots, with priority given to students with disabilities. |
12.1 |
|
Learning and behavioral supports |
Provide funding for one or two county offices of education to develop statewide resources, provide trainings, and allocate subgrants to improve how districts meet students’ learning and behavioral needs. |
10.0a |
|
Preschool training, parent information, and rate increase |
Specify that State Preschool contractors must provide staff training and parent education on how to identify and meet students’ special needs. Increase part-day reimbursement rate by 1 percent to cover associated costs. |
6.0 |
|
State Special Schools |
Provide one-time increase for instructional activities at the state’s schools for deaf and blind students.b |
3.0c |
|
Fund swap |
Redirect federal funds from local assistance to state-level activities, then backfill with Proposition 98 funds. |
2.0 |
|
Subtotal |
($63.1) |
|
|
Federal Fundsd |
||
|
Office of Administrative Hearings |
Increase funding for state-level hearings regarding special education disputes (brings total funding to $12.8 million). |
$1.9a |
|
Alternative dispute resolution |
Increase funding for local grants to help districts and families resolve disputes without a trial (brings total funding to $1.95 million). |
1.7 |
|
State-level improvement activities |
Fund CDE to develop resources and provide technical assistance to districts implementing the new federally required statewide plan for improving services for students with disabilities. |
0.5 |
|
Subtotal |
($4.0) |
|
|
Total |
$67.1 |
|
|
aOne-time allocation scored to 2014-15 Proposition 98 guarantee. bThe budget also requires that these schools spend at least $4.8 million from their non-Proposition 98 funds in 2015-16 to address critical facility maintenance needs. cFunded with one-time Proposition 98 Reversion Account monies. dNew state-level activities funded in part by an increase in the state’s federal grant and in part by redirecting $2 million from local assistance. CDE = California Department of Education. Posted October 2015. |
||
Additional Workload, Staffing, and Funding for the California Department of Education (CDE)
2015-16 (In Thousands)
|
New Workload |
Funding |
Ongoing or One Time |
|
Continue to contract with legal firm to represent state in second year of Cruz v. California case. |
$3,675 |
One time |
|
Upgrade Standardized Account Code System. |
3,600a |
One time |
|
Produce report on characteristics of kindergarten programs across the state. Pursuant to Chapter 723, Statutes of 2014 (AB 1719, Weber). |
550 |
One time |
|
Administer Career Technical Education Incentive Grant Program. Budget authorizes two three-year limited-term positions. |
350 |
Three years |
|
Administer Adult Education Block Grant. No new position authority. Supports three existing ongoing positions. |
335 |
Ongoing |
|
Develop the history/social science, science, and health curriculum frameworks. Supports external consultant and travel costs of framework committee members. |
274 |
One time |
|
Respond to ongoing increase in civil rights complaints and address one-time backlog of complaints. No new position authority. Supports one existing ongoing position and funds another existing position on a one-time basis. |
207 |
$107 ongoing, 100 one time |
|
Develop guidelines for how after school programs can qualify for a new health recognition program, then post which programs achieved the certification. Pursuant to Chapter 369, Statutes of 2014 (SB 949, Jackson). Budget authorizes one one-year Information Technology position and one two-year consultant position. |
177 |
118 one time, 59 two years |
|
Support portions of three existing State Board of Education staff who work on charter school issues (formerly funded with federal funds). |
151 |
Ongoing |
|
Develop report on strategies for successfully transferring juvenile court school students to other district and county schools. Pursuant to Chapter 901, Statutes of 2014 (AB 2276, Bocanegra). |
137 |
One time |
|
Contract to draft a sex trafficking and sexual abuse section for possible inclusion in the next version of the state’s Health Framework. Pursuant to Chapter 713, Statutes of 2012 (SB 1165, Mitchell). |
135 |
One time |
|
Hire independent consultant to oversee Smarter Balanced Technical Hosting Solution Project. |
85b |
One time |
|
Address additional workload in the Early Education and Support Division resulting from recent program expansions. |
61c |
Ongoing |
|
Assemble and post an online bullying and cyberbullying prevention training module. Pursuant to Chapter 418, Statutes of 2014 (AB 1993, Fox). |
43 |
One time |
|
Total |
$9,780 |
|
|
a The budget also reappropriates $3.6 million General Fund provided for this project in prior years and $5 million in federal carryover funds. b Represents funding sufficient to support the position for nine months. Funding for the remaining three months of the year was carried over from the 2014-15 budget. c Funding supports the upgrade of one position provided in the 2014-15 Budget Act from Associate Governmental Program Analyst to Consultant. The budget also converts two positions that were provided in 2014-15 Budget Act from two-year to permanent (making the associated annual cost of $203,000 ongoing). Posted October 2015. |
||
Workforce Education and Training
Time Line for Required Adult Education Block Grant Activities
|
Action |
Deadline |
|
Funding Allocation Decisions |
|
|
One Time |
|
|
CCC Chancellor and SPI, with advice of SBE, certify 2012-13 spending for existing district and COE adult education programs. |
July 31, 2015 |
|
Chancellor and SPI apportion funds to districts and COEs based on certified spending. |
August 30, 2015 |
|
Chancellor and SPI, with concurrence of SBE, approve allocation of remaining funds to consortia. |
October 30, 2015 |
|
Chancellor and SPI apportion remaining funds to consortia. |
30 days after allocation approval |
|
Ongoinga |
|
|
Chancellor and SPI, with advice of SBE, approve preliminary allocation to consortia for next budget year. |
February 28 annually |
|
Chancellor and SPI, with advice of SBE, approve final allocation to consortia. |
15 days after budget enactment |
|
Chancellor and SPI apportion funds to consortia. |
30 days after allocation approval |
|
Planning and Reporting |
|
|
One Time |
|
|
Consortia develop initial adult education regional plans. |
Completed March 2015 |
|
Chancellor and SPI report on progress toward developing consistent data policies and data collection procedures. |
November 1, 2015 |
|
Chancellor and SPI identify metrics they will use to measure consortia’s performance. |
January 1, 2016 |
|
Chancellor and SPI submit plan to distribute funds from federal adult education programs to consortia. |
January 31, 2016 |
|
Commission on Teacher Credentialing and CCC Academic Senate submit recommendations for establishing reciprocity standards for adult education instructors. |
July 1, 2016 |
|
Ongoing |
|
|
Chancellor and SPI report on status of consortia. |
September 30 annuallya |
|
Consortia update regional plans with available data. |
Annuallyb |
|
Consortia revise adult education regional plans. |
Every three years |
|
aBeginning 2016-17. bBeginning 2015-16. SPI = Superintendent of Public Instruction; SBE = State Board of Education; and COE = county office of education. Posted October 2015. |
|
Funding for Major Workforce Education and Training Programs in California
2015-16 (In Millions)
|
Program |
Agency |
State General Fund |
Other Fund Sourcesa |
Total Funding |
|
Apportionments for workforce education and training |
CCC |
$2,108b |
— |
$2,108 |
|
Adult Education Block Grant |
CCC/CDE |
525c |
— |
525 |
|
Career Technical Education Incentive Grants |
CDE |
400d |
— |
400 |
|
CalWORKs employment and training services |
DSS |
242 |
$1,190 |
1,432 |
|
Office of Correctional Education programs |
CDCR |
182 |
— |
182 |
|
Office of Offender Services |
CDCR |
81 |
43 |
124e |
|
Vocational Rehabilitation |
CDR |
58 |
357 |
415 |
|
Apprenticeships |
CCC/CDE |
52 |
— |
52 |
|
Core Training Program |
Corps |
46 |
43 |
90 |
|
Career Technical Education Pathways |
CCC/CDE |
48f |
— |
48 |
|
Project Workability for students in special education |
CDE |
40 |
— |
40 |
|
CCC student services for CalWORKs recipients |
CCC |
35 |
— |
35 |
|
Economic and Workforce Development |
CCC |
23 |
— |
23 |
|
California Partnership Academies |
CDE |
21 |
— |
21 |
|
Adults in Correctional Facilities |
CDE |
15 |
— |
15 |
|
Nursing program support |
CCC |
13 |
— |
13 |
|
Specialized Secondary Programs |
CDE |
5 |
— |
5 |
|
Agriculture Incentive Grants |
CDE |
4 |
— |
4 |
|
Adult, Youth, and Dislocated Worker Services (WIOA Title I) |
EDD |
— |
398 |
398 |
|
Wagner-Peyser Employment Services (WIOA Title III) |
EDD |
— |
129 |
129 |
|
Carl D. Perkins Career and Technical Education Act |
CCC/CDE |
— |
121 |
121 |
|
Adult Education and Family Literacy Program (WIOA Title II) |
CCC/CDE |
— |
90 |
90 |
|
Employment Training Panel |
EDD |
— |
73 |
73 |
|
CalFresh Employment and Training Program |
DSS |
— |
68 |
68 |
|
Jobs for Veterans State Grant (WIOA Title I) |
EDD |
— |
19 |
19 |
|
CDE student services for CalWORKs recipients |
CDE |
— |
13 |
13 |
|
American Apprenticeship grants |
Variousg |
— |
11 |
11 |
|
Investing in California Communities through Building Energy Efficiency workforce development program |
Energy |
— |
9 |
9 |
|
Energy Corps |
Corps |
— |
5 |
5 |
|
Proposition 39 pre-apprenticeships |
EDD |
— |
3 |
3 |
|
Offender development programs |
CalPIA |
2 |
2h |
4 |
|
Totals |
$3,901 |
$2,574 |
$6,475 |
|
|
aLargely federal funds, with some special funds. bAssumes community colleges spend about 30 percent of apportionment funding on core adult education areas. c$25 million is one-time funding for a data collection and reporting system. dReflects first-year funding for three-year, $900 million grant program. eReflects funding for all wraparound services, which include workforce education and training. fOne-time funding to extend program an additional year. gGrants awarded directly to providers. Amount reflects grants to public agencies in California. It excludes grants to private providers (nonprofit agencies and labor unions). hFunded through sale of CalPIA goods. CCC = California Community Colleges; CDE = California Department of Education; DSS = Department of Social Services; CDCR = California Department of Corrections and Rehabilitation; CDR = California Department of Rehabilitation; Corps = California Conservation Corps; WIOA = Workforce Innovation and Opportunity Act; EDD = Employment Development Department; Energy = California Energy Commission; and CalPIA = California Prison Industry Authority. Posted October 2015. |
||||
Childcare and Preschool
Child Care and Preschool Budget
(Dollars in Millions)
|
2013-14 |
2014-15 |
2015-16 |
Change From 2014-15 |
||
|
Amount |
Percent |
||||
|
Expenditures |
|||||
|
CalWORKs Child Care |
|||||
|
Stage 1 |
$337 |
$330a |
$411 |
$81 |
24% |
|
Stage 2b |
367 |
355 |
414 |
60 |
17 |
|
Stage 3 |
202 |
220 |
278 |
58 |
27 |
|
Subtotals |
($906) |
($904) |
($1,103) |
($199) |
(22%) |
|
Non-CalWORKs Programs |
|||||
|
State Preschool |
$507 |
$614 |
$835 |
$220 |
36% |
|
General Child Care |
464 |
544 |
450 |
-94 |
-17 |
|
Alternative Payment |
177 |
182 |
251 |
68 |
37 |
|
Migrant |
27 |
28 |
29 |
2 |
6 |
|
Handicapped |
1 |
2 |
2 |
— |
— |
|
Subtotals |
($1,177) |
($1,370) |
($1,567) |
($197) |
(14%) |
|
Support and Quality Programs |
$74 |
$123 |
$150 |
$27 |
22% |
|
Totals |
$2,157 |
$2,397 |
$2,820 |
$423 |
18% |
|
Funding |
|||||
|
Non-Proposition 98 General Fund |
$764 |
$809 |
$977 |
$169 |
21% |
|
Proposition 98 General Fund |
507 |
664 |
885 |
220 |
33 |
|
Federal CCDF |
556 |
570 |
573 |
3 |
— |
|
Federal TANF |
330 |
353 |
385 |
31 |
9 |
|
aReflects Department of Social Services’ revised Stage 1 estimates for cost of care and caseload. bDoes not include $9.2 million provided to community colleges for Stage 2 child care. CCDF = Child Care and Development Fund and TANF = Temporary Assistance for Needy Families. Posted October 2015. |
|||||
2015-16 Child Care and Preschool Changes
(In Millions)
|
Change |
Proposition 98 |
Other |
Total |
|
Reimbursement Rates |
|||
|
Increases the Standard Reimbursement Rate 5 percent starting July 1, 2015 |
$38 |
$23 |
$61 |
|
Increases Regional Market Rate 4.5 percent starting October 1, 2015 |
— |
44 |
44 |
|
Annualizes Regional Market Rate increase initiated January 1, 2015 |
— |
34 |
34 |
|
Increases license-exempt rate from 60 percent to 65 percent of family child care home rates starting October 1, 2015 |
— |
18 |
18 |
|
Provides 1.02 percent COLA to Standard Reimbursement Rate |
6 |
8 |
14 |
|
Increases part-day State Preschool rate 1 percent starting July 1, 2015 |
6 |
— |
6 |
|
Subtotals |
($50) |
($127) |
($177) |
|
Slots |
|||
|
Provides 6,800 Alternative Payment Program slots starting July 1, 2015 |
— |
$53 |
$53 |
|
Provides 7,030 full-day State Preschool slots starting January 1, 2016a |
$31 |
3 |
34 |
|
Annualizes funding for 4,000 full-day State Preschool slots initiated June 15, 2015 |
15 |
19 |
33 |
|
Provides 2,500 part-day State Preschool slots with priority for children with disabilities starting July 1, 2015 |
12 |
— |
12 |
|
Increases non-CalWORKs slots for statutory growthb |
2 |
3 |
5 |
|
Subtotals |
($60) |
($78) |
($138) |
|
Other |
|||
|
Makes CalWORKs child care caseload and average cost of care adjustments |
— |
$116 |
$116 |
|
Provides one-time infant and toddler quality activity block grant |
— |
24 |
24 |
|
Carries forward one-time funds for federally required quality activities |
— |
3 |
3 |
|
Shifts LEA full-day State Preschool “wrap” into Proposition 98 |
$145 |
-145 |
— |
|
Removes one-time funding for State Preschool facilities and quality activities |
-35 |
— |
-35 |
|
Subtotals |
($110) |
(-$2) |
($108) |
|
Totals |
$220 |
$203 |
$423 |
|
a Of these slots, 5,830 are for local educational agency (LEA) providers, with the remainder for non-LEA providers. bApplies 1.39 percent growth to Alternative Payment Program slots and 0.37 percent growth to all other non-CalWORKs child care programs. COLA = cost-of-living adjustment. Posted October 2015. |
|||
Child Care and Preschool Subsidized Slotsa
|
2013-14 |
2014-15 |
2015-16 |
Change From 2014-15 |
||
|
Amount |
Percent |
||||
|
CalWORKs Child Care |
|||||
|
Stage 1 |
35,583 |
38,859 |
44,154 |
5,295 |
14% |
|
Stage 2c |
53,984 |
51,956 |
50,971 |
-985 |
-2 |
|
Stage 3 |
31,702 |
34,563 |
35,845 |
1,282 |
4 |
|
Subtotal |
(121,269) |
(125,378) |
(130,970) |
(5,592) |
(4%) |
|
Non-CalWORKs Programs |
|||||
|
State Preschool—Part Day |
91,170 |
96,087 |
98,956 |
2,869 |
3% |
|
State Preschool—Full Day |
44,889 |
50,989 |
58,504 |
7,515 |
15 |
|
General Child Cared |
27,757 |
28,632 |
28,738 |
106 |
— |
|
Alternative Payment |
30,132 |
25,967 |
32,852 |
6,885 |
27 |
|
Migrant |
2,534 |
2,505 |
2,514 |
9 |
— |
|
Handicapped |
144 |
145 |
146 |
1 |
— |
|
Subtotal |
(196,626) |
(204,325) |
(221,710) |
(17,385) |
(9%) |
|
Total |
317,895 |
329,703 |
352,680 |
22,977 |
7% |
|
aReflects average monthly full-day slots, except for State Preschool—Part Day. bReflects DSS estimates for CalWORKs Stage 1, DOF estimates for CalWORKs Stage 2 and Stage 3, and LAO estimates for non-CalWORKs programs. cDoes not include community college child care slots (1,300 to 1,800 slots annually). dState Preschool “wrap” slots funded by General Child Care are included in State Preschool—Full Day. DSS = Department of Social Services and DOF = Department of Finance. Posted July 2015. |
|||||
Higher Education
Higher Education Core Funding
(Dollars in Millions)
|
2013-14 |
2014-15 |
2015-16 |
Change From 2014-15 |
||
|
Amount |
Percent |
||||
|
UC |
|||||
|
General Funda |
$2,844 |
$2,991 |
$3,232 |
$241 |
8% |
|
Net tuitionb |
2,671 |
2,782 |
2,909 |
128 |
5 |
|
Other UC core funds |
314 |
323 |
323 |
— |
— |
|
Lottery |
31 |
39 |
39 |
— |
— |
|
Subtotals |
($5,860) |
($6,134) |
($6,503) |
($369) |
(6%) |
|
CSU |
|||||
|
General Funda |
$2,769 |
$3,026 |
$3,280 |
$254 |
8% |
|
Net tuitionb |
2,145 |
2,133 |
2,157 |
24 |
1 |
|
Lottery |
36 |
59 |
59 |
— |
— |
|
Subtotals |
($4,949) |
($5,219) |
($5,497) |
($278) |
(5%) |
|
CCC |
|||||
|
General Funda |
$4,636 |
$5,408 |
$5,742 |
$334 |
6% |
|
Local property tax |
2,182 |
2,263 |
2,613 |
350 |
15 |
|
Enrollment fees |
406 |
407 |
416 |
9 |
2 |
|
Lottery |
193 |
186 |
186 |
— |
— |
|
Subtotals |
($7,418) |
($8,264) |
($8,957) |
($693) |
(8%) |
|
Hastings |
|||||
|
Net tuitionb |
$33 |
$31 |
$29 |
-$2 |
-7% |
|
General Funda |
10 |
11 |
12 |
$1 |
13 |
|
Subtotalsc |
($43) |
($42) |
($41) |
(-$1) |
(-2%) |
|
CSAC |
|||||
|
General Fund |
$1,059 |
$1,554 |
$1,614 |
$60 |
4% |
|
TANF funds |
542 |
377 |
521 |
143 |
38 |
|
SLOF |
98 |
— |
— |
— |
— |
|
Other |
29 |
36 |
17 |
-19 |
-53 |
|
Subtotals |
($1,727) |
($1,967) |
($2,152) |
($185) |
(9%) |
|
California Institute for Regenerative Medicine |
|||||
|
General Funda |
$95 |
$275 |
$369 |
$93 |
34% |
|
Awards for Innovation in Higher Education |
|||||
|
General Fund |
— |
$50 |
— |
-$50 |
— |
|
Totalsd |
$18,916 |
$20,605 |
$22,042 |
$1,437 |
7% |
|
General Fund |
$11,413 |
$13,315 |
$14,249 |
$934 |
7 |
|
Net tuition/feesd |
4,078 |
4,008 |
4,036 |
28 |
1 |
|
Local property tax |
2,182 |
2,263 |
2,613 |
350 |
15 |
|
Other |
982 |
736 |
860 |
124 |
17 |
|
Lottery |
260 |
284 |
284 |
— |
— |
|
aFor all institutions, includes general obligation bond debt service. For UC and CSU, includes deferred maintenance funding from Control Section 6.10. For CSU, also includes health benefit costs for retirees that are accounted for in a different budget line item. For CCC, includes state contributions to CalSTRS and Quality Education Investment Act funds. bReflects tuition after discounts. In 2015-16, UC, CSU, and Hastings plan to provide $1 billion, $657 million, and $12 million, respectively, in tuition discounts. cHastings is receiving about $190,000 in Lottery funds. dDoes not include UC and CSU tuition paid from Cal Grants and Middle Class Scholarships. Those monies are included in General Fund. SLOF = Student Loan Operating Fund. Posted October 2015. |
|||||
Higher Education General Fund Support
(Dollars in Millions)
|
2013-14 |
2014-15 |
2015-16 |
Change from 2014-15 |
||
|
Amount |
Percent |
||||
|
University of Californiaa |
$2,844 |
$2,991 |
$3,232b |
$241 |
8% |
|
California State Universitya,c |
2,769 |
3,026 |
3,280 |
254 |
8 |
|
California Community Collegesa,d |
4,636 |
5,408 |
5,742 |
334 |
6 |
|
Hastings College of Lawa |
10 |
11 |
12 |
1 |
13 |
|
California Student Aid Commissione |
1,699 |
1,937 |
2,135 |
198 |
10 |
|
California Institute for Regenerative Medicinea |
95 |
275 |
369 |
93 |
34 |
|
Awards for Innovation in Higher Education |
— |
50 |
— |
-50 |
-100 |
|
Totals |
$12,053 |
$13,698 |
$14,770 |
$1,072 |
8% |
|
aIncludes general obligation debt service. bDoes not include $25 million that UC will receive if it meets 2015-16 Budget Act enrollment expectations. cIncludes health benefit costs for retirees. dIncludes state contributions to the California State Teachers’ Retirement System, Quality Education Investment Act funds, Adult Education Block Grant funds, and funding for CCC Chancellor’s Office. eIncludes Temporary Assistance for Needy Families, Student Loan Operating Fund, and Student Loan Authority Fund support that directly offsets General Fund costs. Posted October 2015. |
|||||
2014-15 Higher Education Major General Fund Changes
(In Millions)
|
Technical Adjustmentsa |
$77 |
|
California Community Colleges |
|
|
Pay down mandate backlog |
$393 |
|
Eliminate deferrals |
94 |
|
Fund basic skills initiatives |
70 |
|
Extend Career Technical Education Pathways |
48 |
|
Fund maintenance and instructional equipment |
48 |
|
Support implementation of baccalaureate degree pilot program |
6 |
|
Financial Aid |
|
|
Revise estimate of Cal Grant participation |
15 |
|
Replace $6 million in SLAF support for Cal Grants with General Fundb |
— |
|
Revise estimate of Middle Class Scholarship participation |
-45 |
|
Other |
-1 |
|
Total 2014-15 Changes |
$705 |
|
aIncludes certain adjustments for debt service, employee compensation, retirement costs, and unspent prior-year funds. bProposal has no programmatic effect. SLAF = Student Loan Authority Fund. Posted October 2015. |
|
2015-16 Higher Education Major General Fund Changes
(In Millions)
|
Technical Adjustments |
|
|
Back out prior-year one-time fundsa |
-$1,093 |
|
Otherb |
-186 |
|
California Community Colleges |
|
|
Fund adult education consortia |
$500 |
|
Increase apportionmentsc |
485 |
|
Augment Student Success and Support Program and student equity plans |
185 |
|
Pay down mandate backlog (one time) |
117 |
|
Fund maintenance and instructional equipment (one time) |
100 |
|
Hire additional full-time faculty |
62 |
|
Fund CDCP noncredit courses at credit rate |
50 |
|
Provide funds to restore enrollment earned back by districts |
42 |
|
Supplement Cal Grant B awards for full-time students |
39 |
|
Augment Extended Opportunity Programs and Services |
35 |
|
Implement institutional effectiveness initiative |
15 |
|
Fund new apprenticeships in high-demand occupations |
15 |
|
Increase funding for established apprenticeships |
14 |
|
Fund administration of Cal Grant B supplements for full-time students (one time) |
3 |
|
Provide 1.02 percent COLA for select categorical programs |
2 |
|
Universities |
|
|
Increase base funding for CSUd |
$216 |
|
Increase base funding for UCe |
119 |
|
Fund UC unfunded retirement liability (one time) |
96 |
|
Fund deferred maintenance at CSU (one time) |
25 |
|
Fund deferred maintenance at UC (one time) |
25 |
|
Fund labor research and education centers at two UC campuses |
4 |
|
Increase CSU funding for specified state priorities |
1 |
|
Increase base funding for Hastings College of the Law |
1 |
|
Create UC-administered grants to rescue stranded marine mammals (one time) |
1 |
|
Financial Aid |
|
|
Revise estimate of Cal Grant participation |
$145 |
|
Adjust Middle Class Scholarship eligibility criteria and participation estimate |
20 |
|
Backfill expiring federal funds used for state financial aid outreach and awards |
15 |
|
Delay reduction in Cal Grant award for students at private non-profits |
9 |
|
Increase number of Cal Grant competitive awards |
8 |
|
Fund planning for CSAC technology improvements |
1 |
|
Replace $143.5 million in General Fund support for Cal Grants with TANFf |
— |
|
Total 2015-16 Changes |
$1,072 |
|
aIncludes one-time funds for retiring community college deferrals, paying down the community college mandate backlog, and supporting various other one-time initiatives. bIncludes adjustments for debt service, employee compensation, retirement costs, and offsetting revenues. cReflects a 5 percent unallocated increase, 3 percent enrollment growth, and a 1.02 percent COLA. dIncludes $11 million for increasing tenure and tenure-track faculty. Budget also sets expectation that CSU enroll 10,400 additional resident full-time equivalent students by fall 2016 compared to 2014-15. eDoes not include $25 million that UC will receive later in the fiscal year if it shows evidence of increasing 2016-17 resident undergraduate enrollment by 5,000 students compared to 2014-15. fProposal has no programmatic effect. CDCP = Career Development and College Preparation; COLA = cost-of-living adjustment; and CSAC = California Student Aid Commission. Posted October 2015. |
|
Community College Programs Funded by Proposition 98
(Dollars in Millions)
|
2013-14 |
2014-15 |
2015-16 |
Change From 2014-15 |
||
|
Amount |
Percent |
||||
|
Apportionments |
|||||
|
General Fund |
$3,049 |
$3,114 |
$3,417 |
$303 |
10% |
|
Local property tax |
2,182 |
2,263 |
2,613 |
350 |
15 |
|
Subtotals |
($5,231) |
($5,377) |
($6,030) |
($654) |
(12%) |
|
Categorical Programs and Other Appropriations |
|||||
|
Adult Education Block Grant |
$25a |
—a |
$500 |
$500 |
— |
|
Student Success and Support Program |
99 |
$199 |
299 |
100 |
50% |
|
Student equity plan implementation |
— |
70 |
155 |
85 |
121 |
|
Extended Opportunity Programs and Services |
89 |
89 |
123 |
35 |
39 |
|
Mandate backlog payment (one time) |
94 |
443 |
117 |
-325 |
-74 |
|
Disabled Students Program |
84 |
114 |
115 |
1 |
1 |
|
Physical plant and instructional support (one time) |
30 |
196 |
100 |
-96 |
-49 |
|
Financial aid administration |
68 |
69 |
74 |
4 |
6 |
|
Lease revenue bond payments |
64 |
65 |
56 |
-9 |
-14 |
|
Cal Grant B supplemental grants |
— |
— |
39 |
39 |
— |
|
Proposition 39 (grant and loan programs) |
50 |
38 |
39 |
1 |
3 |
|
CalWORKs student services |
35 |
35 |
35 |
— |
1 |
|
Mandate block grantb |
33 |
32 |
32 |
-1 |
-2 |
|
Apprenticeship (community colleges) |
7 |
7 |
31 |
24 |
338 |
|
Part-time faculty compensation |
25 |
25 |
25 |
— |
— |
|
Economic and Workforce Development |
23 |
73 |
23 |
-50 |
-69 |
|
Apprenticeship (school districts) |
16 |
16 |
20 |
5 |
31 |
|
Student Success for Basic Skills Students |
20 |
20 |
20 |
— |
— |
|
Telecommunications and technology services |
16 |
22 |
20 |
-2 |
-9 |
|
Institutional effectiveness initiative |
— |
3 |
18 |
15 |
600 |
|
Nursing grants |
13 |
13 |
13 |
— |
— |
|
Online course initiative |
17 |
10 |
10 |
— |
— |
|
Foster Parent Education Program |
5 |
5 |
5 |
— |
— |
|
Fund for Student Success |
4 |
4 |
4 |
— |
— |
|
Part-time faculty office hours |
4 |
4 |
4 |
— |
— |
|
Campus child care support |
3 |
3 |
3 |
— |
1 |
|
Otherc |
1 |
1 |
1 |
— |
— |
|
Equal Employment Opportunity |
1 |
1 |
1 |
— |
— |
|
Transfer education and articulation |
1 |
1 |
1 |
— |
— |
|
District financial crisis oversight |
1 |
1 |
1 |
— |
— |
|
Deferral pay down |
326 |
158 |
— |
-158 |
-100 |
|
Basic skills transformation grants (one time) |
— |
60 |
— |
-60 |
-100 |
|
CTE Pathways Initiative (one time) |
48 |
48d |
—d |
-48 |
-100 |
|
Innovation awards (one time) |
— |
23 |
— |
-23 |
-100 |
|
Basic skills partnership pilot (one time) |
— |
10 |
— |
-10 |
-100 |
|
Baccalaureate degree pilot start-up |
— |
6 |
— |
-6 |
-100 |
|
Subtotals |
($1,200) |
($1,861) |
($1,883) |
($22) |
(1%) |
|
Totals |
$6,431 |
$7,238 |
$7,914 |
$676 |
9% |
|
a2013-14 amount was for planning grants, available for expenditure over 2013-14 and 2014-15 fiscal years. bIncludes $17,000 each year for mandate reimbursements. cIncludes part-time faculty health insurance and Academic Senate. d2014-15 amount is for 2015-16 program costs. State also provided $48 million non-Proposition 98 General Fund in 2014-15 for expenditure in 2014-15. CTE= Career Technical Education. Updated October 2015. |
|||||
Declarations, Reports, and Requirements for Universitiesa
|
University of California |
|
|
Findings and declarations |
(1) The UC Regents have endorsed a long-term funding framework that calls for flat tuition in 2015-16 and 2016-17 and actions to reduce the cost structure of the university. (2) The framework will create capacity for all campuses to serve more resident students. (3) Funding besides state funding (such as financial aid currently provided to nonresident students) is available to serve more resident students. (4) The Legislature intends for funds from nonresident enrollment growth and nonresident tuition increases be used to increase resident enrollment. (5) The appropriation in the 2015-16 budget for unfunded liabilities of the University of California Retirement Plan (UCRP) does not constitute an obligation on behalf of the state to appropriate any additional funds in subsequent years for UCRP. |
|
Reporting requirements |
(1) Report by November 30, 2015 a sustainability plan with enrollment projections, performance targets, and changes needed to ensure expenditures do not exceed available resources, using General Fund and tuition revenue assumptions provided by the Department of Finance. (2) Report by December 1, 2015 on performance and cost reduction measures undertaken as a result of the Select Advisory Committee on the Cost Structure of the University. (3) Supplemental report by December 10, 2015 on university fund sources legally allowable to support educational costs, the factors used to determine which funds support educational activities, and the sources of funds used to calculate educational costs. (4) Report by April 1, 2016 on funds used for targeted support services to increase graduation rates of low-income and underrepresented students. (5) Upon receipt of funding appropriated for the UCRP unfunded liability, UC must submit a report demonstrating the funds have been used to supplement and not supplant funding otherwise available for UCRP. |
|
Required actions |
(1) The UC Regents are required to consider state employee compensation when considering compensation for employees in its “Senior Management Group.” At a minimum, the UC Regents are required to consider comparable positions designated as “state officers” (such as the Governor, Superintendent of Public Instruction, and a Member of the Legislature) and certain state agency directors (such as the Director of Finance and the Secretary of Transportation). (2) The UC Regents are required to post information online for each subcategory within its “Managers and Senior Professionals” personnel category as well as disaggregate all personnel categories by fund source. |
|
California State University |
|
|
Reporting requirements |
(1) Report by November 30, 2015 a sustainability plan with enrollment projections, performance targets, and changes needed to ensure expenditures do not exceed available resources, using General Fund and tuition revenue assumptions provided by the Department of Finance. (2) Report by April 1, 2016 on factors impacting graduation rates for all students and for low-income and underrepresented students separately. |
|
Legislative Analyst’s Office |
|
|
Reporting requirement |
Report by January 1, 2017 on the need for new CSU campuses within certain regions of the state and by January 1, 2018 on the need for new UC campuses statewide (Chapter 22). |
|
Office of Planning and Research |
|
|
Reporting requirement |
Report by December 1, 2017 on the proportion of high school graduates eligible for admission to UC and CSU as freshmen (Chapter 324). |
|
Hastings College of the Law |
|
|
Reporting requirement |
Supplemental report by September 30, 2015 on a proposed formula to fund enrollment growth and adjust for enrollment declines. |
|
aAuthorized in the 2015-16 Budget Act, the Supplemental Report of the 2015-16 Budget Act, Chapter 22, Statutes of 2015 (SB 81, Committee on Budget and Fiscal Review), and Chapter 324, Statutes of 2015 (SB 103, Committee on Budget and Fiscal Review). Posted October 2015. |
|
UC Performance and Cost Reduction Measures
|
Measure |
Description |
Implementation Time Line |
|
Streamline Transfer Pathways |
UC is to closely align its lower-division requirements for its 20 most popular majors with those used by CSU and CCC for associate degrees for transfer. It also will consider adopting the common course numbering system used by CSU and CCC. |
During 2015-16 and 2016-17. |
|
Increase Transfer Enrollment |
UC has committed to admitting one transfer student for every two freshman students at all campuses (but Merced). |
By 2017-18. |
|
Review Units Required for Majors |
UC has agreed to reduce the number of units required for a major to no more than 45 upper-division units “wherever possible” in 75 percent of majors at each campus (except the Los Angeles campus because it already has undertaken such a review). |
Not specified. |
|
Review Exam Credit Policies |
The UC President is to strongly encourage UC faculty to review its policies on awarding credits to students successfully passing (1) Advanced Placement tests taken in high school and (2) exams administered by the College Board to measure mastery of college-level material. |
Not specified. |
|
Create Alternative Pricing Models for Summer Session |
Three campuses are to create alternative pricing models for the summer session to provide an incentive for more students to enroll during that term. |
Start by summer 2016. |
|
Identify Three-Year Degree Pathways |
UC is to identify three-year degree pathways in 10 of its top 15 majors, with a goal of having 5 percent of students enrolled in these accelerated degree pathways. |
Develop degree pathways by March 1, 2016.Achieve enrollment goal by summer 2017. |
|
Increase Use of Data and Technology |
UC is to report on how campuses are using data and technology to help students succeed and close achievement gaps. It also will initiate a multicampus pilot program to use adaptive learning technologies to improve instruction and student persistence. |
Not specified. |
|
Expand Online Course Offerings |
UC is to expand upon efforts begun in recent years to increase the number of online courses it offers. As part of this effort, UC will convene a group of industry leaders to identify which online certificate and master’s degree programs could benefit California’s workforce. |
Convene industry group during summer 2015. No time line specified for course expansion. |
|
Implement New Way of Calculating Costs |
Three UC campuses are to pilot “activity-based costing” to calculate educational costs in certain departments. |
Not specified. |
|
Posted October 2015. |
||
Higher Education Annual Tuition and Fees
Mandatory Charges for Full-Time Resident Students
|
2013-14 |
2014-15 |
2015-16 |
|
|
University of California |
|||
|
Systemwide Tuition and Fees |
|||
|
Undergraduate |
$12,192 |
$12,192 |
$12,240a |
|
Graduate—Academic |
12,192 |
12,192 |
12,240a |
|
Graduate—Professionalb |
16,192 to 50,740 |
16,192 to 50,740 |
16,440 to 52,668a |
|
Average Campus Feec |
1,030 |
1,125 |
1,125 |
|
California State University |
|||
|
Systemwide Tuition and Fees |
|||
|
Undergraduate |
5,472 |
5,472 |
5,472 |
|
Teacher credential |
6,348 |
6,348 |
6,348 |
|
Graduate—Master’sd |
6,738 |
6,738 |
6,738 |
|
Graduate—Doctorale |
11,118 to 16,148 |
11,118 to 16,148 |
11,118 to 16,148 |
|
Average Campus Fee |
1,223 |
1,223 |
1,223 |
|
California Community Colleges |
1,380 |
1,380 |
1,380 |
|
Hastings College of the Lawf |
44,186 |
44,186 |
44,186 |
|
aReflects 5 percent increase in Student Services Fee and Professional Degree Fees announced by UC at May Revision. bReflects range for students in business, law, medicine, nursing, and other professional programs. cReflects average for undergraduates. Campus fees for graduate and professional students are lower. dGraduate fees also apply to postbaccalaureate programs other than teacher credential programs. eIncludes professional doctorates in education, nursing, and physical therapy. fReflects tuition for juris doctor (JD) program only. Non-JD programs do not use residency classifications. Updated October 2015. |
|||
Higher Education Enrollment
(Resident Full-Time Equivalent [FTE] Studentsa)
|
2013-14 |
2014-15 |
2015-16 |
Change From 2014-15 |
||
|
Amount |
Percent |
||||
|
University of California |
|||||
|
Undergraduate |
172,535 |
174,102 |
174,102b |
— |
— |
|
Graduate |
37,332 |
37,165 |
37,165 |
— |
— |
|
Subtotals |
(209,867) |
(211,267) |
(211,267) |
(—) |
(—) |
|
California State University |
|||||
|
Undergraduate |
316,151 |
322,439 |
327,827 |
5,388 |
2% |
|
Graduate and Other Postbaccalaureate |
30,522 |
31,213 |
31,735 |
522 |
2 |
|
Teacher Credential |
5,283 |
5,357 |
5,447 |
90 |
2 |
|
Subtotals |
(351,955) |
(359,009) |
(365,009c) |
(6,000) |
(2%) |
|
California Community Collegesd |
1,106,773 |
1,135,924 |
1,162,190 |
26,266 |
2% |
|
Hastings College of the Lawe |
927 |
818 |
778 |
-40 |
-5% |
|
Totals |
1,669,522 |
1,707,018 |
1,739,244 |
32,226 |
2% |
|
aAt UC and CSU, 1 FTE student represents 30 credit units for an undergraduate and 24 credit units for a graduate student. At CCC, 1 FTE student represents 525 contact hours per year, which on average generates about 24 credits. bThe 2015-16 budget authorizes the Director of Finance to provide UC $25 million if UC can demonstrate by May 1, 2016 that it will enroll 5,000 more resident undergraduate students in 2016-17 as compared to 2014-15. The UC expects resident enrollment to remain flat in 2015-16. cThe 2015-16 budget directs CSU to enroll 10,400 more resident FTE students in 2016-17 as compared to 2014-15. The CSU anticipates resident enrollment to increase by at least 6,000 FTE students in 2015-16. dReflects funded enrollment levels. eIncludes juris doctor (JD) program only. Non-JD programs do not use residency classifications. Posted October 2015. |
|||||
Financial Aid
Cal Grant Spending
(Dollars in Millions)
|
2013-14 |
2014-15 |
2015-16 |
Change From 2014-15 |
||
|
Amount |
Percent |
||||
|
Total Spending |
$1,673 |
$1,850 |
$2,015 |
$164 |
9% |
|
By Segments: |
|||||
|
University of California |
$780 |
$816 |
$862 |
$45 |
6% |
|
California State University |
518 |
622 |
700 |
78 |
13 |
|
Private nonprofit institutions |
237 |
246 |
249 |
3 |
1 |
|
California Community Colleges |
101 |
127 |
146 |
19 |
15 |
|
Private for-profit institutions |
37 |
39 |
58 |
19 |
50 |
|
By Program: |
|||||
|
High School Entitlement |
$1,331 |
$1,486 |
$1,599 |
$113 |
8% |
|
CCC Transfer Entitlement |
236 |
226 |
236 |
10 |
5 |
|
Competitive |
100 |
129 |
162 |
34 |
26 |
|
Cal Grant C |
6 |
10 |
17 |
7 |
75 |
|
By Award Type: |
|||||
|
Cal Grant A |
$966 |
$1,041 |
$1,108 |
$67 |
6% |
|
Cal Grant B |
701 |
799 |
890 |
90 |
11 |
|
Cal Grant C |
6 |
10 |
17 |
7 |
75 |
|
By Renewal or New: |
|||||
|
Renewal |
$1,107 |
$1,280 |
$1,405 |
$125 |
10% |
|
New |
566 |
570 |
609 |
40 |
7 |
|
By Funding Source: |
|||||
|
General Fund |
$1,033 |
$1,473 |
$1,492 |
$19 |
1% |
|
Federal TANF |
542 |
377 |
521 |
143 |
38 |
|
Student Loan Operating Fund |
98 |
— |
— |
— |
— |
|
College Access Tax Credit Fund |
— |
— |
2 |
2 |
— |
|
Posted October 2015. |
|||||
Cal Grant Recipients
|
2013-14 |
2014-15 |
2015-16 |
Change From 2014-15 |
||
|
Change |
Percent |
||||
|
Total Recipients |
295,868 |
324,044 |
359,666 |
35,622 |
11% |
|
By Segments |
|||||
|
California State University |
103,623 |
117,287 |
130,227 |
12,940 |
11% |
|
California Community Colleges |
92,881 |
101,920 |
115,075 |
13,155 |
13 |
|
University of California |
65,882 |
69,660 |
73,222 |
3,562 |
5 |
|
Private nonprofit institutions |
27,143 |
28,009 |
28,546 |
537 |
2 |
|
Private for-profit institutions |
6,340 |
7,167 |
12,595 |
5,428 |
76 |
|
By Program |
|||||
|
High School Entitlement |
218,296 |
241,497 |
263,640 |
22,143 |
9% |
|
Competitive |
38,799 |
44,020 |
51,755 |
7,735 |
18 |
|
CCC Transfer Entitlement |
30,449 |
28,680 |
30,007 |
1,327 |
5 |
|
Cal Grant C |
8,323 |
9,846 |
14,263 |
4,417 |
45 |
|
By Award Type |
|||||
|
Cal Grant B |
184,675 |
202,945 |
227,220 |
24,275 |
12% |
|
Cal Grant A |
102,869 |
111,252 |
118,182 |
6,930 |
6 |
|
Cal Grant C |
8,323 |
9,846 |
14,263 |
4,417 |
45 |
|
By Renewal or New |
|||||
|
Renewal |
170,733 |
193,825 |
219,802 |
25,977 |
13% |
|
New |
125,135 |
130,219 |
139,864 |
9,645 |
7 |
|
Totals do not match across all categories due to modeling issues. Posted October 2015. |
|||||
Summary of Middle Class Scholarship Awards and Program Changesa
|
Recipients and Costs by Segmenta |
||||
|
Segment |
Recipients |
Cost |
Average Cost |
|
|
California State University |
69,332 |
$40,384,277 |
$582 |
|
|
University of California |
16,688 |
17,428,435 |
1,044 |
|
|
Totals |
86,020 |
$57,812,712 |
$672 |
|
|
Eligibility Changesb |
||||
|
Start Year |
New Rule |
|||
|
2015-16 |
Excludes students whose household assets exceed $150,000. The asset ceiling does not include primary residences and funds in retirement accounts. |
|||
|
2016-17 |
Moving forward, requires income and asset ceilings to be adjusted for inflation. |
|||
|
2016-17 |
Moving forward, prohibits recipients from receiving assistance for more than the equivalent of four years (or, in some cases, five years) of full-time attendance. Exceptions are made for students in five-year teacher preparation programs and some engineering programs, among others. |
|||
|
Funding Changesb (In Millions) |
||||
|
Budget Year |
Original Appropriationc |
New Appropriation |
||
|
2014-15 |
$107 |
$62d |
||
|
2015-16 |
$152 |
$82 |
||
|
2016-17 |
228 |
116 |
||
|
2017-18 |
305 |
159 |
||
|
aFor the 2014-15 academic year, as of June 3, 2015. In 2014-15, the maximum award amount is 14 percent of tuition at CSU ($766) and UC ($1,707). Students with household income less than or equal to $100,000 receive the maximum award. Students with household income of $100,000 to $150,000 receive an award that is graduated downward for each $1,000 increase in income. bAs enacted by Chapter 22, Statutes of 2015, SB 81 (Committee on Budget and Fiscal Review). cAs authorized under the implementing legislation—Chapter 50, Statutes of 2013, AB 94 (Committee on Budget). dReflects estimated expenditures as of May 2015. Posted October 2015. |
||||