November 20, 2008
California's Fiscal Outlook: LAO Projections 2008-09 Through 2013-14
Summary
Plummeting Revenues Yield $28 Billion Hole
The state’s struggling economy has severely reduced expected revenues. Combined with rising state expenses, we project that the state will need $27.8 billion in budget solutions over the 2008–09 and 2009–10 fiscal years.
Long–Term Outlook Similarly Bleak
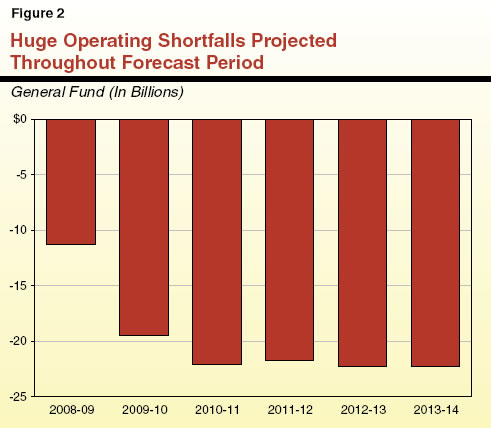
The state’s revenue collapse is so dramatic and the underlying economic factors are so weak that we forecast huge budget shortfalls through 2013–14 absent corrective action. From 2010–11 through 2013–14, we project annual shortfalls that are consistently in the range of $22 billion.
LAO Bottom Line
Closing a projected $28 billion budget shortfall will be a monumental task. We believe the Legislature must take major ongoing actions by both reducing base spending and increasing revenues. If the Legislature has any hope of developing a fiscally responsible 2009–10 budget, it must begin laying the groundwork now.
Table of Contents
Chapter 1 The Budget Outlook
Chapter 2 Economic and Demographic Projections
Chapter 3 Revenue Projections
Chapter 4 Expenditure Projections
Chapter 1
The Budget Outlook
On November 11, 2008, we provided the Legislature with our report Overview of the Governor’s Special Session Proposals. In that report, we concluded that the state faces a $27.8 billion deficit at the end of 2009–10 if no corrective action is taken. In addition, we advised that the state’s annual operating shortfalls would be in the range of $22 billion through 2013–14. This report provides more of the details behind those findings.
This report provides our projections of the state’s General Fund revenues and expenditures for 2008–09 through 2013–14 under current law, absent any actions to close the state’s budget gap. Our fiscal projections primarily reflect current–law spending requirements and tax provisions, while relying on our independent assessment of the outlook for California’s economy, demographics, revenues, and expenditures. In other words, this report does not consider the effect of any of the tax increase or spending reduction proposals made by the Governor as part of the special session. The basis of our assumptions is described in the nearby box.
Basis for Our Estimates
Our revenue and expenditure forecasts are based primarily on the requirements of current law, including constitutional requirements (such as Proposition 98) and statutory requirements (such as cost–of–living adjustments). In other cases, the estimates incorporate effects of projected changes in caseloads, prices, federal requirements, court orders, and other factors affecting program costs.
Projections, Not Predictions. Our estimates are not predictions of what the Legislature and Governor will adopt as policies and funding levels in future budgets. Rather, our estimates are intended to be a reasonable baseline projection of what would happen if current–law policies were allowed to operate in the future. In this regard, we believe that our forecast provides a meaningful starting point for legislative deliberations involving the state’s budget so that corrective actions can be taken. Because no action had been taken at the time this publication was prepared, the estimates exclude the effects of any special session solutions being considered by the Legislature. Similarly, the estimates do not include any fiscal effects of the lottery and budget reform proposals not yet approved by the state’s voters (though the potential effect of these measures is discussed in this chapter). |
The Deteriorating 2008–09 Budget
$1.7 Billion Reserve Was Short–Lived
At the time the 2008–09 Budget Act was adopted in September 2008, the budget plan had an estimated $1.7 billion reserve. In order to balance the budget, the plan largely relied on a number of one–time revenue measures while avoiding any tax rate increases. Within weeks of the budget passing, the national financial and credit markets and state revenues deteriorated well beyond the assumptions in the budget. It quickly became clear that the Legislature would need to take additional actions in order to bring the 2008–09 budget back into balance.
Projected Current–Year Deficit of $8 Billion
We have updated our forecast of the 2008–09 General Fund condition to reflect updated revenue and expenditure forecasts based on current economic circumstances. As a result of these updated projections, we estimate that the state faces a 2008–09 year–end deficit of $8.4 billion if no actions are taken. The main factor driving this $10 billion reversal of fortunes is declining revenues, with some increased costs also contributing to the problem.
Deteriorating Economy and Revenues. As described in more detail in Chapter 2, the near–term outlook for the state’s economy has turned extremely negative due to reduced consumer spending, higher unemployment, the near collapse of the financial and credit markets, and other factors. Consequently (as described in Chapter 3), our forecast of all three of the state’s major taxes—the personal income tax, sales and use tax, and corporation tax—are down considerably from the estimates used in the enacted budget. In total, we project these “big three” revenues will fall short of the earlier estimates by more than $8 billion.
Higher Spending in Some Programs. Our updated spending forecast also contains negative factors widening the current–year shortfall. By far, the largest adjustment is higher state spending due to a reduction in the expected property taxes received by school districts—principally caused by the rapid decline in the state’s housing market. Over 2007–08 and 2008–09, we project the state will need to make up about $850 million in reduced property taxes (with an additional $600 million effect in 2009–10). Other major adjustments include higher expected caseloads in a number of health and social services programs, higher firefighting costs, less–than–assumed savings from unallocated reductions, and a shortfall in transportation funds available to redirect to benefit the General Fund. In total, net costs through the current fiscal year are about $1.4 billion higher than assumed with the enactment of the 2008–09 budget.
Massive Problem Looming in 2009–10
Even at the time the 2008–09 budget was signed, policymakers acknowledged a multibillion–dollar shortfall for the upcoming 2009–10 budget. Combined with the steep revenue drop and some spending increases, that shortfall has grown considerably. We project that General Fund revenues will decline by 7 percent from their 2008–09 level to $86.8 billion. This is the result of (1) the expected continued slide in the state’s economy and (2) the more than $4 billion in one–time revenues included in the 2008–09 Budget Act as budgetary solutions. On the other hand, we project that spending will increase by 1.7 percent to $106.3 billion. Consequently, 2009–10 state spending would exceed revenues by $19.4 billion. When combined with the current–year deficit, we project that the state will need to close a $27.8 billion gap over the two years combined. In other words, the state would have a $27.8 billion deficit on June 30, 2010,absent corrective action. Figure 1 shows the state’s General Fund condition through 2009–10 under our updated projection.
Figure 1
LAO Projection of General Fund Condition
If No Corrective Actions Are Taken |
2007-08 Through 2009-10
(In Millions) |
|
2007‑08 |
2008‑09 |
2009‑10 |
Prior-year fund balance |
$4,777 |
$3,786 |
-$7,501 |
Revenues and transfers |
102,649 |
93,248 |
86,835 |
Total resources available |
$107,426 |
$97,034 |
$79,334 |
Expenditures |
$103,640 |
$104,535 |
$106,293 |
Ending fund balance |
$3,786 |
-$7,501 |
-$26,959 |
Encumbrances |
885 |
885 |
885 |
Reserve |
$2,901 |
-$8,386 |
-$27,844 |
Budget Stabilization Account |
— |
— |
— |
Special Fund for Economic
Uncertainties |
$2,901 |
— |
— |
State Also Faces Huge Shortfalls in the Longer Term
Our fiscal forecast also looks beyond the 2009–10 budget year to see where the state’s finances are headed in the longer term, through 2013–14. In some of our prior forecasts, the state’s finances improved over the forecast period as revenue growth outpaced spending trends. In contrast, under our current forecast, the state’s revenue collapse is so dramatic and the underlying economic factors are so weak that we forecast huge budget shortfalls through 2013–14 absent corrective action. Even once revenues begin to rebound in the later years of the forecast, some fast–growing spending programs (such as Medi–Cal, some social services programs, and infrastructure debt–service payments) would prevent the state from reducing its annual imbalance between revenues and spending. As shown in Figure 2, from 2010–11 through 2013–14, we project annual shortfalls that are consistently in the range of $22 billion.
Implications of the 2009 Special Election
As part of the 2008–09 budget package passed in September, the Legislature put forward two propositions that would go before the state’s voters at a special election planned for the first half of 2009. If approved by voters, these measures—dealing with the lottery and budget reform—would have significant effects on the state’s fiscal condition beginning in 2009–10 and throughout our forecast period. Because both of these proposals have yet to be approved, we have not included their effects in our forecast of the budget problem under current law.
Lottery. The state’s current plan envisions securitizing lottery profits in order to benefit the General Fund in the short term—$5 billion each in 2009–10 and 2010–11—through the sale of lottery bonds. Thus, if the measure is approved by the voters and the state successfully sells the first batch of lottery bonds, the state would achieve a budgetary solution of $5 billion in 2009–10. Yet, the lottery plan could cost the state nearly $1 billion annually by 2013–14—after accounting for debt–service payments on the bonds and General Fund increases to educational entities (which would no longer receive lottery profits).
Budget Reform. The budget reform measure would likely result in higher levels of reserves in the future. It would redirect, in specific circumstances, General Fund revenues to a restricted reserve account and make the funds harder to access. The measure, therefore, could make balancing the budget more difficult over the forecast period—by limiting the availability of funds to help balance the budget. The ability to forecast its precise effect on the state budget, however, is difficult. This is because the impact would depend on (1) the state’s ability to accurately forecast revenues and (2) growth of both revenues and spending.
Additional Risks, Uncertainties, and Cost Pressures
Our forecast captures our best estimates at this time regarding the state’s fiscal condition. Yet, the state faces a number of other risks, uncertainties, and cost pressures not accounted for in our forecast as discussed below.
Economic Uncertainty. While every revenue forecast has some uncertainty, today’s economy is particularly volatile. Continuing negative economic news means that our forecast has considerable downside risk.
Prison Health Care. The state continues to deal with a variety of federal lawsuits related to the correctional health care system. While our forecast includes many costs associated with these lawsuits, there is the potential for the courts to order additional expenditures.
Retirement Liabilities. The failing economy and dramatic drops in the stock market have reduced the state’s assets on hand to pay for future pension costs. Under the state’s system of retirement payments, these losses will be spread out over many years. While our forecast includes some costs to reflect these losses, costs could surge even higher if the investment losses persist or worsen. In the coming years, the state could also face higher costs from retirement programs where the state currently does not contribute funds, such as for retiree health unfunded liabilities and the University of California’s Retirement Plan.
Health and Social Services Caseloads. Residents facing difficult economic times are more likely to use many of the state’s health and social services programs. Our forecast, therefore, assumes somewhat higher caseloads in the coming years as a result of the deteriorating economy. If caseloads increase faster than we currently project, however, state General Fund costs could rise even higher. For instance, a 1 percent rise in caseloads above our estimates in the state’s major health and social services programs would increase costs by several hundred million dollars annually.
Keys to Balancing the Budget
As we advised the Legislature last week, closing the current budget gap will be a monumental task. As the Legislature crafts a plan to bring the 2008–09 and 2009–10 budgets into balance, there are some key components that should be part of the approach:
- Early Action. If the Legislature has any hope of developing a fiscally responsible 2009–10 budget, it must begin laying the groundwork now. Solutions often need early action in order to get a full year’s worth of savings in 2009–10. Actions now will also ensure that the state can continue to meet its cash flow demands.
- Balanced Approach. The magnitude of the budget shortfall is too great to close on only one side of the ledger—base spending must be decreased and revenues must be increased.
- Long–Lasting Solutions. With little prospect of a quick economy recovery, the state’s budget problems demand long–term solutions. The Legislature should focus on actions that have ongoing impacts.
- Rethink State Operations. While demanding many difficult choices, a budget crisis is also a good opportunity for the Legislature to rethink the way the state operates. For instance, duplicative programs and nonessential services can be eliminated, ineffective programs can be restructured, and which level of government is responsible for service delivery can be reconsidered. Some of these types of changes can take months or even years to implement. With huge budget shortfalls expected for the next five years, however, now is an ideal time to put these types of changes in motion.
- No New Borrowing. The state faces $18 billion in outstanding budgetary borrowing from decisions reached in balancing budgets earlier this decade. Engaging in additional borrowing that simply pushes the budget problem into 2010–11 or beyond would only worsen the situation in the out–years.
Chapter 2
Economic and Demographic Projections
Economic and demographic developments are important determinants of California’s fiscal condition. They affect both revenues (especially tax receipts) and expenditures in such areas as education, health, social services, corrections, and transportation. This chapter presents our economic and demographic projections for calendar years 2008 through 2014, which will affect California’s budgetary condition during the period 2008–09 through 2013–14.
The Economic Outlook
At the time of this writing, the economies of both the U.S. and much of the rest of the world were deteriorating and in an increasingly fragile state. Our forecast reflects the current consensus view that both the national and state economies will experience very subdued performance throughout the rest of 2008 and during most of 2009, with some modest recovery in 2010 and further strengthening in 2011. It is important to stress, however, that the outlook is clouded with considerable uncertainty.
Figure 1 summarizes our revised forecasts for key economic variables for both the nation and California. In the subsequent sections of this chapter, we discuss our forecasts in more detail, including the major factors and assumptions underlying our outlook.
Figure 1
The LAO’s Economic Forecast |
(November 2008) |
|
|
|
Forecast |
|
Actual
2007 |
Estimated
2008 |
2009 |
2010 |
2011 |
2012 |
2013 |
2014 |
United States |
|
|
|
|
|
|
|
|
Percent change in |
|
|
|
|
|
|
|
|
Real gross domestic product |
2.0 |
1.3 |
-1.0 |
1.5 |
2.8 |
3.2 |
2.7 |
2.9 |
Personal income |
6.1 |
4.2 |
2.0 |
2.5 |
4.6 |
5.6 |
5.5 |
5.4 |
Wage and salary jobs |
1.1 |
-0.2 |
-1.7 |
0.3 |
1.4 |
1.8 |
1.5 |
1.3 |
Consumer Price Index |
2.9 |
4.0 |
1.1 |
2.0 |
2.3 |
2.4 |
2.4 |
2.0 |
Unemployment rate (%) |
4.6 |
5.7 |
7.6 |
7.9 |
7.7 |
7.0 |
6.4 |
5.8 |
Housing starts (000) |
1,341 |
935 |
724 |
1,061 |
1,409 |
1,649 |
1,713 |
1,751 |
California |
|
|
|
|
|
|
|
|
Percent change in |
|
|
|
|
|
|
|
|
Personal income |
6.3 |
3.9 |
2.1 |
2.6 |
4.6 |
5.8 |
5.6 |
5.5 |
Wage and salary jobs |
0.8 |
-0.5 |
-1.3 |
-0.3 |
1.1 |
1.7 |
2.0 |
2.1 |
Taxable sales |
|
|
|
|
|
|
|
|
Consumer Price Index |
3.3 |
4.0 |
2.0 |
2.3 |
2.5 |
2.6 |
2.7 |
2.7 |
Unemployment rate (%) |
5.4 |
7.2 |
8.8 |
9.3 |
8.0 |
7.2 |
6.5 |
5.9 |
Housing permits (000) |
113 |
70 |
74 |
85 |
100 |
115 |
130 |
140 |
The U.S. Economy
Recent Developments
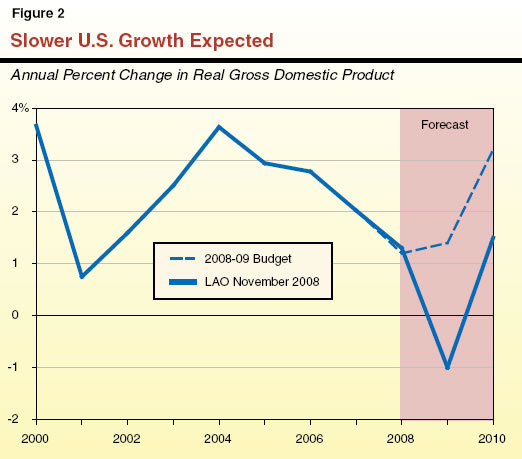
Economy Has Deteriorated Dramatically. Figure 2 (see page 9) shows that, since 2004, the nation’s economy has been slowing. The pace of real gross domestic product (GDP) growth drifted down from 3.6 percent in 2004, to 2.9 percent in 2005 and 2.8 percent in 2006. In 2007, growth slowed even more, dropping to only 2 percent. Although the first half of 2008 was temporarily buoyed by the federal tax rebates provided to individuals, growth during that period still averaged only 1.8 percent. Then, as the third quarter of 2008 was ending and the fourth quarter was beginning, reports in a variety of areas indicated that the national economy was contracting sharply. This negative situation was exacerbated by the subsequent crisis and turmoil that emerged in October associated with the country’s financial and credit markets. Confirmation of the slowing came in late October when the U.S. Department of Commerce issued a preliminary estimate that the third–quarter real GDP had declined at an annualized rate of –0.3 percent.
Weakness Exists in Many Areas. Although we projected a year ago that the economy would be slowing, we also noted it had been giving off mixed signals, and that there were a number of areas of positive performance that made forecasting difficult. This year, however, evidence of problems is visible throughout the economy, including in retail sales and other consumer spending, durable goods orders, consumer confidence, industrial production, employment levels, the unemployment rate, housing activity, nonresidential construction, export activities, and the condition of federal, state, and local government budgets. In addition, the finance and credit markets continue to be mired in confusion and instability following the near collapse of the subprime and broader mortgage–related investment markets. To what extent the recently adopted federal bailout legislation will resolve the situation remains to be seen. It is true that a positive development has emerged as the rate of inflation has fallen, in part reflecting dramatically lower crude oil and gasoline prices. However, this positive development is primarily due to the soft economy, including weak demand for goods and services and reduced production activity.
Examples of recent evidence of the serious nature of the problems facing the national economy are that:
- In the third quarter, consumption expenditures fell at an annual rate of 3.1 percent, the first quarterly decline in more than 15 years.
- Payroll employment has declined every month during 2008, and is down for the year by 1.2 million jobs. In just the past two months, it fell by over 500,000.
- The country’s unemployment rate reached 6.5 percent in October. This compared to only about 4.7 percent one year ago and is now at a 14–year high.
- Industrial production is down 1.5 percent from last year at this time, and factory orders declined by 2.5 percent in September following a 4.3 percent drop in August.
- The Conference Board’s Consumer Confidence Index plunged in October to its lowest level since its creation in 1967.
- New car sales totaled an annual rate of just 10.5 million units in October. This is down over 35 percent from the average over the past three years of 16.5 million, and the worst performance in many years.
- The housing market continues to be in disarray, characterized by soft sales levels, reduced construction activity, price declines, and foreclosure and financing problems.
Given all of the above factors, we believe there is little doubt that we are in for a period of very poor economic performance. The key question is: How bad will it be and how long will it last?
The Forecast—Subdued Growth in 2009 With Modest Recovery in 2010
We project economic activity will be very weak in the near term, with real GDP growth being negative in the fourth quarter of 2008 and early part of 2009. As shown in Figures 1 and 2, we expect real GDP will grow by a modest 1.3 percent for 2008 as a whole, and then decline by –1 percent in 2009, before drifting back up to 1.5 percent growth in 2010. For the rest of the forecast period, we project it to average almost 3 percent. Figure 2 also shows that our projected growth rate is below that assumed in the 2008–09 Budget Act. At the time of this writing, there was much speculation and debate going on about the outlook, and a number of forecasters were in the process of making further downward revisions to their projections based on certain recent data releases. Should they prove to be correct, our forecast may prove to be optimistic.
The main components of our forecast are as follows:
- Real consumer spending growth will drop sharply from 2.8 percent in 2007, to only 0.4 percent in 2008 and 0.2 percent in 2009, before rising back to 1.6 percent in 2010 and averaging 2.6 percent for the remainder of the forecast period.
- New vehicle sales will be weak, reflecting both subdued income and job growth, as well as tight financial markets and high gasoline prices. We forecast that unit sales of new light vehicles (automobiles and light trucks) will be down several million units annually (about 20 percent) through 2010.
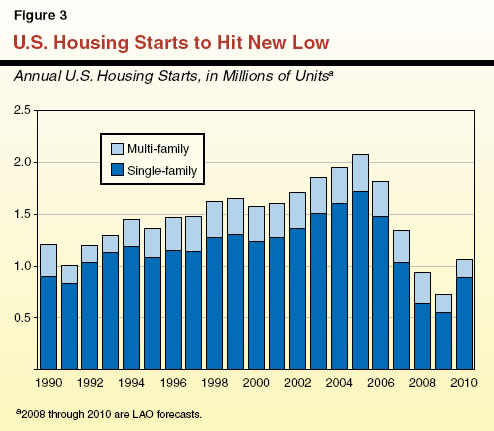
- Residential construction spending adjusted for inflation is forecast to decline by over 20 percent in 2008 and more than 15 percent in 2009, following an 18 percent drop in 2007. The greatest decline over the forecast period will be associated with the single–family portion of the market.
- Housing starts themselves (the physical–unit counterpart of residential construction spending) will be weak for several years, especially the single–family component, reflecting the well publicized problems in the housing market. As shown in Figure 3, they are predicted to drop from the already–depressed level of 1.3 million units in 2007 to only 0.9 million units in 2008 and 0.7 million units in 2009. Starts have never been this low in the last 50 years, and these levels compare to an average of 2 million units from 2004 through 2006. Starts are then predicted to experience a slow, though steady, recovery and end the forecast period at 1.8 million units.
- Nonresidential construction also is expected to be weak, although not as much as residential construction.
- Business fixed investment is forecast to decline modestly in 2009 with a further slight drop in 2010, and then start rebounding thereafter. This reflects such factors as soft corporate profits and tight financing conditions. The portion of spending on equipment and software is expected to perform better than that for structures—a plus for California, which has a large number of firms and workers which design and produce computer and software products.
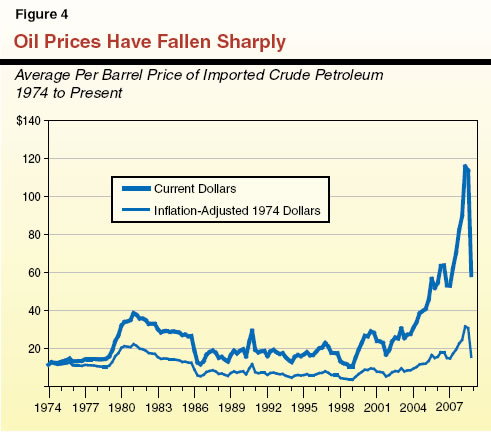
- Oil prices have sharply fallen in recent weeks following their dramatic rise over the past few years. As shown in Figure 4, oil prices, adjusted for inflation, surpassed their all–time high earlier in 2008 that was reached more than 25 years ago. We do not foresee oil prices returning to their record highs in the foreseeable future. However, neither do we see them returning to their low levels of the 1990s and early 2000s. Our forecast assumes that they will be in the $60 per barrel range during the next couple of years, and then drift up and average around $80 per barrel for the rest of the forecast period.
- Inflation has been recently described by some as “yesterday’s problem.” Inflationary pressures were of growing concern during much of 2008, due to such factors as rapidly rising crude oil and other energy and commodity prices, including food. For example, in the third quarter, the U.S. Consumer Price Index (CPI) rose at an annualized rate of 6.7 percent, and the average rate for the first three quarters combined was 5.4 percent. In the fourth quarter, however, due to such factors as falling oil and gasoline prices and the general slowing of the overall economy itself, inflationary pressures dropped dramatically. As a result, we forecast that CPI inflation will be 4 percent for 2008 as a whole, and then drop to only 1.1 percent in 2009 and 2 percent in 2010, and remain below 2.5 percent during the remainder of the forecast period. Some economists, however, are thinking that inflation in the next couple of years may turn out to be even lower than our forecast, due to the weak economy.
- Interest rates should remain low in the near term and then drift up somewhat once the economy starts to recover and gain momentum. For example, we project that three–month Treasury bill rates will decline from an average of well over 4 percent in both 2006 and 2007, to well under 2 percent in 2008 and 2009, before trending up a bit in 2010 and then averaging somewhat over 4 percent over the rest of our forecast interval.
The California Economy
The current economic situation and outlook for California in the near term are generally similar to the nation as a whole—sharply reduced levels of activity and subdued performance in most sectors. However, because the turmoil in the housing and mortgage markets has been more pronounced for the state than nationally, its outlook is likewise a bit more negative than for the country as a whole.
Recent Evidence of Slowing
Evidence that the state’s economy has slowed in recent months is visible in a variety of areas. For example:
- California’s unemployment rate has risen sharply to 7.7 percent in September. This compares to just 5.6 percent one year ago. During this period, the number of unemployed is up almost 400,000.
- Wage and salary employment declined in September for the eighth month in the last nine. These job losses have been spread across a number of different sectors, including retail trade, finance, manufacturing, construction, and business and professional services.
- Residential building permits were down in September by nearly 40 percent from September of 2007.
- Taxable sales have been weakening steadily as evidenced from the shortfalls experienced in past months in sales and use tax receipts.
Of particular concern has been the epidemic of foreclosures and major job and income losses associated with the housing–related and financial services industries. These are of course primarily related to the “popping” of the speculative bubbles associated with the highly leveraged housing and financial credit markets. Because California had a disproportionate share of its jobs and related economic activities associated with these sectors, it has been especially hard hit by the dislocations and economic losses they have generated. Furthermore, most economists believe that more painful adjustments are in store before they have run their full course. For example, although the number of interest rate “resets” associated with subprime housing loans peaked in December of 2007, many more of such subprime resets are yet to come. And, the peaking of the interest rate resets associated with the total of adjustable rate housing loans (many of which also will cause serious financial problems for homeowners) is not scheduled to occur until mid–2010. Such factors can be expected to exert a continuing drag on California’s economic performance for some time.
Specifics of the Forecast
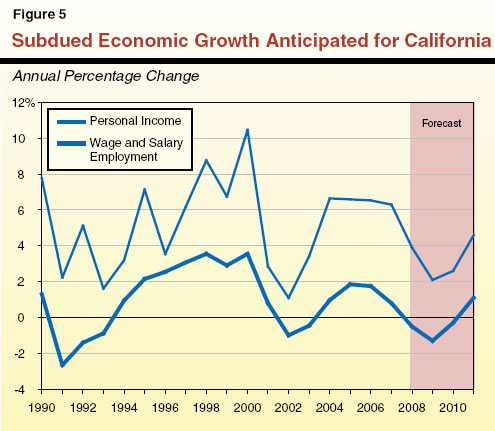
As shown in Figures 1 and 5, our outlook for California includes the following forecasts for selected specific economic variables:
- Personal income growth is predicted to slow, from 6.3 percent in 2007 to 3.9 percent in 2008 and 2.1 percent in 2009. We see it then partially rebounding to 2.6 percent in 2010 and averaging 5.4 percent during the rest of the forecast period.
- Wage and salary job growth is predicted to be very weak, slowing from only 0.8 percent in 2007 to declines of 0.5 percent in 2009, 1.3 percent in 2009, and 0.3 percent in 2010. Thereafter, it firms up a bit and then averages growth of a bit under 2 percent annually.
- New residential building permits are expected to be very depressed, averaging only a little over 70,000 in 2008 and 2009, rising to only 85,000 in 2010, and thereafter trending up slowly to end the forecast period at 140,000 in 2014. This compares to over 200,000 permits annually in both 2004 and 2005.
- The unemployment rate, which was as low as 4.9 percent as recently as 2006, is expected to average in the vicinity of 9 percent in both 2009 and 2010, and may even rise above that.
How Will Individual Sectors Perform? Performance by industry will vary but weakness will be widespread in 2008 and 2009. The softest areas will clearly involve real estate–related industries such as residential construction and finance. In contrast, certain subsectors of the professional and business services sector will likely experience fairly good growth, such as the high–technology areas involving computer systems design and scientific research and development activities. On balance, however, California’s overall job market is expected to be quite weak during the next couple of years.
Risks to the Outlook
Although our forecasts for the nation and California are what we believe to be the most likely outcomes at this time, there are inherent risks and uncertainties associated with them. Although this is true for any forecast, it is especially the case in the current economic climate. In particular, many of the currently unresolved major issues characterizing the housing and credit markets have never been experienced before, which makes predicting economic performance over the next few years particularly difficult. In addition, at the time this forecast was being prepared, an ongoing flow of negative economic reports had been occurring. Thus, the risks to the forecast on the downside are especially unsettling. For example, if it turns out that the bailout steps recently undertaken at the federal level prove unable to stabilize the financial markets and unlock the free flow of credit and liquidity to worthy borrowers, both domestically and overseas, both consumer spending and business investment would be further impaired. This, in turn, would result in large numbers of additional job losses and other types of economic disruptions.
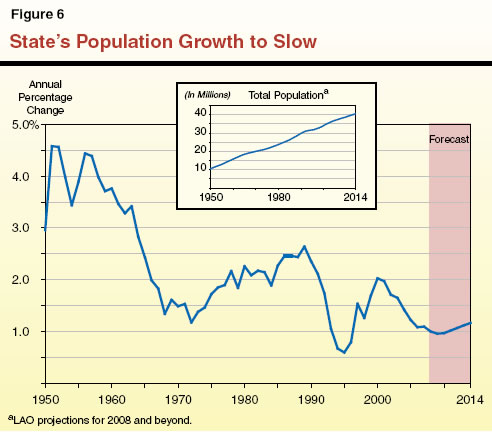
The Demographic Outlook
California’s population now totals over 38 million persons. During the six–year forecast period covered in this report, Figure 6 shows that the state’s population growth is projected to average about 1 percent annually. In terms of numbers of people, this modest annual growth rate translates into about 410,000 new people yearly, or roughly equivalent to adding a city the size of Oakland to California each year. As a result, California will add about 2.5 million people over the forecast interval and reach over 40.5 million people by 2014.
The population growth rate we are projecting is well below that of the late 1990s and early 2000s when it averaged about 1.6 percent annually, and represents a further slowing from the past several years. As discussed below, this slowing is primarily attributable to reduced net in–migration.
Population Growth Components
California’s population growth can be broken down into two major components—natural increase (the excess of births over deaths) and net in–migration (persons moving into California from other states and countries, minus those leaving California for out–of–state destinations). Over the past several decades, these two components have on average tended to contribute about equally to California’s population growth. However, their relative shares can vary significantly from one year to the next depending largely on the strength of the net in–migration component—by far the most volatile element. For example, over the past several years, the natural increase component has accounted for close to 70 percent of the total, as net population inflows from other states have declined and changed into net outflows.
Natural Increase. We project that the natural increase component will average about 320,000 new Californians annually over the forecast period. This net natural gain reflects an average of 565,000 births annually partially offset by nearly 245,000 deaths annually.
Our forecast incorporates the well–documented trend of declining birth rates that has been in effect for essentially all ethnic groups in recent years in California. Despite these declining birth rates, however, the number of new births in our forecast actually is a bit higher by the end of the period than at the start. This is due to significant growth in the female population of child–bearing age groups in the faster–growing segments of the population, including Hispanic and Asian women. These increased births are about offset by increases in the number of deaths. As a result, we project that the natural increase component will be fairly stable over the forecast period.
Net In–Migration. We project that combined domestic and foreign net in–migration will average roughly 90,000 over the forecast period, continuing for a few years its recent slide before turning up and ending the period somewhat above its initial level. This average net in–migration is only about one third of what it was during the latter half of the 1990s and early 2000s, when it averaged about 260,000 annually. It also is less a third of the projected natural increase component noted above. Regarding this in–migration:
- Most of the net in–migration we are projecting reflects foreign net in–migration from other nations. This component averaged around one–quarter million persons annually in the early 2000s. However, due to the state’s economic slowing and various factors relating to immigration policies, it has since declined and is currently running at about 200,000 persons annually. Our forecast assumes that foreign net in–migration will continue at about this same pace throughout the forecast period.
- Regarding domestic net in–migration, this is the single most difficult demographic variable to forecast for California at this time. This is largely because it is highly sensitive to the condition of the economy, including job growth and the unemployment rate. The available data indicate that this component fell from a net inflow of over 100,000 in 2001 to being barely positive in 2004. Thereafter, it became increasingly negative (meaning that more persons were leaving California for other states than coming into California from them) starting in 2005, with net domestic out–migration currently running at well over 100,000 annually. Due to our economic problems, our forecast is for net domestic out–migration to continue and rise somewhat in the near term, peaking at 150,000. Although we do expect these net domestic outflows to taper off and eventually reverse themselves, we do not foresee a return to net inflows for some years.
Growth to Vary Significantly by Age Group
Figure 7 shows our population growth projections by broad age categories, including both numerical and percentage growth.
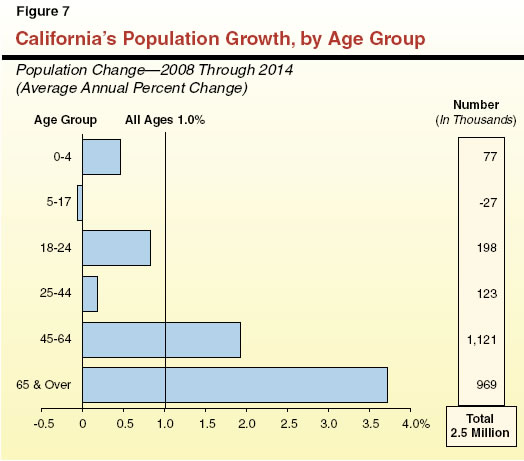
“Baby Boomers” Swelling 45–to–64 Age Group. The 45–to–64 age group (largely the baby boomers) continues to be by far the fastest growing segment of the population numerically and the second fastest percentage wise. Over 1.1 million new people are expected to move into this age category over the next six years for an annual average growth of 1.9 percent.
Little Growth for Young People. At the other extreme, slow annual growth—less than one–half percent combined—is anticipated for preschoolers and the K–12 school–age population. As shown in Figure 7, only 50,000 new children are predicted to be in these groups, with the school–age group experiencing a slight decline. This reflects several factors. One is the movement of children of the “baby boom” generation beyond the upper end of the 5–17 age group, which also explains the above–average growth in the 18–to–24 age category. Other factors include the slower rate of net in–migration, and the decline in birth rates in recent years that has reduced the number of children moving into the preschool and school–age categories.
Rapid Growth for the Elderly. The single fastest–growing age group percentage wise and second–fastest numerically is the 65–and–over category, reflecting the well–known “graying” of the population. This cohort is expected to increase at an average annual pace of 3.7 percent and grow by nearly one million people.
Fiscal Effects. These various age–group demographic projections can have significant implications for the state’s revenue and expenditure outlook. For example, strong growth of the 45–to–64 age group generally benefits tax revenues, since this is the age category that routinely earns the highest wages and salaries. Likewise, the growth in the young–adult population affects college enrollments, that for the 5–to–17 age group drives K–12 enrollment growth, and that for the elderly impacts medical care caseloads and costs.
Other Demographic Features
In addition to age, projected population growth will also differ markedly along other dimensions. For example:
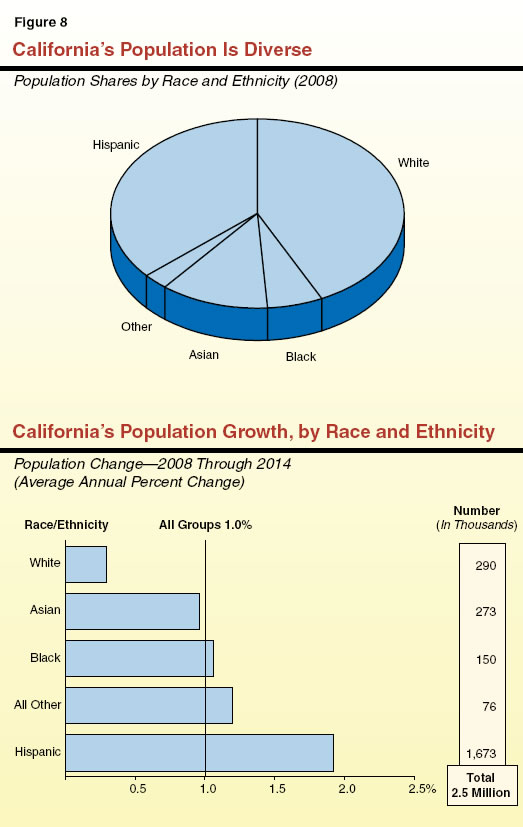
Racial/Ethnic Variation. Figure 8 indicates that California’s population is very diverse in terms of its racial/ethnic composition. In addition, the amounts and rates of population growth along these dimensions will differ significantly for different groups. The Hispanic population is forecast to experience especially strong growth, averaging over 1.9 percent annually and accounting for more than two–thirds of California’s total population growth between 2008 and 2014.
Geographic Variation. Rates of growth will be above average for the state’s Central Valley, Inland Empire, and foothills areas. This will occur as the availability of land in these areas allows population to continue to “fill in” and attract people from the more congested coastal areas within the state. Such higher–growth regions will increasingly face new challenges in providing the public services and infrastructure needed to accommodate growth.
Chapter 3
Revenue Projections
Revenues that finance California’s state General Fund budget come from numerous sources, including taxes, fees, licenses, interest earnings, loans, and transfers. Almost 95 percent of the total, however, derives from the state’s “big three” taxes—the personal income tax (PIT), the sales and use tax (SUT), and the corporate income and franchise tax (CT). In this chapter, we summarize our updated General Fund revenue projections and provide detail behind our key revenue–related assumptions.
Overall Outlook Is Bleak
The economic events of the past two months make it clear that the revenue assumptions underlying the 2008–09 Budget Act were too optimistic. September revenue data, for example, revealed a major shortfall in estimated payments for PIT (10 percent) and CT (22 percent). The weakness in estimated payments, along with a $200 million shortfall in September SUT receipts, meant revenues in the month for the big three taxes fell almost $1 billion short of budget estimates.
September’s revenue data, however, fail to reflect the extent of the revenue shortfall that now appears likely. The credit crisis, and the major decline in stock prices in October that followed, will likely further erode the state’s revenue base. Capital gains from stocks and housing have played a major role in revenue growth in recent years. Given California real estate markets and the rapid decline in national stock prices, capital gains income also will fall significantly. Lower asset prices on housing and stocks also represent a major decline in household wealth, which causes consumers to scale back spending plans. The roughly 20 percent fall in automobile sales in the state in the first nine months of 2008 is evidence of the restrained approach to spending by Californians. In turn, falling sales and profits will reduce SUT and CT revenues. Given the above, it is not surprising that October’s revenue collections from the big three taxes were down another $360 million.
Furthermore, as discussed in the previous chapter, the economic outlook going forward is more uncertain than usual. While our economic growth projections are within the range of estimates discussed by most economists, some fear a much more significant downturn. This relates in part to the fact that the credit crises we are in the middle of is still unresolved, and its eventual adverse effects on the economy are unclear. This possibility of a deeper downturn, therefore, suggests there is a larger–than–usual “downside risk” to our revenue forecast, where even larger shortfalls in tax collections could be experienced. While our forecast does not reflect this gloomy scenario, its possibility should be kept in mind.
Slowdown Results in Major Revenue Reduction
Since the national and state economies are slowing appreciably, we have significantly reduced our projected revenues relative to the 2008–09 Budget Act forecast. Figure 1 shows our updated revenue estimates for 2007–08 and 2008–09. Figure 2 shows our current revenue projections for the entire five–year forecast period, ending in 2013–14.
Figure 1
Revised LAO Revenues for 2007-08 and 2008-09
Compared With 2008-09 Budget Act |
(In Millions) |
|
|
2007-08 |
|
|
|
2008-09 |
|
Revenue Source |
Budget Act |
LAO |
Difference |
|
Budget Act |
LAO |
Difference |
Personal Income Tax |
$54,380 |
$54,289 |
-$91 |
|
$55,720 |
$50,265 |
-$5,455 |
Sales and Use Tax |
26,813 |
26,613 |
-200 |
|
27,111 |
25,381 |
-1,730 |
Corporation Tax |
11,926 |
11,994 |
68 |
|
13,073 |
12,023 |
-1,050 |
Other revenues and transfers |
9,908 |
9,753 |
-155 |
|
6,087 |
5,580 |
-507 |
Totals |
$103,027 |
$102,649 |
-$378 |
|
$101,991 |
$93,248 |
-$8,742 |
Figure 2
The LAO General Fund Revenue Forecast |
(Dollars in Millions) |
Revenue Source |
2007-08 |
2008-09 |
2009-10 |
2010-11 |
2011-12 |
2012-13 |
2013-14 |
Personal Income Tax |
$54,289 |
$50,265 |
$46,339 |
$47,958 |
$50,064 |
$53,066 |
$56,071 |
Sales and Use Tax |
26,613 |
25,381 |
26,100 |
27,540 |
29,320 |
31,205 |
32,965 |
Corporation Tax |
11,994 |
12,023 |
9,102 |
8,472 |
9,140 |
9,757 |
10,230 |
Other revenues and transfers |
9,753 |
5,580 |
4,794 |
5,723 |
6,868 |
7,234 |
7,567 |
Total Revenues and Transfers |
$102,649 |
$93,248 |
$86,335 |
$89,693 |
$95,392 |
$101,262 |
$106,833 |
Percentage Change |
7.1% |
-9.2% |
-7.4% |
3.9% |
6.4% |
6.2% |
5.5% |
2007–08 Revenues—Down $378 Million. Based on preliminary data from the State Controller and the state’s tax agencies for 2007–08, we estimate that General Fund revenues and transfers totaled $102.6 billion, or $378 million (0.4 percent) below the level assumed in the 2008–09 Budget Act. As Figure 1 displays, most of this decline can be attributed to PIT (–$91 million) and SUT (–$200 million), with a small net decrease ($87 million) in the state’s other revenue sources.
2008–09 Revenues—Down $8.7 Billion. The impact of the slowdown in the economy becomes very evident in the current year. We project an $8.7 billion (8.6 percent) decline in General Fund revenues and transfers from the $102 billion level assumed in the 2008–09 Budget Act. As Figure 1 shows, the big three taxes account for almost all of the decline. The PIT revenues are projected to fall $5.5 billion (9.8 percent), primarily due to an expected large drop in capital gains income earned by California residents in 2008. Our forecast also shows sales tax revenues continuing to decline in 2008–09 (rather than increasing modestly, as forecast in May). This results in a $1.7 billion loss (6.4 percent) in SUT revenues. The CT revenues also fall by $1.1 billion, or 8 percent.
2009–10 Revenues—Continued Decline. Our forecast shows a continued decline in General Fund resources in 2009–10. Specifically, our projections show revenues falling by $6.9 billion, or 7.4 percent, from 2008–09 levels. While the economy improves slowly in 2009–10 (the budget year), PIT and CT revenues drop modestly. Only about $1.3 billion of this reduction, however, stems from underlying declines in revenues from the big three taxes. The largest factor in the fall–off stems from the one–time nature of many of the 2008–09 revenue solutions that were adopted as part of the 2008–09 Budget Act. Our forecast includes a $4.8 billion reduction in General Fund revenues in 2009–10 as a consequence of these tax provisions.
2010–11 Through 2013–14—Slow Growth. We project that revenues will increase modestly throughout the remainder of our forecast period. Figure 3 illustrates our projection of General Fund revenues over these years:
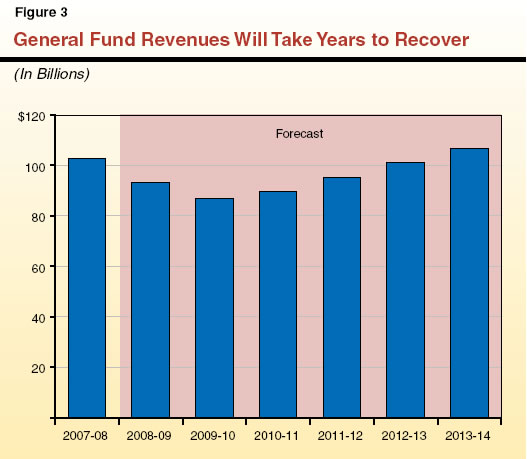
- Fiscal year 2010–11 shows modest growth in revenues compared to the previous year—about 3.9 percent.
- After that, growth accelerates to a modest annual average of 6 percent over the next three years.
- However, because of the sharp revenue decline in 2008–09 and 2009–10 and the relatively slow pace of economic recovery beginning in 2010–11, it takes until 2013–14 to surpass the level of total General Fund revenues the state received in 2007–08.
Revenues over the forecast period also are affected significantly by federal tax policies. Please see the box on the next page for a discussion of these impacts.
Federal Tax Policies Affect Forecast
Our estimates include General Fund revenues that the state would receive because of the expiration of federal tax provisions during the forecast period. Under existing federal law, reductions in personal income taxes and estate taxes that were enacted in the early 2000s sunset in 2011. Expiration of these provisions would indirectly increase state revenues. Because our forecast is based on the assumption that existing law determines the level of revenues and expenditures in future years, our revenue estimates are affected by these sunsetting provisions.
Accelerating Capital Gains. We project that the expiration of lower federal tax rates on capital gains will result in taxpayers accelerating capital gains realizations to take account of the lower rates before they disappear. In 2011, capital gains tax rates are slated to increase to 21 percent, up from 15 percent. While this increase has no direct effect on state tax rates or revenues, the advent of a higher tax on capital gains income likely will induce some taxpayers to sell assets earlier than they would otherwise (in order to take advantage of the lower rates still in effect in 2010). Recognizing this possibility, our forecast shifts $660 million in state capital gains revenues into 2010 from 2011. On net, however, we do not expect any significant change in state revenues for both years combined from this change.
Reestablishing the Estate Tax and State Exemption. A 2002 federal law phases out federal estate taxes so that, by 2010, the federal estate tax is eliminated entirely. In 2011, however, this provision sunsets, and federal estate tax rates revert back to the policies in place in 2001. As a result, tax rates will return to their 2001 levels, exemptions on the size of estates that are subject to the tax will decline significantly from those in place in 2010, and the state “pickup” tax exemption will be restored. This pickup tax provision involved a federal credit that had the effect of reducing federal estate taxes by the amount of state estate taxes levied on each estate, up to a certain level. As a result, many states—including California—set their state tax levels at the maximum exemption level allowed under federal law. Our forecast includes $750 million in 2010–11 to reflect a half–year effect of the state pickup feature in federal estate tax law. Beginning in 2011–12, our forecast includes about $1.7 billion annually due to this provision. |
Downside Risk to Forecast Is Considerable. As noted above, the economic outlook at the current time is more uncertain than usual, and the possibility of a deeper and longer downturn represents a further threat to revenues. For illustrative purposes, we investigated the impact on General Fund revenues of an alternative economic scenario that assumes about one–half the growth in personal income in 2009 (1.1 percent) and 2010 (1.4 percent) compared to our most likely baseline forecast (2.1 percent and 2.6 percent respectively).
The impact on revenues of this somewhat deeper downturn is significant. General Fund revenues would be about a cumulative $4.5 billion lower over two years combined than in our baseline forecast. Specifically, our forecast would reduce revenues by about $1 billion in the current year and $3.5 billion in the budget year. Beginning in 2010–11, General Fund revenues would be more than $4 billion lower than our baseline forecast. Thus, the risks as represented by our alternative economic scenario would increase significantly both the magnitude and the duration of the budget challenge facing the state.
Detail on Individual Revenue Sources
Personal Income Tax
We estimate revenue from the PIT will drop from $54.3 billion in 2007–08 to $50.3 billion in 2008–09. This current–year estimate is down $5.5 billion from the level assumed in the 2008–09 Budget Act. In 2009–10, PIT revenues drop another $4 billion, to $46.3 billion. Beginning in 2010–11, PIT revenues start growing again. In the final two years of our forecast, income tax revenues are growing at about 6 percent annually.
Key Forecast Factors. Similar to the 2001–02 downturn, the main cause of the drop in PIT revenue is a decline in capital gains income and other variable income such as bonuses and stock options. Our forecast also shows income from other categories (wages and salaries, dividends, interest, rent, taxable pensions, and business income) remaining relatively stable or showing modest growth. Thus, the projected decline in PIT revenue stems almost entirely from capital gains and other variable income.
As Figure 4 shows, capital gains have varied between 2.5 percent and 11 percent of state personal income over the past 20 years. From 1991 through 1995, their ratio held fairly steady at between 2.5 percent and 3 percent. Conditions in that period, where the state was going through a slow recovery in the aftermath of a real estate bust and stock markets were weak, are somewhat similar to what we expect to see over the next few years.
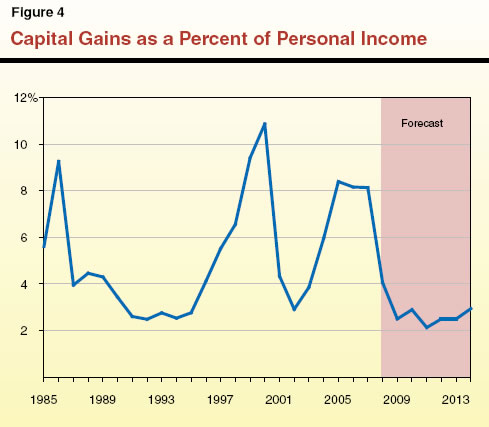
With the recent collapses in real estate values and stock values, we project capital gains will decline from an estimated $125 billion in tax year 2007 to $65 billion in 2008 and $41 billion in 2009. Capital gains overwhelmingly go to taxpayers who pay the top PIT marginal rate of 9.3 percent. As a result, the declines projected in capital gains income earned in 2008 and 2009 have a very large impact on state revenues. Specifically:
- In 2008–09, we forecast PIT revenues totaling $50.3 billion. As Figure 4 shows, we expect capital gains to fall from about 8 percent of personal income in 2007 to 4 percent in 2008, due primarily to the decline in stock and housing prices.
- In 2009–10, we project $46.3 billion in PIT revenues. The $4 billion reduction from 2008–09 is caused in part by a forecasted drop in capital gains to 2.5 percent of state personal income. The overall PIT decline is also due to $2.2 billion in one–time revenue accelerations that were part of the 2008–09 Budget Act.
In subsequent years, PIT revenues grow at a relatively slow pace compared to previous periods of economic recovery. Unlike the sharp increases the state experienced in the mid–2000s, our forecast shows capital gains growing only at the rate of personal income. The slight uptick in 2010 is a result of the expected increase in the federal tax rate on capital gains, as the lower rates currently in effect expire (see discussion above). This should cause some gains to be realized in 2010 that otherwise would have been recorded in 2011.
Sales and Use Tax
We estimate that SUT receipts totaled $26.6 billion in 2007–08, a decline of 3 percent, or $200 million, from the level assumed in the 2008–09 Budget Act estimate. In 2008–09, we expect the decline to continue, with receipts totaling $25.4 billion, a 4.8 percent ($1.3 billion) decrease from 2007–08. Sales tax revenues recover somewhat in 2009–10, growing 2.8 percent. For the remainder of the forecast period, SUT revenues are expected to increase at an average annual rate of about 6 percent.
Key Forecast Factors. The main determinant of SUT receipts is taxable sales. The SUT is levied on purchases of tangible personal property; services are basically exempt. About two–thirds of taxable sales are related to retail spending by consumers, including a significant portion on light vehicles and trucks. The remaining one–third is related to building materials that go into new construction and to business–to–business transactions that are taxed because the purchaser is the item’s final consumer.
Regarding our taxable sales forecast:
- In 2008, we estimate that taxable sales will show a 3.5 percent decline, as the downturn that started in the real estate market has now spread throughout the economy. Taxable sales growth on a year–over–year basis turned negative in mid–2007 and has declined for four consecutive quarters. (This means the dollar amount of taxable items sold is actually less than in the same quarter of the prior year.) The main reason is that real estate troubles mean less money spent on building supplies and home furnishings. Consumers are also facing uncertainties in employment and significant loss in net worth due to the plunge in home prices and the stock market. Consumers’ hesitance to spend, particularly on big–ticket items such as vehicles, is negatively influencing taxable sales.
- We expect taxable sales to continue to decrease through the first half of 2009 before slightly recovering in the second half of the year. On an annual basis, this will result in about a 0.4 percent decrease from 2008 taxable sales.
- In 2010, we expect a modest recovery to 3.9 percent growth, bringing taxable sales levels back to that of about 2007. Then, beginning in 2011, we see a return to steady growth averaging just under 6 percent growth annually.
Transportation–Related Transfers. A second factor affecting the strength of General Fund SUT receipts is the transfer of specified sales taxes on gasoline and diesel fuel to the Public Transportation Account (PTA). These transfers amounted to $1.2 billion in 2007–08. Thereafter:
- In 2008–09, we project them to rise to $1.7 billion, largely due to the unprecedented gasoline price run–up experienced in the first half of 2008. Because gasoline prices have fallen so quickly since July, however, the transfer to the PTA, while up from 2007–08, is down by about $265 million from the level assumed for the current year in the 2008–09 Budget Act.
- In 2009–10, we project these transfers will total $1.4 billion.
- After that, we expect this transfer to grow at about 7 percent per year for the remainder of the forecast period.
It should be stressed, however, that the size of this transfer in future years is subject to considerable uncertainty, given that it is highly influenced by the price of gasoline, which recently has been highly volatile and difficult to accurately predict.
Corporate Income Taxes
Corporate income tax revenue is projected to hold at $12 billion from 2007–08 to 2008–09. Compared to the 2008–09 Budget Act, however, our estimate for the current year translates into a $1.1 billion decline in revenues. In 2009–10, receipts from corporate taxes are estimated to drop by almost one–quarter—to $9.1 billion. Corporate tax revenues dip again in 2010–11, bottoming out at $8.5 billion before increasing moderately in the last three years of our forecast.
Key Forecast Factors. Our forecast of revenues from corporate taxes reflects our assessment of corporate profits over the next five years. Two other factors also influence our estimates, as we discuss below.
- In 2008–09, our estimate assumes taxable profits to decline by 6 percent in tax year 2008 and stay flat in 2009. Revenues are boosted, however, by $2.9 billion in one–time revenues due to various revenue–enhancing measures adopted as part of the 2008–09 Budget Act. Without these changes, revenues in the current year would be only $9.3 billion.
- In 2009–10 and beyond, slow growth in the economy and larger corporate deductions and credits hold down CT revenue growth. Revenues in the budget year fall sharply because of the loss of the one–time increases that benefit revenues in the current year. Our forecast shows profits remaining flat in 2010, but increasing again in 2011, averaging 5.4 percent annually over the remaining years of the forecast. Revenue increases from higher profits, however, are partially offset by the higher use of deductions and credits. Our forecast, for example, assumes revenue losses of about $700 million 2009–10 and $1.7 billion in 2010–11 due to the net operating loss (NOL) deduction (see the box below for additional discussion about the role of NOLs in our forecast).
Other Revenue Sources
The remaining 5 percent of General Fund revenues includes taxes on insurance premiums, alcoholic beverages, and cigarettes, as well as fees, interest on investments, asset sales, and loans and transfers between the General Fund and special funds.
Revenues from this category are expected to drop from $5.6 billion in the current year to $4.8 billion in the budget year as one–time transfers made from special funds into the General Fund as part of the 2008–09 Budget Act end. Beginning in 2010–11, other revenues begin increasing rapidly. The driving force behind the increases is the re–institution of the state estate “pickup” tax. As discussed earlier (please see the box on page 20), current federal estate tax law sunsets in 2011. As a result, federal law is scheduled to revert to the rules in place in 2001, which include provisions for a state pick–up of a portion of federal estate tax revenues. We estimate additional revenues of $750 million in 2010–11 (half–year) and about $1.7 billion annually thereafter due to the estate tax.
The Key Role of NOLs
Corporate credits and deductions—especially the net operating loss (NOL) deduction—have become a major forecast factor in our estimates. We estimate the combined effects of the economic slowdown and changes in state policy will result in revenue losses from the NOL deduction in the later years of our forecast that will be much larger than in the past. This deduction allows corporations to offset current profits with past losses in order to “smooth” their stream of income over time. This deduction was suspended in 2008 and 2009 but enhanced for later years as part of the 2008–09 budget package.
We project the stock of unused NOLs for tax years 2010 and beyond will rise to unprecedented levels. In part, this increase stems from the fact that firms will be unable to use past losses to offset current profits in 2008 and 2009. In addition, companies will accumulate large new losses associated with the recession, and the recent budget agreement extended the length of time losses may be carried over.
The figure illustrates the growth in the amount of NOLs that we project over the forecast period. As the figure shows, losses increased throughout the 2000s, reaching about $260 billion in 2006. However, because of the moratorium on using NOLs to reduce tax liabilities and because of the economic slowdown, we estimate the stock of unused NOLs will exceed $500 billion by 2010. By the end of the forecast period, our projections show firms holding more than $800 billion in unused NOLs that can be used to reduce corporate tax revenues in later years.
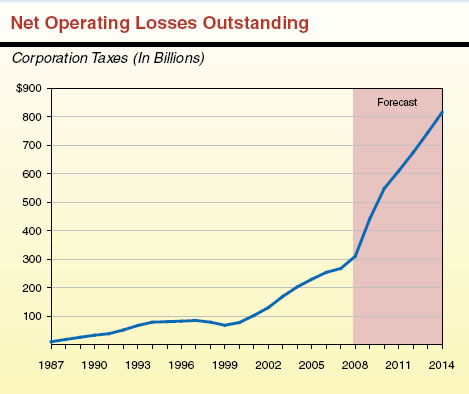
Because of the different factors influencing this deduction, there is a considerable potential for estimating error in our projections of available NOLs. It is also uncertain how much use firms will make of NOL deductions once they are able to claim them again starting in tax year 2010. Past patterns of NOL use may not be a useful indicator of future patterns, as companies with NOLs may go out of business or simply be unable to use its losses as a deduction. As a result, to be on the safe side, our forecast reduces annual NOL usage as a fraction of outstanding NOLs from its average of 5.8 percent over the 2004 through 2006 period to 4 percent in 2010 and 4.5 percent in subsequent years. |
Chapter 4
Expenditure Projections
In this chapter, we discuss our General Fund expenditure estimates for 2007–08 and 2008–09, as well as our projections for 2009–10 through 2013–14. Figure 1 shows our forecast for major General Fund spending categories. Below, we first discuss projected general budgetary trends and then discuss in more detail our expenditure projections for individual major program areas.
Figure 1
Projected General Fund Spending for Major Programs |
(Dollars in Millions) |
|
Estimated |
|
Forecast |
Average
Annual
Growth
From
2008‑09 |
|
2007‑08 |
2008‑09 |
|
2009‑10 |
2010‑11 |
2011‑12 |
2012‑13 |
2013‑14 |
Education |
|
|
|
|
|
|
|
|
|
K-14—Proposition 98 |
$41,945 |
$42,403 |
|
$38,828 |
$40,083 |
$42,439 |
$44,886 |
$47,184 |
2.2% |
Proposition 98 QEIA and
Settle-Upa |
— |
— |
|
600 |
600 |
600 |
600 |
414 |
— |
CSU |
2,909 |
2,914 |
|
2,988 |
3,058 |
3,137 |
3,232 |
3,337 |
2.7 |
UC |
3,098 |
3,075 |
|
3,118 |
3,161 |
3,222 |
3,306 |
3,406 |
2.1 |
Student Aid Commission |
843 |
838 |
|
914 |
956 |
992 |
1,016 |
1,033 |
4.3 |
Health and Social Services |
|
|
|
|
|
|
|
|
|
Medi-Cal |
14,124 |
14,576 |
|
15,318 |
16,184 |
17,196 |
18,327 |
19,592 |
6.1 |
CalWORKs |
1,550 |
2,129 |
|
2,324 |
2,405 |
2,495 |
2,590 |
2,697 |
4.8 |
SSI/SSP |
3,659 |
3,742 |
|
3,865 |
4,234 |
4,474 |
4,734 |
5,018 |
6.0 |
IHSS |
1,666 |
1,849 |
|
1,979 |
2,133 |
2,305 |
2,499 |
2,706 |
7.9 |
Developmental Services |
2,546 |
2,780 |
|
2,933 |
3,098 |
3,268 |
3,449 |
3,646 |
5.6 |
Department of Mental Health |
1,941 |
2,034 |
|
2,178 |
2,154 |
2,221 |
2,295 |
2,374 |
3.1 |
Other major programs |
3,884 |
3,946 |
|
4,055 |
4,366 |
4,563 |
4,741 |
4,899 |
4.4 |
Corrections and Rehabilitationb |
9,678 |
9,843 |
|
9,936 |
10,224 |
10,430 |
10,788 |
11,190 |
2.6 |
Judiciary |
2,236 |
2,206 |
|
2,480 |
2,512 |
2,562 |
2,690 |
2,858 |
5.3 |
Proposition 42 transfer |
1,403 |
1,355 |
|
1,350 |
1,403 |
1,489 |
1,588 |
1,688 |
4.5 |
Debt service on
infrastructure bonds |
4,264 |
4,998 |
|
5,912 |
6,886 |
7,423 |
7,663 |
8,010 |
9.9 |
Other programs/costs |
7,893 |
5,849 |
|
7,516 |
8,281 |
8,267 |
9,118 |
9,102 |
9.2 |
Totals |
$103,640 |
$104,535 |
|
$106,293 |
$111,738 |
$117,083 |
$123,524 |
$129,155 |
4.3% |
|
a Quality Education Investment Act (QEIA) payments of $300 million in 2007‑08 and $450 million in 2008‑09 have been reflected in the carry-in balance to 2007‑08 (consistent with the administration’s scoring). |
b Includes estimated costs of employee pay and benefit increases. Other compensation costs, including costs resulting from assumed increases in pension contribution rates, are listed in the "other" category. |
General Fund Budget Trends
2009–10 Outlook
We forecast that General Fund expenditures will grow from $104.5 billion in 2008–09 to $106.3 billion in 2009–10, an increase of 1.7 percent. This minimal level of growth is the net result of several offsetting factors. First, the constitutional minimum funding requirement for K–14 education is determined in large part by changes in state revenues. With our projected drop in 2009–10 revenues, required General Fund spending for K–14 education drops by $3.6 billion on a year–to–year basis under our forecast. More than offsetting this decline is the resumption of spending obligations that were reduced or suspended on a one–time basis in 2008–09, including mandate reimbursements to local governments, funding for the courts, and low–income senior citizen tax relief. Similarly, transportation funds were used to offset General Fund spending in 2008–09 at a higher level than would be the case in 2009–10 under current law. Finally, higher caseloads as a result of the state’s struggling economy will push costs higher in a number of health and social services programs.
Expenditure Growth During the Forecast Period
Moderate Total Growth Projected. The right–hand column of Figure 1 shows our projected average annual growth rates for major programs from 2008–09 through 2013–14. We forecast that total spending will increase by an average annual rate of 4.3 percent—slightly less than statewide personal income growth over the period.
Highlights for Individual Program Areas. With regard to the major individual program areas in the budget, the figure shows that:
- K–14 Proposition 98 (General Fund) spending is projected to increase at an average annual rate of 2.2 percent throughout the forecast period. Projected revenue reductions in 2009–10 drop the minimum General Fund spending requirement below its 2008–09 level until 2011–12.
- Medi–Cal is projected to grow at an average annual rate of 6.1 percent. This reflects continued increases in caseload–related costs and the utilization of medical services.
- In–Home Supportive Services (IHSS) spending is projected to increase at an average annual rate of 7.9 percent. This growth reflects increases in both caseloads and wages for IHSS workers.
- Department of Corrections and Rehabilitation spending is forecast to increase at an average annual rate of 2.6 percent over the forecast period. This growth takes into account court–ordered increases in health care costs and salary increases—partially offset by projected declines in the prison inmate population.
- Debt–service expenses for general obligation and lease–revenue bonds that fund infrastructure projects in all program areas are projected to increase at an average annual rate of 9.9 percent. This reflects the sale of $65 billion in debt over the forecast period, including about $3 billion of the $11 billion in new bonds authorized by the voters at the November 2008 statewide election.
In the sections that follow, we provide a more detailed discussion of the expenditure outlook for these and other individual major program areas.
Proposition 98— K–14 Education
State spending for K–14 education (K–12 schools and community colleges) is governed largely by Proposition 98, passed by the voters in 1988. Proposition 98 is funded from the state General Fund and local property taxes and accounts for about three–fourths of total support for K–14 education. The remainder comes from a variety of sources including non–Proposition 98 General Fund, federal funds, lottery revenue, community college fee revenues, and other local revenues.
California’s public K–12 education system consists of more than 1,000 locally governed school districts and county offices of education. These entities operate about 9,500 schools serving about 6 million K–12 students. The California Community Colleges (CCC) consists of 72 locally governed districts operating 109 colleges that serve more than 1 million full–time equivalent students (FTES).
The Proposition 98 Forecast
Figure 2 shows our projections of the Proposition 98 minimum guarantee throughout the forecast period. Our forecast projects a large decrease in the Proposition 98 funding requirement in 2009–10. We project modest growth the following year, with stronger growth in 2011–12. Nonetheless, as reflected in the figure, the Proposition 98 minimum guarantee would be only slightly higher in 2011–12 than the current Proposition 98 spending level. Over the last two years of the forecast period, we project somewhat healthier increases in the Proposition 98 minimum guarantee. (Our projections do not reflect the impact of the proposed lottery measure. In the nearby box, we discuss how the lottery measure would affect Proposition 98 funding.)
Figure 2
Proposition 98 Forecast |
(Dollars in Billions) |
|
2008‑09a |
2009‑10 |
2010‑11 |
2011‑12 |
2012‑13 |
2013‑14 |
General Fund |
$42.4 |
$38.8 |
$40.1 |
$42.4 |
$44.9 |
$47.2 |
Local property tax |
15.7 |
15.5 |
15.6 |
15.9 |
16.4 |
17.1 |
Totals |
$58.1 |
$54.3 |
$55.6 |
$58.3 |
$61.2 |
$64.3 |
Percent change |
— |
-6.4% |
2.4% |
4.8% |
5.0% |
5.0% |
|
a Reflects 2008‑09 Budget Act spending levels, with revised General Fund and property tax contributions. |
Proposed Lottery Measure Replaces Lottery Funds to Education With General Fund
As discussed in “Chapter 1” of this report, the 2008–09 budget package included a ballot measure related to operational changes and securitization of the California lottery. This proposal, intended to go before voters in the spring of 2009, states that beginning in 2009–10, K–12 schools, the California Community Colleges, the California State University (CSU), and the University of California (UC) would no longer receive any funding from the California lottery. (Currently these public education segments receive about $1.1 billion annually in lottery funds.) Instead, future lottery funds would be used to help retire state debts, and state General Fund monies would be used to help backfill the loss of lottery funds for public education.
Currently, K–12 schools and community colleges receive lottery funds in addition to Proposition 98 dollars. To backfill the loss in lottery revenues for K–12 schools and community colleges, the measure intends to increase the 2009–10 Proposition 98 funding level by about $1 billion above what it otherwise would be for that year. This higher Proposition 98 funding base would carry forward into future years. The measure would use these funds to create a new Proposition 98 set aside for allocation to schools, adjusted each year for changes in student population and per capita personal income. For CSU and UC, the measure would backfill the loss in lottery funds with an annual General Fund appropriation (totaling about $70 million in 2009–10). This appropriation also would be adjusted each year thereafter for changes in student population and per capita personal income.
For all education segments, we project funding would grow at a faster rate under the lottery proposal compared to current law. For K–14 education, the Proposition 98 funding requirement historically has tended to grow at a faster rate than lottery distributions. If this trend continues, shifting the funding stream into Proposition 98 could result in increased funding for K–14 education over the long–term, compared to schools and community colleges continuing to receive a share of lottery proceeds as under current law. |
Our forecast of the Proposition 98 guarantee depends on a variety of factors—including changes in K–12 average daily attendance, per capita personal income, and General Fund revenues. The amount of the guarantee in any given year is determined by one of three “tests” that compare certain combinations of these factors. Figure 3 shows these factors and their projected rates of change over the forecast period. The figure also shows projected changes in CCC FTES as well as the K–14 cost–of–living adjustment (COLA). (The amount of funding going to school districts also can be affected by changes in local property tax revenues. See the nearby box for an update on these tax revenues.)
Figure 3
Proposition 98 Underlying Forecast Factors |
|
2008‑09 |
2009‑10 |
2010‑11 |
2011‑12 |
2012‑13 |
2013‑14 |
Annual Percent Change |
|
|
|
|
|
|
K-12 average daily attendance |
-0.5% |
-0.5% |
-0.3% |
0.1% |
0.2% |
0.4% |
Per capita personal income |
4.3 |
3.3 |
1.3 |
1.7 |
2.5 |
4.6 |
Per capita General Fund |
-6.7 |
-7.7 |
2.9 |
5.2 |
5.0 |
4.4 |
CCC full-time equivalent students |
2.0 |
1.3 |
0.8 |
0.5 |
0.4 |
0.4 |
K-14 COLA |
5.7 |
6.0 |
1.9 |
1.6 |
1.9 |
2.2 |
Share of General Fund Revenues |
|
|
|
|
|
|
Projected |
46.9% |
46.0% |
45.7% |
45.4% |
45.3% |
45.1% |
Test 1 |
41.0 |
41.5 |
41.5 |
41.5 |
41.5 |
41.5 |
Proposition 98 "Test" |
3 |
3 |
2 |
2 |
2 |
2 |
|
Falling Local Property Tax Revenues Likely to Increase General Fund Costs for Proposition 98 By Over $1 Billion
The Governor’s special session proposal assumes the same amount of property tax revenues for K–14 education as was assumed in the 2008–09 Budget Act. However, as shown in the figure, we estimate that schools and community colleges will receive significantly less revenue from local property taxes.
Comparison of Property Tax Estimates |
(In Billions) |
|
2007-08 |
2008-09 |
2009-10 |
Governor’s proposala |
$15,023 |
$16,143 |
$16,107 |
LAO estimate |
14,631 |
15,683 |
15,520 |
Difference |
-$392 |
-$460 |
-$587 |
|
a Does not update property tax estimates. Based on 2008-09 Budget Act assumptions. |
For the prior, current, and budget years, we estimate a cumulative decline of almost $1.5 billion. Specifically, property tax data indicates schools received about $400 million less in 2007–08 than assumed at the time the 2008–09 Budget Act was adopted. This reduction likely was due to a significant decline in the number of newly constructed or recently purchased properties and an increase in property tax delinquencies. For 2008–09, we estimate revenues will be down by slightly more ($460 million) due to continuing slowdown in the real estate market. Because the administration built its property tax estimates for 2009–10 off the higher 2008–09 Budget Act assumptions, we believe its estimate for 2009–10 is also overstated (by almost $600 million). Because school property taxes largely offset the General Fund share of Proposition 98 funding, we estimate this downward adjustment in the K–14 share of property tax revenue results in nearly $1.5 billion in new General Fund costs.
|
Significant Reduction in Current–Year Funding Requirement. For 2008–09, General Fund tax proceeds are expected to come in about $8 billion lower than budget act assumptions. This revenue decline reduces the Proposition 98 minimum guarantee by roughly $4 billion. Reducing Proposition 98 spending from the budget act level to the minimum guarantee would require legislative action. For purposes of projecting current–law expenditures, we therefore assume no midyear action. However, in our recent report, Overview of the Governor’s Special Session Proposals, we identify $1 billion in midyear program reductions. We also identify up to $1.1 billion in prior–year Proposition 98 obligations that could be paid off while simultaneously reducing spending that counts toward the current–year minimum guarantee.
Budget–Year Forecast Shows Big Drop From Current Spending Level. Assuming no midyear action is taken in 2008–09, we project the Proposition 98 minimum guarantee for 2009–10 would be $54.3 billion, which is $3.8 billion, or 6.4 percent, less than the current–year spending level. Under our forecast, we project a small decline in K–12 attendance and a significant decline in General Fund revenues (resulting in another Test 3 year). Because of the significant year–to–year decrease, funding at the minimum guarantee would require significant reductions in K–14 spending. (In our Overview report, we identify more than $2 billion in potential budget–year education spending reductions.)
Out–Year Forecast. We project stronger growth throughout the remainder of the forecast period. Specifically, we project the Proposition 98 guarantee will grow by 2.4 percent in 2010–11, followed by year–to–year increases of about 5 percent throughout the remainder of the forecast period. The funding increases in the latter years of the forecast period are attributable to healthier growth in the California economy. Growth in property tax revenues are relatively modest (averaging 2.5 percent annual growth) throughout the forecast period. Attendance remains virtually flat over the period.
Near–Term Decisions Will Affect Proposition 98 Outlook
Not only is the Proposition 98 funding requirement projected to decrease by $3.8 billion in 2009–10, but Proposition 98 baseline costs are projected to increase by $3.6 billion due to inflation and enrollment adjustments. These estimates, however, assume no midyear action is taken. If the state does reduce 2008–09 Proposition 98 spending and/or raise additional revenues during the special session, then some portion of the projected 2009–10 shortfall would be eliminated.
How the state chooses to address any remaining 2009–10 shortfall will have a significant impact on future Proposition 98 funding. The future funding situation will be heavily affected by the particular mix of one–time solutions, ongoing spending reductions, and ongoing revenue increases ultimately reflected in the final budget package.
Higher Education
In addition to community colleges (which are discussed above as part of the Proposition 98 forecast), the state’s public higher education segments include the University of California (UC) and the California State University (CSU). The UC consists of nine general campuses, one health sciences campus, and numerous special research facilities. The UC awards bachelors, masters, and doctoral degrees, as well as various professional degrees. Of the segments, UC has almost exclusive jurisdiction over public university research. The CSU consists of 23 campuses and several off–campus centers. The CSU grants bachelors and masters degrees and a doctorate in education, and may award joint doctoral degrees with UC under specified circumstances. Other higher education agencies include the California Student Aid Commission (CSAC), the California Postsecondary Education Commission, and Hastings College of the Law. Overall, state policy for higher education is laid out in the Master Plan for Higher Education, which was originally adopted in 1960, and partially codified in the Donahoe Act.
UC and CSU Expenditures
Our forecast assumes cost increases due to the projected impacts of inflation and enrollment growth. (As described in more detail below, growth in the college–age population is expected to slow and then turn negative by the end of the forecast period.) These costs are expected to increase at an average annual rate of about 3.9 percent during the forecast period. We assume, however, that a portion of these increases will be covered with fee increases. As a result, we project that total General Fund spending on the two university systems will increase from $6 billion in 2008–09 to $6.7 billion in 2013–14.
Key Forecast Factors. Our forecast is largely based on three key factors.
- Fees. The state has no expressed policy for annual fee adjustments at UC and CSU. Based on recent practice of the universities, we assume that enrollment fees will increase at a 10 percent rate in 2009–10, with subsequent smaller increases coming into line with inflation.
- Inflation. Neither the Master Plan nor statute provides any explicit guidance about inflationary adjustments. Over the forecast period, we assume that base funding will increase annually to compensate for inflation.
- Enrollment. Forecasting enrollment growth is more difficult. Enrollment growth depends primarily on college–going population growth and participation rates. Participation rates respond to a range of factors, including state policies in areas such as outreach and financial aid, and actions by the segments in areas such as admissions policies and class scheduling. California’s college participation rates, currently among the highest in the nation, have changed little in recent years. At the same time, state policy in recent years has sought to increase participation rates, particularly among underrepresented groups. Given this, we have assumed slight increases in participation rates at UC and CSU. Still, our enrollment projections are driven primarily by projected population changes. Annual growth in the traditional college–age population is expected to slow rapidly starting in 2009, and this population will actually begin shrinking by the end of our forecast period. On net, we assume enrollment will flatten out by the end of the forecast period.
California Student Aid Commission
Cal Grant Programs. Most of the state’s direct General Fund support for student financial aid is directed through the Cal Grant programs, which provide fee coverage and subsistence grants to eligible students. The CSAC administers both the Cal Grant Entitlement Program (in which recent high school graduates who meet certain income, grade point average, and age criteria are entitled to receive grants) and the Cal Grant Competitive Program (in which eligible students compete for a fixed number of grants). Our expenditure forecast assumes that the number of Cal Grants will level off after 2009–10, as the number of high school graduates levels off, and that the fee coverage component of the grants will increase to match projected fee increases. We project that Cal Grant costs will increase from $809 million in 2008–09 to $919 million at the end of the forecast period.
Sale of Ed Fund. In 2007, the Legislature authorized the Department of Finance (DOF) to arrange a sale (or an alternative financial arrangement) of EdFund, the state’s nonprofit agency that administers federal student loan guarantee programs. No sale has yet been completed, and subsequent legislation extended DOF’s authority to January 2011. The enacted 2008–09 budget package assumed EdFund would be sold for $500 million in 2009–10. Recent market and legal changes in the student loan guarantee business, however, have weakened the estimated market value of EdFund. These developments include volatility in credit markets and changes in the federal student loan programs that affect the revenue streams to guarantee agencies. These changes also have raised doubt about whether a sale or alternative transaction will take place during the forecast period. Because of this high degree of uncertainty, we do not include any revenue gain from the sale of EdFund in our revenue forecast.
Health
Medi–Cal
The Medi–Cal Program (the federal Medicaid program in California) provides health care services to recipients of California Work Opportunity and Responsibility to Kids (CalWORKs) or Supplemental Security Income/State Supplementary Program (SSI/SSP) grants, and other low–income persons who meet the program’s eligibility criteria (primarily families with children and the elderly, blind, or disabled). The state and federal governments share most of the program costs on a roughly equal basis.
The Spending Forecast. We estimate that General Fund spending for Medi–Cal local assistance (including benefits, county administration of eligibility, and other costs) will reach almost $14.6 billion in the current year, or about 1 percent more than the amount appropriated in the 2008–09 Budget Act. This increase is due primarily to higher caseload estimates compared to the budgeted levels.
We project that General Fund support will grow to about $15.3 billion in 2009–10, a 5.1 percent increase from current–year expenditures. This is largely due to increased caseload, utilization of services, and rising costs for those services. These effects will be partially offset by provider rate reductions, lower funding for county administration, and other recent budget actions. By the end of the forecast period in 2013–14, we estimate that General Fund spending for Medi–Cal will reach $19.6 billion, an average annual increase of 6.1 percent over the projection period.
Key Forecast Factors. Several factors play a key role in our forecast:
- Health Care Costs. A significant factor in our forecast is the assumption that the cost per person of Medi–Cal health care services will grow at an average rate of 5.2 percent annually. As shown in Figure 4, the average annual benefit cost per person enrolled in Medi–Cal is projected to grow from about $4,000 to $5,200 during the forecast period, or 5.4 percent per year. Our health care cost assumptions are subject to considerable uncertainty, and small changes in the actual rate of growth in medical costs would have significant fiscal effects.
- Medi–Cal Caseload Trends. As shown in Figure 4, we project that overall Medi–Cal caseload will grow somewhat more sharply in 2008–09 and then show modest growth throughout the rest of the forecast period. Within our overall caseload forecast, we assume that specific Medi–Cal populations would grow commensurately with increases in the state population or other underlying trends. Notably, our analysis indicates that enrollment of families that receive public assistance benefits is now increasing, a reversal of the steady decline in this enrollment category in recent years. Additionally, as the “baby boom” generation ages, the aged and disabled components of the caseload are projected to grow faster than that for families and children during the forecast period.
- Provider Rate Reductions. The 2008–09 Budget Act included reductions to the rates that Medi–Cal pays many health care providers for services rendered to Medi–Cal enrollees. The budget plan generally set these reductions at 10 percent for certain providers until March 1, 2009, when the reductions are scheduled to adjust to either 1 percent or 5 percent for different provider types. However, a lawsuit brought by some Medi–Cal providers resulted in a federal court injunction that halted the 10 percent reductions for certain provider types as of August 18, 2008. The state is appealing this injunction, but the legal process was still underway at the time this report was prepared. The budget act assumes savings of $291 million General Fund related to the rate reductions. Our forecast assumes that the injunction against the 10 percent reductions will remain in place, but that the lower reductions scheduled to begin in March 2009 will be implemented.
- Medi–Cal Eligibility Status Reporting Requirements. The 2008–09 Budget Act enacted changes to eligibility reporting requirements, eliminating continuous eligibility and implementing semi–annual status reporting for children as a condition of maintaining Medi–Cal eligibility. This practice is consistent with current requirements for adults enrolled in Medi–Cal. The budget plan reflects savings of about $14 million General Fund resulting from this new eligibility requirement for children. Over the forecast period, the new requirement is expected to result in almost 370,000 fewer enrollees in the Medi–Cal Program, with savings of about $270 million expected in 2013–14.
Healthy Families Program
The Healthy Families Program (HFP) is California’s version of the federal State Children’s Health Insurance Program (SCHIP). Funding generally is provided on a two–to–one federal/state matching basis. The program generally offers health insurance to eligible children in families with incomes below 250 percent of the federal poverty level (FPL). The federal government has also authorized the use of federal funds to cover children up to age two in families with incomes below 300 percent of FPL who have transferred to HFP from the state’s Access for Infants and Mothers program. To participate in HFP, all participating families pay a relatively low monthly premium and are offered health coverage similar to that available to state employees.
The Spending Forecast. We estimate that General Fund spending for HFP local assistance will be $398 million in 2008–09, the amount provided in the 2008–09 Budget Act. We estimate that General Fund spending for the program will increase to $426 million by 2009–10, and that by 2013–14 the program will have an annual General Fund cost of $552 million. The average annual growth in expenditures over the forecast period is projected to be about 7 percent, largely due to continuing caseload growth and medical inflation.
Key Forecast Factors. Several factors play a role in our forecast:
- Exhaustion of SCHIP Fund Balance. States must spend their federal SCHIP allocations within a set period of time (generally three years) or risk the reversion of these funds to the federal government. The state expanded its use of SCHIP funds for health coverage programs beginning in 2003–04 to prevent SCHIP funds from being reverted. As a result, the current level of SCHIP funds being spent each year now exceeds the annual SCHIP allocation to California, with the result that the balance of unspent SCHIP funds has been gradually declining. Our HFP projection assumes that the state exhausts its balance of unspent SCHIP funds in 2008–09.
- Statutory Requirement to Manage Enrollment. We assume that the Managed Risk Medical Insurance Board institutes measures to limit enrollment, such as establishing a waiting list, to ensure that HFP expenditures are limited to available state funding.
- SCHIP Reauthorization. Funding for SCHIP has been authorized by Congress only through March 2009. Our forecast assumes that Congress will reauthorize SCHIP funding beyond March 2009, and at a level necessary to support existing program caseloads. If not, state costs for HFP would be significantly greater than we have projected during the forecast period.
Developmental Services
The state provides a variety of services and supports to individuals with developmental disabilities, including mental retardation, cerebral palsy, epilepsy, autism, or other similar disabling conditions. The Department of Developmental Services, which oversees the programs, operates five developmental centers (DCs) and two smaller facilities which provide 24–hour institutional care, and contracts with 21 nonprofit regional centers (RCs) to coordinate and deliver community–based services.
The Spending Forecast. We estimate that General Fund spending for developmental services in 2008–09 will total about $2.8 billion, about the same amount of funding appropriated in the 2008–09 Budget Act. Of that total, about $2.4 billion will be spent by RCs for community–based services and about $360 million will be spent for operating the DCs.
Between 2008–09 and 2013–14, we estimate that General Fund spending for the developmental services program will grow by about $870 million and reach a total of over $3.6 billion annually. This expenditure growth is due mainly to increased spending by RCs on community–based services.
Key Forecast Factors. Our forecast of significant growth in RC spending reflects historical increases both in caseload and in the average cost of serving each RC client. Specifically, our forecast assumes that RC caseloads will grow at an average annual rate of 4.9 percent, and that costs will grow at an annual average rate of 7 percent.
Various one–time administrative and programmatic costs are anticipated in 2008–09 as a result of the continuing process of closing Agnews Developmental Center. Spending for DCs is projected to slightly decline over the rest of the forecast period.
Social Services
CalWORKs
The CalWORKs program provides cash grants and welfare–to–work services to families with children whose incomes are not adequate to meet their basic needs. The CalWORKs program is primarily funded by state General Fund and federal funds that the state receives as part of its Temporary Assistance for Needy Families (TANF) block grant. In order to receive these federal funds, the state must meet a maintenance–of–effort (MOE) requirement, which is largely satisfied through state and county spending on CalWORKs. Federal TANF funds are used both to support the CalWORKs program and for transfers to offset General Fund costs in other related programs.
The Spending Forecast. General Fund spending for the CalWORKs program is estimated to be $2.1 billion in 2008–09, a $580 million increase from the prior year. We project spending to increase by about $200 million in 2009–10. For the remainder of the forecast period, we project that spending will increase by about $95 million each year.
Key Forecast Factors. Most of the increase in 2008–09 is due to (1) depletion of the state’s reserve of federal TANF funds in 2007–08 (meaning that more program costs must be supported from the General Fund), (2) an increase in the TANF MOE requirement, and (3) a caseload increase. For 2009–10, program costs increase primarily due to caseload growth and providing a 3.9 percent statutorily required COLA. For the out–years of the forecast, the primary cost driver is the statutory COLA rather than caseloads, for reasons we discuss below.
California faces the prospect of a federal penalty, which could begin in 2010–11, for failing to meet work participation requirements in federal fiscal year 2007. Our projections do not include penalty costs because California has the potential of avoiding payment of the penalty though a corrective action plan. Nevertheless, the risk of annual penalties exceeding $100 million is a significant threat within the forecast period.
Caseload Trends and Projections. From its peak in March 1995 to a low point in July 2003, the CalWORKs caseload declined by 49 percent to about 475,000 cases. This decline in caseload is attributable to a number of factors including the strong economy of the late 1990s, annual reductions in the teen birth rate, and CalWORKs program changes which emphasized welfare–to–work services. After July 2003, the caseload grew slowly to about 493,000 cases in December 2004 and then began another decline reaching a new low of 456,000 cases in June 2007. Since then, the caseload has been increasing, reaching 478,000 cases as of July 2008, probably due to more difficult economic conditions. We project caseload will continue to increase about 3.7 percent in 2008–09 and 2.4 percent in 2009–10. For the final four years of the forecast, we believe the caseload will be essentially flat (rather than increasing) due to economic recovery and favorable demographic conditions (almost no growth in the population of women age 15 to 44, those most likely to be eligible to enroll in CalWORKs).
SSI/SSP
The SSI/SSP provides cash assistance to eligible aged, blind, and disabled persons. The SSI component is federally funded and the SSP component is state funded.
The Spending Forecast. General Fund spending for SSI/SSP is estimated to be over $3.7 billion in 2008–09, an increase of 2.3 percent compared to the prior year. For 2009–10, we project a 3.3 percent increase, raising total expenditures to nearly $3.9 billion. From 2008–09 through 2013–14, we forecast that spending for SSI/SSP will increase at an average annual rate of 6 percent, eventually reaching a total of over $5 billion.
Key Forecast Factors. The two primary cost drivers for SSI/SSP are caseload growth and the cost of providing the state statutory COLA. Under current law, the annual state COLA is provided each June. However, trailer bill legislation deleted the COLA in 2007–08 and 2008–09. The next state COLA is scheduled to be provided in June 2010, resulting in a one–month cost of $23 million in 2009–10, increasing to about $250 million in 2010–11. For the remainder of the forecast, the annual COLA will add costs of about $130 million each fiscal year.
Caseload Trends and Projections. From 1997–98 through 2005–06 the caseload grew at a steady rate of just over 2 percent per year. In 2006–07 and 2007–08 caseload growth dropped to 1.4 percent and 1.7 percent, respectively. Given future anticipated growth in the aged population, we project caseload growth to return to over 2 percent annually in the forecast period.
In–Home Supportive Services (IHSS)
The IHSS program provides various services to eligible aged, blind, and disabled persons who are unable to remain safely in their homes without such assistance. Program costs are shared 50 percent federal, 32 percent state, and 18 percent county.
The Spending Forecast. General Fund spending for IHSS is expected to be over $1.8 billion in 2008–09, an increase of about 11 percent compared to the prior year. This increase is primarily due to caseload growth and provider wage increases. For 2009–10, we project that costs will increase by 7 percent to a total of nearly $2 billion. For the forecast period, we expect costs to increase an average of 7.9 percent each year, resulting in General Fund expenditures of over $2.7 billion in 2013–14.
Key Forecast Factors. The primary cost drivers for IHSS are caseload growth of about 6.9 percent per year and increases in provider wages. Based on historical trends, we have typically forecasted the growth in the General Fund cost of IHSS wage increases to be about $35 million per year. However, for 2008–09 through 2010–11 we are forecasting slower growth in wage costs (about $25 million to $30 million per year) because it is likely that the current weakness in the economy will cause counties to provide more modest increases in provider wages.
Figure 5 presents recent trends and our projections of IHSS General Fund costs per person and caseload growth. From 1999–00 through 2002–03, the cost per case increased rapidly, primarily due to increases in provider wages and the hours of services provided to recipients. Growth in the General Fund cost per case declined in 2003–04 due to the approval of a federal waiver authorizing some recipients in the state–only “residual” program to become eligible for federal financial participation. Due to the current weakness in the economy, we anticipate the cost per case will level off at the beginning of the forecast period due to more modest increases in provider wages. The figure also illustrates the increase in the IHSS caseload. Although increases in the cost per case have varied over the years, the caseload has grown steadily from about 230,000 cases in 1999–00 to an estimated 600,000 cases in 2013–14.
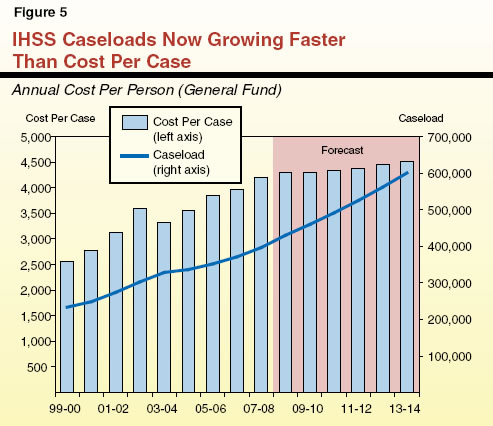
Judiciary and Criminal Justice
The major state judiciary and criminal justice programs include support for two departments in the executive branch—the California Department of Corrections and Rehabilitation (CDCR) and the Department of Justice—as well as expenditures for the state court system. The single largest criminal justice program in terms of state operational costs—CDCR—is discussed in more detail below, along with major capital outlay expenditures anticipated for that department.
CDCR
The CDCR is responsible for the incarceration and care of adult felons and nonfelon narcotics addicts at 33 state prisons, as well as the rehabilitation of youthful offenders at 6 youth correctional facilities. The CDCR also supervises and provides services to parolees and wards released to the community.
The Spending Forecast. General Fund expenditures for the support of CDCR operations for 2008–09 are estimated to be about $9.8 billion (excluding lease–revenue bond payments, capital outlay, and certain other expenditures). This would be generally in line with the amount of funding provided in various budget items in the 2008–09 Budget Act.
Spending is projected to increase by about 1 percent above the revised 2008–09 level to $9.9 billion in 2009–10. During the entire forecast period, General Fund spending is projected to increase at an average annual rate of 2.6 percent, reaching $11.2 billion in 2013–14. Our estimates for the forecast period include adjustments for employee compensation increases, but do not include General Fund support for capital outlay and debt service, which are accounted for elsewhere in our projections.
During the forecast period, the state’s General Fund operational costs are assumed to be partially offset by $111 million in annual reimbursements from the federal government for a portion of the state’s costs of housing undocumented immigrants convicted of felonies in California.
Key Forecast Factors. Several factors play a key role in our forecast:
- Salary Increases and Inflation. General salary increases for CDCR staff are projected to increase expenditures by about $950 million during the projection period. The CDCR salary growth accounts for roughly one–half of the total statewide growth in General Fund spending for salary increases (non–education employees) estimated to occur through 2013–14. In addition, price adjustments for CDCR operating expenses are projected to account for about $380 million in increased costs.
- Adult and Juvenile Offender Populations. As Figure 6 shows, the adult prison population is projected to remain stable at about 171,000 inmates during the forecast period. The adult parole population is projected to decrease by about 9,700 offenders, reaching 115,000 by the end of the projection period. However, if the federal courts intervene and set a limit on the prison population—as is currently being considered—prison caseload and state expenditures would be lower than we have projected. Our forecast also assumes that the number of wards in state youth correctional facilities will drop by almost 400, while the number of juvenile parolees is anticipated to decrease by about 1,100. These projected decreases in the juvenile population partly reflect a continued trend of declining juvenile court commitments, but are mainly due to recent changes in state law that halt the admission of certain lower–level offenders to state youth correctional facilities and instead require that they be supervised at the county level. In total, we estimate that these caseload changes in the adult and juvenile offender populations supervised by the state will result in a net decrease in CDCR expenditures of about $70 million by the end of the forecast period.
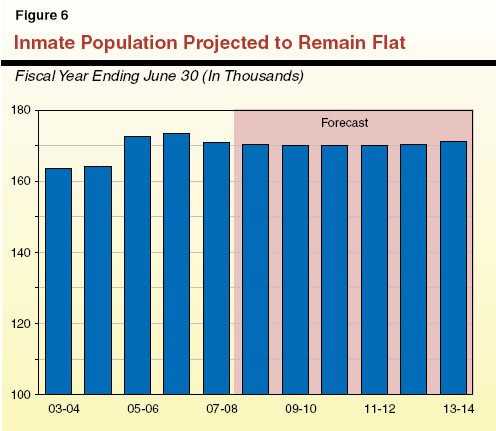
- Inmate Health Care Improvements. Our projections include estimates of the increased support costs at existing prison facilities necessary to fully implement the remedial plan designed by the federal court–appointed Receiver in charge of improving inmate medical care. Based on the Receiver’s plan, our forecast assumes that these new support costs will result in an increase of over $200 million in one–time expenditures and about $40 million in ongoing expenditures. The support and capital outlay costs associated with the Receiver’s plan to build new prison medical facilities are discussed in the capital outlay section below.
- Operating Costs for New Prison Facilities. Chapter 7, Statutes of 2007 (AB 900, Solorio), authorizes the construction of thousands of additional prison beds, as well as makes other changes. Our projections assume that roughly 10,000 additional prison beds will be constructed during the forecast period, resulting in additional General Fund support expenditures to staff and operate the new facilities. We estimate the increased costs to implement Chapter 7 (hereafter referred to as AB 900) will reach about $210 million by the end of the forecast period. As we discuss below, AB 900 also allocated funding to construct health care facilities for inmates.
Capital Outlay Expenditures for CDCR. We estimate that capital outlay expenditures for CDCR during the five–year forecast period will be about $5.9 billion. About $390 million of the costs incurred from 2009–10 through 2013–14 are assumed to be paid directly from the state General Fund, with the balance of about $5.5 billion paid using lease–revenue bonds. The General Fund debt service to repay these bonds is estimated to amount to over $400 million annually in 2013–14. Most of these capital outlay costs result from the implementation of AB 900.
- New Prison Facilities. We estimate that about 7,700 prison beds on the grounds of existing state prisons and 2,500 beds in secure reentry facilities would be built during the forecast period, and that grants would be issued to counties to support the construction of more than 7,000 county jail beds during this time.
- Health Care Facility Improvements. In addition, AB 900 included $1.1 billion in lease–revenue bonds to construct medical, dental, and mental health treatment or housing for inmates, including facility needs driven by the settlements and court orders of several federal court cases. Of this amount, our forecast assumes that about $300 million would be used to build new medical and mental health facilities and approximately $800 million would support a portion of the federal Receiver’s proposed $8 billion prison health care construction program. At the time this report was prepared, the Receiver’s request had not been approved by the Legislature and was pending in court. Thus, our projections do not reflect the full fiscal effect of the Receiver’s construction program. (We discuss this issue in more detail in the nearby box.)
Federal Receiver’s Prison Health Care Construction Program
The federal–court appointed Receiver in the Plata inmate medical care legal case is proposing a health care construction program totaling $8 billion, including $6 billion to build new medical prisons, $1 billion to renovate existing facilities, and $1 billion to build other health–related facilities. Although most of these improvements were included at the Receiver’s request in the administration’s 2008–09 budget proposal, the Legislature did not approve them. Currently, the Receiver’s construction plan is the subject of pending federal court litigation initiated by the Receiver to obtain additional funding for these projects from the state.
Our projections for the California Department of Corrections and Rehabilitation do not include funding for the Receiver’s entire health care construction program. Rather, we assume that only funds already approved by the Legislature in Chapter 7, Statutes of 2007 (AB 900, Solorio), and earmarked for health care–related projects will be available to support the program. Specifically, we assume that $800 million in lease–revenue bonds will be used to renovate existing medical facilities, with the balance of about $300 million spent for other medical and mental health facilities. If the Receiver’s entire health care construction plan was funded by 2013–14 using lease–revenue bonds, as the Receiver has proposed, the General Fund debt service to repay these bonds would reach over $450 million annually by the end of our forecast period.
The new medical prisons requested by the Receiver would also result in a significant increase in prison operation costs potentially exceeding $200,000 for each new bed added in the Receiver’s proposed new facilities. However, these costs would be partly offset with state savings from shifting certain inmates out of existing prison facilities. |
Other
Employee Compensation
Departments’ budgets include the current costs of compensating state employees. In 2007–08, the General Fund paid over $10 billion (excluding higher education) in salary and benefit costs. Each year, the budget includes funds for additional compensation and benefit provisions that will take effect in the budget year. The 2008–09 Budget Act appropriates $124 million from the General Fund for this purpose. The vast majority of state employees are not expected to receive any cost–of–living increase in 2008–09, given that labor agreements with 20 of the state’s 21 bargaining units (including all bargaining units paid from General Fund resources) have expired.
The Spending Forecast. Our forecast assumes that the Legislature appropriates just over $50 million from the General Fund in 2009–10 to cover health benefit cost increases and certain compensation increases required under current law (principally, required pay raises for judges). Given the state’s fiscal condition and the lack of current labor agreements, our forecast assumes no cost–of–living increases for state employees in 2009–10. Beginning in 2010–11, however, we assume annual general salary increases for state employees, and health benefit premium increases negotiated by the California Public Employees’ Retirement System (CalPERS) averaging about 7 percent per year over the forecast period. After the cumulative effect of these increases, annual General Fund employee compensation costs would be $1.9 billion higher in 2013–14 than they were in 2007–08.
Key Forecast Factors. We assume that the average state employee receives a cost–of–living increase of about 3 percent per year from 2010–11 through 2013–14. If the Legislature decides to appropriate funds for cost–of–living increases for state employees in 2009–10, it would increase costs above those reflected in our forecast. Currently, a 1 percent raise for state employees would result in about $100 million of additional General Fund costs.
Retirement
The 2008–09 Budget Act includes about $4.6 billion of General Fund contributions to benefit programs serving retired state employees and teachers. (This amount excludes Social Security and Medicare employer taxes.) The state’s payments to CalPERS pension programs account for about 40 percent of this total. Payments to (1) Cal–PERS for health benefits of retired state and CSU employees and (2) the California State Teachers’ Retirement System (CalSTRS) for teacher pension benefits each make up between 25 percent and 30 percent of the total. The 2008–09 budget package reduces the state’s payments to CalSTRS on an ongoing basis by over $66 million per year beginning in 2008–09.
The Spending Forecast. Overall, we estimate that General Fund retirement costs increase from $4.6 billion in 2008–09 to over $6 billion in 2013–14. Over one–half of this growth results from retiree health expenses, given our assumption that annual premium increases will average about 7 percent per year throughout the forecast period. Consistent with recent legislation, the forecast assumes that the state pays $56 million per year for four fiscal years beginning in 2009–10 for interest costs associated with a 2007 court order requiring the repayment of funds withheld from CalSTRS in 2003–04. (The principal amount was repaid to CalSTRS in 2007–08.)
Key Forecast Factors. The forecast assumes that CalPERS’ investment portfolio loses about 15 percent of its value due to stock market and other asset value declines in 2008–09. Under a policy established by CalPERS in 2005, such investment losses are generally “smoothed” over about 15 years when setting employer contribution rates, thus minimizing increases in employer contribution rates in any given year. Given our assumption about CalPERS investment losses in 2008–09, the forecast projects that state pension contribution rates will increase modestly through the forecast period. Employer contributions for the largest group of state employees (those in the Miscellaneous Tier I retirement tier) rise from 16.6 percent of payroll in 2008–09 to over 18 percent of payroll in 2013–14 under this scenario.
Major Expenditure Risks Not Reflected in the Forecast. In recent years, we have noted the risks to the state budgetary outlook related to unfunded liabilities for retiree health and pension programs. Budgetary risk has increased further due to the recent decline in the value of stocks and other investments held by public pension systems.
The smoothing policy of CalPERS minimizes volatility in employer pension contribution rates, and state contributions to CalSTRS generally are fixed in statute. Nevertheless, both systems have existing provisions for larger employer contributions in certain cases following extreme investment losses. At the time this publication was being prepared, CalPERS’ investment portfolio had lost about 20 percent of its value since the beginning of 2008–09. Such investment losses, if they persist or worsen through June 30, 2009, may result in higher state contribution requirements than those included in our forecast. (Any such increases would phase in beginning in 2010–11.) If, for example, the two pension systems were to lose 20 percent of their investment value in 2008–09 and generate annual investment returns no greater than about 8 percent (the amount assumed by system actuaries) over the next few years, state contributions to the systems could be around $1 billion higher than we forecast by 2013–14.
Our forecast includes no state contributions to the UC Retirement Plan, which has had no unfunded actuarial accrued liability during the last two decades. Yet, neither UC employees nor UC currently contribute to the ongoing costs of the plan. Even before recent stock market declines, the lack of contributions to the UC plan practically ensured that unfunded liabilities would emerge over the next few years. Given the recent stock declines, it is likely that actuarial valuations of the UC plan will reveal an unfunded liability beginning in 2009. State contributions to keep the plan well funded, if approved by the Legislature, could add hundreds of millions of dollars to our retirement cost forecast by 2013–14.
In addition to reflecting the current contribution policy for the UC pension plan, the forecast assumes no expenditures during the forecast period to amortize existing or potential unfunded liabilities for (1) state and CSU retiree health benefits administered by CalPERS, (2) CalSTRS’ pension programs, or (3) UC’s retiree health program. On a combined basis, these retirement programs have unfunded liabilities estimated to about $80 billion as of the date this publication was prepared. The additional annual costs to amortize these unfunded liabilities over 30 years would be several billion dollars (in today’s dollars), assuming continuation of current benefit levels.
Debt Service on Bonds
The General Fund incurs debt–service costs for both principal payments and interest owed on two basic types of bonds used to fund infrastructure—voter–approved general obligation bonds and statutorily authorized lease–revenue bonds. (The latter have commonly been used to finance correctional and higher education facilities, among other purposes. Their debt service is paid out of appropriations made by the General Fund to the entities that occupy and lease the facilities that the bonds have funded.) In recent years, the General Fund has also incurred costs for the deficit–financing bonds that the state has issued to help deal with its budgetary problems.
The Spending Forecast. General Fund spending for debt service on bonds used to fund infrastructure is estimated to be $4.3 billion in 2007–08, $5 billion in 2008–09, and $5.9 billion in 2009–10. In total, debt service is projected to grow at an annual pace of 9.9 percent annually over the forecast period.
Key Forecast Factors. Projections of debt–service costs depend primarily on the volume of past and future bond sales, their interest rates, and their maturity structures. Regarding bond sales, our projections are based on a combination of existing bond authorizations and estimates about when various bond–related programs will be in need of funds. Over the entire forecast period, we are assuming that a total of about $65 billion of general obligation and lease–revenue bonds will be sold, based on plans for the infrastructure projects involved. A small share of this—about $3 billion—is from the nearly $11 billion in new bonds for high–speed rail and children’s hospitals authorized by the voters in the November 2008 statewide general election. The remainder is from previously authorized but as–yet–unissued bonds. We assume that interest rates track our economic forecast, while maturity structures reflect recent bond sales. The exact timing of bond sales in the near future is subject to change depending on the extent to which the financial and credit markets stabilize following their October disruptions.
Debt–Service Ratio (DSR). The DSR for bonds—that is, the ratio of annual General Fund debt–service costs to annual General Fund revenues and transfers—is often used as one indicator of the state’s debt burden. There is no one “right” level for the DSR. However, the higher it is and more rapidly it rises, the more closely bond raters, financial analysts, and investors tend to look at the state’s debt practices, and the more debt–service expenses limit the use of revenues for other programs. Figure 7 shows what California’s DSR has been in the recent past and our DSR projections for the forecast period. We estimate that:
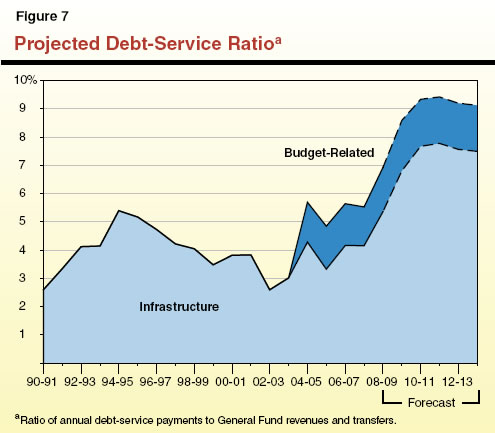
- The DSR for infrastructure bonds will rise to 7.8 percent in 2011–12 before falling to 7.5 percent by 2013–14. Thereafter, it will steadily decline as outstanding bonds are paid off.
- If the state’s deficit–financing bonds (known as Economic Recovery Bonds) are included in DSR, it would peak at 9.4 percent in 2011–12. It is anticipated that these bonds will be paid off following our forecast period, at which time the DSR will drop down to reflect only infrastructure bonds.
As noted in the figure, the DSR we are projecting is considerably higher than in past years. In part, this reflects the sharp fall–off in General Fund revenues we are projecting, which has the effect of driving the ratio up for a given level of debt service. It also is important to note that to the extent additional bonds are authorized and sold in future years beyond those already approved, the state’s debt–service costs and DSR would be higher than projected above. For example, each additional $1 billion of bonds authorized would add roughly $65 million annually to debt–service costs once they are sold.
|
Acknowledgments
The Legislative Analyst's Office (LAO) is a nonpartisan
office which provides fiscal and policy information and advice to the Legislature. |
LAO Publications
To request publications call (916) 445-4656. This report and others, as well as
an E-mail subscription service , are
available on the LAO's Internet site at www.lao.ca.gov. The LAO is located at 925
L Street, Suite 1000, Sacramento, CA 95814.
|
Return to LAO Home Page