Overall Health and Social Services Budget. In 2009–10, spending on health and social services (H&SS) departments and entities is estimated to be $25 billion, 29 percent of statewide General Fund expenditures. When total funds are considered, including special funds, federal funds, and the General Fund, total expenditures are estimated to be $70.3 billion, or 36 percent of budgeted spending in California.
Spending Concentrated in Relatively Few Departments. The Department of Health Care Services accounts for 44 percent of General Fund spending and the Department of Social Services accounts for 35 percent. Most of the remainder is the Departments of Developmental Services and Mental Health.
Spending Growth Trends. General Fund spending for the major health services departments increased from $10.4 billion in 1999–00 to $15.8 billion in 2009–10, an increase of $5.4 billion or 52 percent. After adjusting for the effect of the enhanced federal funding provided under the American Recovery and Reinvestment Act (ARRA), General Fund spending would have grown from $10.4 billion to $19.5 billion, an increase of $9.1 billion (88 percent). For social services, General Fund spending has increased from $7 billion in 1999–00 to $9 billion in 2009–10, an increase of $2 billion or 29 percent (an increase of $2.8 billion or 40 percent after adjusting for ARRA). Generally, spending increased faster in the early part of the decade and grew more slowly in more recent years. Many different factors have contributed to these spending trends.
Federal Funding Is Key. Federal funding is the single largest source of funds for H&SS programs. This funding comes to California through many different streams with differing rules and requirements.
As the Legislature confronts a $20 billion budget shortfall for 2009–10 and 2010–11, it faces many difficult decisions regarding spending reductions and revenue increases. In 2009–10, expenditures for health and social services (H&SS) programs are estimated to be about $25 billion or 29 percent of statewide General Fund spending. The H&SS spending accounts for 36 percent of total spending, including special funds, federal funds, and the General Fund.
The purpose of this H&SS budget primer is to give policymakers an understanding of the overall H&SS expenditures, the workings of major health and social services programs, spending trends in major programs, and the major funding sources for H&SS programs. A companion document, entitled
The 2010–11 Budget: Health & Social Services—A Restricted Environment examines the degree of control the Legislature has over various major H&SS programs. Together, these reports provide a framework for making very difficult budget decisions in H&SS.
The H&SS programs are administered by 20 different departments and other state entities, such as boards, commissions, councils, and offices. These departments and entities provide health coverage and social services for various groups of eligible persons—primarily poor families and children as well as seniors and persons with disabilities. Figure 1 shows General Fund and total funds expenditures for H&SS programs.
Figure 1
Health and Social Services Proposed Expenditures
(In Millions)
|
Fund/Program Area
|
2008–09
|
2009–10
|
2010–11
|
Change From 2009–10
|
|
Amount
|
Percent
|
|
General Fund
|
|
|
|
|
|
|
Health
|
$18,437.0
|
$16,011.4
|
$13,754.8
|
–$2,256.6
|
–14.1%
|
|
Social Services
|
9,841.4
|
9,033.4
|
7,244.3
|
–1,789.1
|
–19.8
|
|
Totals
|
$28,278.4
|
$25,044.9
|
$20,999.2
|
–$4,045.7
|
–16.2%
|
|
All Funds
|
|
|
|
|
|
|
Health
|
$51,382.7
|
$60,855.2
|
$52,552.2
|
–$8,302.9
|
–13.6%
|
|
Social Services
|
19,817.0
|
19,880.8
|
17,765.3
|
–2,115.5
|
–10.6
|
|
Totals
|
$71,199.7
|
$80,736.0
|
$70,317.6
|
–$10,418.4
|
–12.9%
|
Most of the expenditures for H&SS are concentrated within a few departments. Figure 2 shows that in 2009–10 almost 80 percent of General Fund spending is concentrated in two departments: 44 percent in the Department of Health Care Services (DHCS) and 35 percent in the Department of Social Services (DSS). The Department of Developmental Services (DDS) and the Department of Mental Health (DMH) account for most of the remainder.
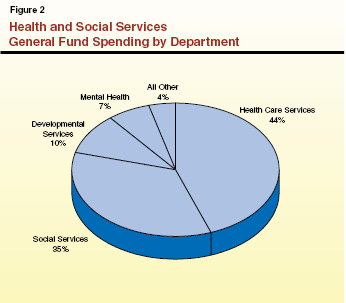
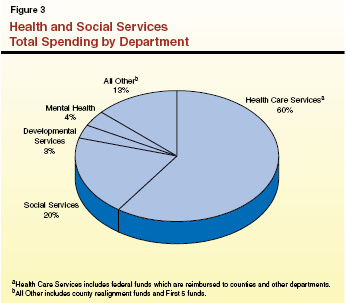
Figure 3 shows how total fund spending for 2009–10 is divided among the departments. Spending for DHCS jumps significantly from 44 percent of General Fund spending to 60 percent of total spending. This is mostly due to federal requirements regarding state administration of the state’s Medicaid program (known as Medi–Cal). Under Title XIX of federal law, the federal Centers for Medicare and Medicaid Services (CMS) requires each state to designate a single one of its agencies to be responsible for administration and supervision of its Medicaid program. The DHCS is California’s designated state agency and as such is the recipient of federal matching funds (hereinafter referred to as Title XIX funds) for Medi–Cal. The DHCS passes these Title XIX funds through to counties and to other state departments that administer parts of the Medi–Cal Program. However, in the spending totals for departments cited in this report, these federal funds are reflected in the DHCS budget and are not reflected in the spending totals for the other departments shown in Figure 3.
Beneficiaries May Receive Assistance From Multiple H&SS Programs. Many beneficiaries simultaneously receive assistance from two or more H&SS programs. For example, some beneficiaries are enrolled in both In–Home Supportive Services (IHSS) administered by DSS and regional centers (RCs) overseen by DDS. Similarly, recipients of Supplemental Security Income/State Supplementary Program (SSI/SSP) and California Work Opportunity and Responsibility to Kids (CalWORKs) program all receive Medi–Cal.
Safety Net. Federal, state, and local governments and charities provide many H&SS programs. Collectively and individually, these programs are referred to as the “safety net.” In fact, the term safety net has several meanings, as discussed in the box below.
Following our discussion of the safety net, we discuss the state’s major health programs, followed by the social services programs and the various funding streams for all these programs.
|
The federal, state, and local governments administer and fund an array of health and social services (H&SS) programs. The term “safety net” is frequently used in the context of H&SS programs and has at least four different meanings.
General Term for Many H&SS Programs. Most H&SS programs provide government–funded benefits to families and individuals who have no income or incomes below specified eligibility thresholds. Because such families cannot provide entirely for themselves, they rely on the safety net, in this context a synonym for government–run H&SS programs, particularly those programs providing income maintenance and basic health care.
County Support for the Indigent. The term safety net is sometimes used to refer to Welfare and Institutions Code (WIC) 17000 and related provisions of law that establish California’s counties as the provider of last–resort of health care and income maintenance. Generally, individuals who are not eligible for state and federal programs are eligible for county programs operated pursuant to WIC 17000. County general assistance provides income maintenance to individuals ineligible for the CalWORKs or SSI/SSP programs. Similarly, county indigent health programs provide basic and emergency health services to individuals ineligible for state and federal programs. These county indigent programs are funded with realignment funds and with county local funds.
Private Charity. Charities may step in to provide what have been termed safety net services when they perceive that there is a need that is not being met by federal, state, and local government or other entities. Charities are usually nonprofit entities or groups of private citizens. In some cases charity may be provided by a single person—for example, a doctor who agrees to waive fees and see a patient who is unable to pay for the doctor’s services. Similarly, food banks are a resource for Californians experiencing food insecurity that are heavily supported through private donations. Generally, donations to major charities that provide these types of services drop when the economy takes a downturn. It is during an economic downturn, however, that the demand for charity services is most likely to increase. Due to the voluntary nature of charitable donations, and the discretion that charities have to allocate their resources, it is difficult to predict the degree to which charities will be in a position to supplement these government services.
Program for Certain CalWORKs Children. Current law generally limits able–bodied adults to five years of cash assistance. After this five–year time limit, the children in the case continue to receive cash benefits at a reduced level in a program informally known as the safety net.
|
California’s major health programs provide a variety of benefits to its citizens. These include: (1) health care services to welfare recipients and other qualified low–income persons (primarily families with children and the aged, blind, or disabled), (2) community–based and institutional services for persons with developmental disabilities, (3) community–based and institutional services to persons with mental illnesses, (4) subsidized health insurance for children from low–income families, and (5) a broad range of what are termed public health programs.
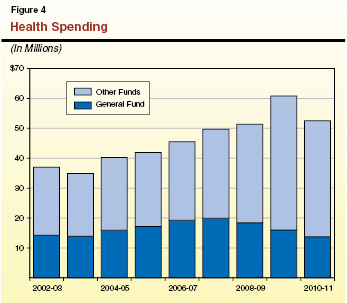
Figure 4 shows that General Fund spending on health programs increased from about $14 billion in 2002–03 to about $20 billion in 2007–08 and will drop to about $16 billion in 2009–10. Total spending, when all fund sources are considered, increased from about $37 billion in 2002–03 to about $61 billion in 2009–10. The significant increase in total spending between 2008–09 and 2009–10 can be explained by anticipated revenues from a recently enacted hospital fee, the state’s receipt of a full year of enhanced federal funding for Medi–Cal, and caseload growth related to the recession.
Departments Providing Health Services. A total of ten state departments and entities oversee and provide health services in California. Figure 5 shows the level of General Fund support for these departments in 2008–09 and the difference between current year and the proposed budget–year funding levels in the Governor’s budget plan. The DHCS, which includes the Medi–Cal, Family Health, and Primary and Rural Health programs, accounts for about 70 percent of General Fund spending for health services in the current year.
Figure 5
Health Department’s Proposed General Fund Expenditures
(Dollars in Millions)
|
|
2008–09
|
2009–10 Revised
|
2010–11 Proposeda
|
Change from 2009–10
|
|
Difference
|
Percent
|
|
Department of Health Care Services
|
$12,960.5
|
$11,160.6
|
$9,150.2
|
–$2,010.4
|
–18.0%
|
|
Department of Developmental Services
|
2,513.2
|
2,488.8
|
2,388.7
|
–100.1
|
–4.0
|
|
Department of Mental Health
|
1,919.4
|
1,725.0
|
1,474.4
|
–250.6
|
–14.5
|
|
Managed Risk Medical Insurance Board
|
389.0
|
217.0
|
128.4
|
–88.6
|
–40.8
|
|
Department of Public Health
|
344.9
|
192.4
|
304.9
|
112.5
|
58.5
|
|
Department of Alcohol and Drug Programs
|
277.5
|
181.5
|
178.8
|
–2.7
|
–1.5
|
|
Emergency Medical Services Authority
|
11.5
|
8.4
|
9.0
|
0.6
|
7.1
|
|
Secretary for Health and Human Services
|
3.1
|
3.6
|
3.7
|
0.1
|
2.8
|
|
Office of Statewide Health Planning and Development
|
0.3
|
0.1
|
0.1
|
—
|
—
|
|
California Medical Assistance Commission
|
1.2
|
1.2
|
1.3
|
0.1
|
8.3
|
|
General Obligation Bond Debt Service
|
16.5
|
32.8
|
115.3
|
82.5
|
251.5
|
|
Totals
|
$18,437.1
|
$16,011.4
|
$13,754.8
|
–$2,256.6
|
–14.1%
|
Major Program Areas. The state administers six major programs that represent more than 95 percent of the total General Fund health spending in the current year. Figure 6 summarizes the actual and estimated General Fund expenditures for these programs from 2003–04 through 2009–10. As can be seen in Figure 6, between 2003–04 and 2009–10 General Fund spending has grown for all of the major health programs except for Developmental Centers (DCs) and the Healthy Families Program (HFP). The decrease in spending on DCs can be explained by the closure of Agnews DC during the period and the shift of a number of DC clients into community–based services. The decrease in spending in HFP can mainly be explained by using other funding sources in lieu of General Fund. In some programs, such as community mental health services, funding shifts between programs may make it appear as if a program is growing faster than is really the case.
Figure 6
General Fund Spending for Major Health Programs
(In Millions)
|
Program
|
2003–04
|
2004–05
|
2005–06
|
2006–07
|
2007–08
|
2008–09
|
2009–10 Revised
|
|
Medi–Cal DHCS
|
$9,879.2
|
$11,592.6
|
$12,362.9
|
$13,406.0a
|
$14,036.0
|
$12,647.8
|
$10,920.0
|
|
Regional Centers
|
1,582.1
|
1,718.7
|
1,831.3
|
2,106.8
|
2,120.9
|
2,178.0
|
2,196.5
|
|
Developmental Centers
|
354.8
|
385.1
|
386.5
|
397.6
|
398.8
|
311.0
|
261.1
|
|
Community mental health services
|
306.1
|
303.9
|
313.6
|
775.2a
|
766.1
|
714.3
|
544.5
|
|
Mental hospitals/long–term care
|
573.6
|
660.9
|
802.2
|
959.2
|
1,099.4
|
1,158.1
|
1,126.5
|
|
Healthy Families Program
|
276.4
|
288.4
|
316.7
|
347.7
|
387.0
|
386.8
|
214.8
|
|
Totals
|
$12,972.2
|
$14,949.6
|
$16,013.2
|
$17,992.5
|
$18,808.2
|
$17,396.0
|
$15,263.4
|
Below we describe the key features of the state’s major health programs, beginning with Medi–Cal. We note that some state health programs, and Medi–Cal in particular, interact in a number of ways with federal health care programs. For more information on how state and federal health programs interact, see the nearby box.
|
The federal government administers two major programs that provide medical services that interact in a significant way with state health programs: (1) Medicare, a health insurance program, provides coverage to eligible beneficiaries—mostly persons 65 and over or persons with disabilities; and (2) the U.S. Department of Veterans Affairs (DVA) provides patient care and federal benefits to veterans and their families.
A person may be eligible for health programs administered by both the state and federal government. For example, a low–income, disabled veteran may be eligible for Medi–Cal as well as medical services provided by the DVA and Medicare. In such cases, the responsibility for providing services may overlap and it may be difficult for program administrators to determine which government entity is the primary payer and which is the payer of last resort. When persons are eligible both for state and federal programs, generally the state is the payer of last resort.
|
In California, the federal Medicaid program is administered by DHCS as the California Medical Assistance Program (Medi–Cal). The Medi–Cal Program provides health care services to qualified low–income persons, primarily consisting of families with children and the aged or disabled. Federal law establishes some minimum requirements for state Medicaid programs regarding the types of services offered and who is eligible to receive them. Required services include hospital inpatient and outpatient care, skilled nursing care, and doctor visits. In addition, California offers an array of services considered optional under federal law, such as coverage of prescription drugs and durable medical equipment. California also has expanded eligibility beyond the levels required under federal law.
Components of the state’s Medi–Cal Program are administered by departments other than DHCS. For example, DSS administers the IHSS program, and DMH administers community mental health services that rely in part on Medi–Cal funding. Accordingly, a significant amount of Title XIX funds that are paid to DHCS from the CMS are transferred again by DHCS to other departments that administer components of Medi–Cal. In addition, the state passes through Medicaid funding to counties for administration of eligibility determinations.
Community Services Provided by RCs. Twenty–one nonprofit corporations known as RCs that are located throughout the state provide community–based services to developmentally disabled persons. The RCs are responsible for eligibility determinations and consumer assessment, the development of an individual program plan for each consumer, and case management. The RCs generally pay for services only if an individual does not have private insurance or a center is unable to refer an individual to so–called “generic” services that are provided by the state or at the local level by counties, cities, school districts, and other agencies. The RCs also purchase services such as transportation, health care, day programs, and residential care provided by community care facilities. The Department of Developmental Services (DDS) contracts with RCs to provide services to more than 230,000 clients each year.
Developmental Centers. The department operates four DCs and one smaller leased facility, which provide 24–hour care and supervision to approximately 2,150 clients. All of the facilities provide residential and day programs as well as health care and assistance with daily activities, training, education, and employment. About 6,500 permanent and temporary staff serve the current population of about 2,150 clients at all five facilities. The administration announced that it will present a closure plan for Lanterman DC by April 1, 2010.
Community Services. Community mental health services include a variety of programs administered by DMH, generally through state–county partnerships. Based on total expenditures, the four biggest programs are Mental Health Services Act (MHSA) services; Mental Health Managed Care (MHMC); Early and Periodic Screening, Diagnosis, and Treatment (EPSDT); and “AB 3632” Special Education Pupils Program. Generally, the services provided by these programs are intended to help improve the health and functionality of individuals with mental illness while also minimizing their potential for disability, homelessness, criminal activity, and hospitalization. Specifically:
- The MHSA, passed by voters in 2004, imposes a 1 percent income tax on personal incomes in excess of $1 million to support the expansion of community mental health services. Most MHSA services are provided by the counties, although some MHSA activities are coordinated by DMH at the statewide level.
- The MHMC program provides specialty mental health services to Medi–Cal–eligible adults through county Mental Health Plans which are “carved out” of the regular Medi–Cal services administered by DHCS.
- The EPSDT, a federally mandated program, requires states to provide a broad range of screening, diagnosis, and medically necessary treatment services to Medi–Cal beneficiaries under age 21 even if these services are otherwise optional under the state’s Medicaid plan.
- Chapter 1747, Statutes of 1984 (AB 3632, W. Brown), and related statutes established the Special Education Pupils Program, also known as the AB 3632 program, and shifted the responsibility for providing special education related mental health services from local education agencies to counties.
State Hospitals and Long–Term Care Services. The DMH administers the Long–Term Care Services Program, which includes the state’s five mental hospitals, the Forensic Conditional Release Program, and the Sex Offender Commitment Program. The state’s mental hospitals provide inpatient treatment services for judicially and civilly committed clients, mentally disabled county clients, and transfers from the California Department of Corrections and Rehabilitation (CDCR). In addition, the Long–Term Care Services Program manages state prison psychiatric treatment services at the California Medical Facility at Vacaville and at Salinas Valley State Prison. About 10,700 permanent and temporary staff serve the current population of about 6,200 at all facilities.
Forensic patients are generally committed by the courts to state hospitals under one of four categories: “incompetent to stand trial”, “mentally disordered offender”, “not guilty by reason of insanity”, and “sexually violent predators”. Some inmates and wards of CDCR are transferred to the state hospitals for mental health treatment. Also, counties contract with the state to purchase beds at state hospitals for persons committed for mental health treatment under the provisions of the Lanterman–Petris–Short Act.
The Managed Risk Medical Insurance Board (MRMIB) operates the HFP, which was created in 1997 with funding provided through the federal Children’s Health Insurance Program (CHIP). Under CHIP, California receives roughly two federal dollars for each state dollar used to provide health care coverage to children through HFP. Currently, approximately 900,000 children receive comprehensive health care—including dental, vision, and basic mental health benefits—through HFP.
The program allows low–income families to purchase subsidized health insurance for uninsured children. Specifically, children (ages 1 to 19) in families making up to 250 percent of the federal poverty level (FPL) and infants (up to age 1) in families making up to 300 percent of the FPL are eligible for coverage through HFP. Eligible families pay monthly premiums based on their income, which range from $4 to $24 per child, up to a family maximum of $72 per family.
The Department of Public Health (DPH) administers and oversees a wide variety of programs with the goal of optimizing the health and well–being of Californians. The department’s programs address a broad range of health issues, including maternal and child health, cancer and other chronic diseases, communicable disease control, environmental and drinking water quality, and inspection of health facilities. Many public health programs and services are delivered at the local level, while the state provides funding, oversight, and overall strategic leadership for improving population health. The state also centrally administers certain public health programs, such as licensing and certification of health facilities.
Total spending for the major health services departments (including DHCS, MRMIB, DDS, DMH, and DPH) increased from $24.5 billion in 1999–00 to $57.8 billion in 2009–10. This is an increase of $33.4 billion or 136 percent over this ten–year period. Over the same time period General Fund spending on these departments, adjusted to exclude the effect of the enhanced federal funding provided under the American Recovery and Reinvestment Act (ARRA), grew from $10.4 billion to $19.5 billion—by $9.1 billion or 88 percent.
Key findings concerning growth for major health services departments since 1999–00 include:
- Adjusted General Fund spending on major health departments grew at an average annual rate of 8.6 percent the first half of the decade and slowed to 4.5 percent in the second half.
- For the major health programs, caseload growth between 2004–05 and 2009–10 was the slowest for Medi–Cal (at an annual average rate of 2 percent) while growth was the fastest in HFP (at 5 percent).
The primary cost drivers in health programs are caseload growth and increased costs and utilization of services. However, there are other factors that explain the growth in spending described above. Rapid expansion for HFP, which began enrolling children in July 1998, is normal for a new program and explains some of the growth in total health spending. Similarly, eligibility expansions in Medi–Cal in 2000 have resulted in an ongoing increase in spending. The transfer of the Habilitation Services Program from the Department of Rehabilitation to DDS also increased spending in health services, with a corresponding decrease in spending for social services.
Federal actions have also resulted in increased state health spending. For example, the state has increased staffing ratios at both the state mental hospitals and DCs as a result of federal actions. Increases in federal funding, such as grants for certain programs that are federal policy priorities, also result in increases in health spending, in some cases without requiring the state to make a contribution. The Women, Infants, and Children (WIC) program, for example, is entirely funded through a federal grant.
If the Legislature had not taken many actions to control caseload growth, costs, and utilization over the past ten years, the increase in spending for health programs would have been greater. For example, the Legislature acted to eliminate some optional benefits in Medi–Cal.
Caseload Trends for Medi–Cal. Figure 7 shows the caseload trend for the largest health services program, Medi–Cal, which now has about 7.3 million beneficiaries. As the figure shows, overall caseload growth has trended upward significantly between 2007–08 and the current year as compared to slower growth rates in the prior five–year period. The number of beneficiaries has increased by almost 630,000 since 2007–08. We believe the recent increase in Medi–Cal caseload growth rates is mainly due to the state’s economic condition. During a recession more people are unemployed and therefore meet the income eligibility requirements to qualify for Medi–Cal. We note that while seniors and persons with disabilities make up less than 20 percent of the caseload, they are significantly more costly than families and children.
Figure 7
Caseload
(In Thousands)
|
|
2002–03
|
2003–04
|
2004–05
|
2005–06
|
2006–07
|
2007–08
|
2008–09
|
2009–10
|
|
Medi–Cal
|
6,380.5
|
6,560.9
|
6,579.6
|
6,573.8
|
6,543.1
|
6,650.3
|
6,892.0
|
7,277.4
|
|
Percent change
|
|
2.8%
|
0.3%
|
–0.1%
|
–0.5%
|
1.6%
|
3.6%
|
5.6%
|
|
Seniors and Persons With Disabilities
|
964.6
|
995.1
|
1,016.4
|
1,031.5
|
1,044.9
|
1,069.3
|
1,097.6
|
1,123.0
|
|
Percent change
|
|
3.2%
|
2.1%
|
1.5%
|
1.3%
|
2.3%
|
2.6%
|
2.3%
|
|
Families/Children
|
4,831.3
|
4,958.6
|
4,936.9
|
4,899.9
|
4,845.1
|
4,910.9
|
5,105.8
|
5,454.5
|
|
Percent change
|
|
2.6%
|
–0.4%
|
–0.7%
|
–1.1%
|
1.4%
|
4.0%
|
6.8%
|
Caseload Growth in HFP. Between 1999–00 and 2009–10 the HFP caseload grew from about 300,000 to over 900,000, an average annual growth rate of about 13 percent. For the period 1999–00 to 2004–05 caseload grew at an average annual rate of 21 percent; whereas, since then caseload grew at an average annual rate of 5 percent. The fact that HFP was a relatively new program in 1999 as well as an eligibility expansion in that year account for the significant program growth in the first half of the decade.
Caseload Growth for RCs. Between 1999–00 and 2009–10, the RC caseload grew from 155,000 to more than 233,000 consumers, an average annual growth rate of about 4 percent. For the period 1999–00 through 2005–06, RC caseload grew at an average annual rate of about 5 percent. For the period 2005–06 through 2009–10, however, caseload has grown at a slower average annual rate of 3 percent. A comparison of 2008–09 to 2009–10 shows caseload growth of less than 1 percent, which represents the slowest year–to–year growth in the past 20 years.
Costs and Utilization. Several key factors appear to be contributing to ongoing growth in medical costs. Improved medical care and new drugs and technology have increased costs in some areas. For example, expensive new drug treatments that were unavailable a decade ago, and which are now covered by Medi–Cal, have driven up costs in the program. Overall medical inflation has outpaced general inflation over the past decade. Utilization of services is another cost driver in major health programs. To the extent that program beneficiaries utilize more units of the services provided to them, state costs generally go up.
California’s major social services programs provide a variety of benefits to its citizens. These include income maintenance for the aged, blind, or disabled; cash assistance and welfare–to–work services for low–income families with children; protection of children from abuse and neglect; and home–care workers who assist the disabled in remaining in their own homes.
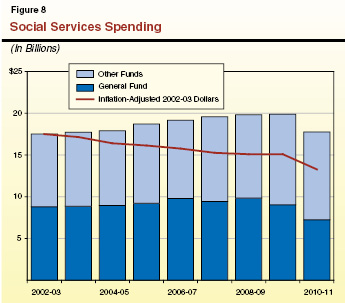
In contrast to overall health spending trends shown in Figure 3, spending on social services programs has remained within a relatively narrow band for the past eight years. Figure 8 shows that General Fund spending on social services programs increased from $8.8 billion in 2002–03 to a peak of $9.8 billion by 2006–07. Total spending from all fund sources increased from $17.5 billion to almost $20 billion in 2009–10. Figure 8 also shows that inflation–adjusted spending has steadily decreased—from $17.5 billion in 2002–03 to $15 billion in 2009–10.
Departments Providing Social Services. As noted earlier, most program funding is contained within DSS. However, a total of five departments and two commissions provide social services within California. The DSS accounts for 96 percent of General Fund spending and 88 percent of total spending on the state’s social services programs. Only four departments which provide social services currently receive General Fund support. Figure 9 compares proposed General Fund spending for each department in 2010–11, to the revised spending level for 2009–10.
Figure 9
Social Services Departments Proposed General Fund Expenditures
(Dollars In Millions)
|
|
2008–09
|
2009–10
|
2010–11
|
Change
|
|
Amount
|
Percent
|
|
Department of Social Services
|
$9,412.1
|
$8,651.2
|
$6,874.2
|
–$1,777.0
|
–20.5%
|
|
Department of Child Support Services
|
330.7
|
296.3
|
301.3
|
5.0
|
1.7
|
|
Department of Rehabilitation
|
54.4
|
52.9
|
56.5
|
3.6
|
6.8
|
|
Department of Aging
|
44.2
|
33.0
|
12.3
|
–20.7
|
–62.7
|
|
Totals
|
$9,841.4
|
$9,033.4
|
$7,244.3
|
–$1,789.1
|
–19.8%
|
Major Program Areas. Most of the spending for social services is concentrated in five program areas. These are SSI/SSP, CalWORKs, IHSS, children’s programs, and county administration. Figure 10 shows General Fund expenditures in these programs from 2003–04 through 2010–11. The figure shows the level of local assistance spending provided to individuals and counties and does not include the relatively small costs (about $100 million per year) of state operations for all of these programs. The key features of these programs are described below.
Figure 10
General Funda Spending for Major Social Services Programs
(In Millions)
|
Programb
|
2003–04
|
2004–05
|
2005–06
|
2006–07
|
2007–08
|
2008–09
|
2009–10
|
2010–11
|
|
CalWORKs
|
$2,064
|
$2,054
|
$1,963
|
$2,018
|
$1,482
|
$1,947
|
$2,026
|
$1,996
|
|
SSI/SSP
|
3,124
|
3,411
|
3,427
|
3,554
|
3,623
|
3,597
|
2,940
|
2,629
|
|
IHSS
|
1,091
|
1,198
|
1,355
|
1,474
|
1,687
|
1,588
|
1,394
|
716
|
|
Children’s and Other Programsc
|
1,425
|
1,439
|
1,485
|
1,563
|
1,642
|
1,729
|
1,661
|
1,212
|
|
County Administration and Automation
|
415
|
408
|
404
|
428
|
451
|
502
|
592
|
617
|
|
Totals
|
$8,118
|
$8,510
|
$8,634
|
$9,037
|
$8,885
|
$9,363
|
$8,613
|
$7,170
|
The SSI/SSP provides monthly cash grants for low–income aged, blind, or disabled individuals and couples. The SSI portion of the grant is supported by federal funds and the SSP portion is a state–only supplement to the federal grant. Under current law, a federal cost–of–living adjustment (COLA) is applied to the federal portion of the grant every January. Budget legislation for 2009–10 ended the automatic state COLA which had been applied to the combined state and federal grant each June.
The state contracts with the U.S. Social Security Administration to administer the SSI/SSP benefit payments. Generally, to be eligible for the program, an applicant’s monthly income, with some exceptions for certain sources of income, must be at or below the amount of the SSI/SSP monthly grant ($845 for individuals). Additionally, an individual is usually ineligible for SSI/SSP if he or she has assets in excess of $2,000 ($3,000 for couples), with certain exclusions, such as homes and vehicles. To qualify for SSI/SSP on the basis of age, an individual must be age 65 or older. To be eligible for the grant based on disability, an applicant must demonstrate that he or she is unable to work because of a permanent or long–term mental or physical impairment.
State–Only Program for Legal Immigrants. The state–only funded Cash Assistance Program for Immigrants provides a monthly cash grant to legal immigrants who are aged, blind, or disabled. This program serves those who meet SSI/SSP eligibility requirements, but who are not otherwise eligible to receive SSI/SSP due to their immigration status.
The CalWORKs program was created in 1997 in response to the 1996 federal welfare reform legislation, which created the federal Temporary Assistance for Needy Families (TANF) program. CalWORKs provides cash grants and welfare–to–work services to families whose income is inadequate to meet their basic needs.
To be financially eligible for CalWORKs, a family’s income must be below a specified income level (for example, $1,170 per month for a family of three) and meet specified asset limits. Grants vary by family size and where they reside. Currently, the maximum monthly grant for a family of three is $694 in higher–cost counties. Once on aid, a family may remain eligible for aid despite having additional earnings because of program rules establishing an “earned income disregard,” which does not count certain earned income when determining the family’s grant. In addition, CalWORKs families receive a monthly Food Stamp allotment as described more fully below. Generally, able–bodied adults are limited to five years of cash aid, while children are not subject to such time limits.
Work Requirements. Federal law generally requires that states ensure that at least 50 percent of their cases with adults be working either 20 or 30 hours per week, depending on the age of the youngest child. (Federal law provides states with credits that reduce this obligation if they reduce their welfare caseloads.) Failure to meet the net federal work participation rate may result in substantial federal financial penalties for the state.
Able–bodied adults, who are required to participate, receive child care and other services to help them work, obtain training, or find work. Able–bodied adults are generally limited to five years of cash assistance. As discussed earlier, if an adult reaches the five–year limit, the family’s grant is reduced by the amount attributable to the adult and the children continue to receive aid in a program known informally as the safety net. Children with ineligible parents (such as undocumented persons) receive a “child–only” grant throughout their time on aid.
The IHSS program provides in–home care for persons who cannot safely remain in their own homes without such assistance. In order to qualify for IHSS, a recipient must be aged, blind, or disabled and in most cases have income at or below the level necessary to qualify for SSI/SSP.
After receiving the IHSS application, a county social worker visits the home of the recipient and uses a uniform assessment tool to determine the number of hours for each type of IHSS service that a recipient qualifies for in order to remain safely in his/her own home. Assistance is provided with such tasks as cleaning, meal preparation, bathing, grooming, and helping with medications and prosthetic devices. The IHSS recipients are sent a notice informing them of the number of authorized hours for each task. Typically, social workers conduct reassessments annually to determine whether the services needed by the recipient have changed.
Once the recipient is authorized IHSS service hours, he or she must find an IHSS provider to perform those services. In the IHSS program, the recipient is considered to be the employer, who has the responsibility to hire, train, supervise, and fire their provider. Nevertheless, representatives of IHSS providers are authorized under state law to participate in collective bargaining with the county for uniform salary and benefit levels in their jurisdictions. Budget legislation in 2009–10 reduced the amount of wages for which the state would share in costs from $12.10 per hour to $10.10 per hour. However, a current federal court case requires the state to continue to participate in wages up to $12.10 per hour. Any wage or benefit costs above $12.10 per hour are paid for by counties and the federal government.
The DSS oversees several children’s programs that comprise the state’s child welfare system. The purpose of California’s child welfare system is to prevent, identify, and, when necessary, respond to allegations of child abuse and neglect. Families in the child welfare system receive services so that (1) children can remain safely in their homes and/or (2) children who are temporarily removed from their homes can reunify with their families. For cases in which children are unable to reunify with their families, efforts are made to find them a permanent home through adoption or guardianship. Below, we describe in more detail the major children’s programs.
Child Welfare System. Following a report of child abuse or neglect, county Child Welfare Services (CWS) social workers are obligated under state law and regulations to take various steps to resolve the situation. Social workers investigate such allegations and provide services to children who have been identified as victims, or potential victims, of abuse or neglect. Services may also be provided by counties to the families of the children to address such concerns.
When an investigation indicates further actions are warranted, CWS social workers may temporarily or permanently remove children from their homes for health and safety reasons and place them in Foster Care. Children are typically placed in Foster Care by the action of a juvenile court, which provides ongoing supervision of what are known as dependency cases. A Foster Care placement can be with either an individual family or a group home setting. Family and group providers receive monthly grant payments for the 24–hour care and supervision of the child.
Children in Foster Care may eventually be reunified with their parents or placed in adoption or guardianship when family reunification is not possible. In most cases, adoptive parents and guardians are eligible for monthly grants paid through either the Adoption Assistance Program (AAP) or the Kinship Guardianship Assistance Payment (Kin–GAP) program. When a child is reunified with his or her family, or permanently placed with an adoptive family or guardian, the court generally dismisses the dependency case and CWS services end.
Although the state has oversight responsibility for social services, most of the programs are administered and delivered to clients at the county level. County administrative costs for CalWORKs, CWS, and IHSS are budgeted within those programs. However, funding for the administration of Food Stamps and Foster Care and most all county automation costs are budgeted in a separate line item called administration and automation.
In California, both parents have a legal duty to provide financial support for their children. The goal of the Department of Child Support Services (DCSS) is to collect support payments from a non–custodial parent on behalf of the custodial parent and the child.
Once a custodial parent applies for assistance in collecting child support, local child support agencies work to (1) locate absent parents; (2) establish the paternity of a child; (3) obtain, enforce, and modify child support payment orders; and (4) collect and distribute child support payments. Using a statutory guideline, which reflects both parents’ income and time with their children, local courts determine the amount of the child support order. Orders may be enforced in various ways including the withholding of wages and unemployment benefits, interception of tax return refunds, and the placement of liens on real property.
When a family receiving child support is also receiving public assistance, DCSS distributes the first $50 per month collected from the non–custodial parent to the custodial parent and child. Any additional amount is deposited in the state General Fund to partially offset the state’s costs for providing public assistance. Generally, if the family is not receiving public assistance, the money collected by DCSS goes to the custodial parent.
The federal Food Stamp program provides monthly benefits to low–income households and individuals to assist them with food purchases. Generally, to qualify for the Food Stamp program, a household’s gross income must be below 130 percent of the FPL ($1,526 per month for a family of three), and the household must meet other financial eligibility criteria, including an asset limit of $2,000 (with exclusions for homes and vehicles).
Participants in the Food Stamp program receive monthly benefits on electronic benefit transfer cards, similar to debit cards, which can be used at participating stores. The maximum food stamp allotment depends on household size. For example, the maximum monthly allotment is $526 for a household of three.
The cost of the federal food benefits is borne entirely by the federal government. Associated administrative costs are shared between the federal government (50 percent), the state (35 percent), and the counties (15 percent). We note that a recently enacted federal law, the Food, Conservation, and Energy Act of 2008 (Public Law 110–246), renames the Food Stamp program the Supplemental Nutrition Assistance Program.
State–Only Food Stamp Program for Noncitizens. The California Food Assistance Program provides state–funded monthly benefits to legal noncitizen adults between 18 and 65 years of age who have resided in the United States for less than five years.
There is significant variation in the General Fund spending growth rates for the major social services program. To get a better sense of the underlying spending trends in these programs, we adjusted the General Fund spending upward to account for the savings from increased ARRA funding. Figure 11 shows the average annual growth rate in adjusted General Fund spending for the major social services programs over the past ten years. The figure also divides the decade in half showing how growth rates generally slowed in the second half of the last decade. To provide a basis for comparison, Figure 11 also shows the growth trends in population and inflation.
Figure 11
Major Social Services Programs
Average Annual General Fund Spending Growth Rate
(Adjusted for ARRA Offsets)
|
|
1999–00 to
2004–05
|
2004–05 to
2009–10
|
1999–00 to
2009–10
|
|
CalWORKs
|
0.6%
|
3.3%
|
2.0%
|
|
SSI/SSP
|
6.4
|
–2.9
|
1.6
|
|
IHSS
|
15.0
|
7.9
|
11.4
|
|
Children’s and Other Programsa
|
3.9
|
7.7
|
5.8
|
|
Administration and Automation
|
1.9
|
2.9
|
2.4
|
|
Totals
|
5.0%
|
1.9%
|
3.4%
|
|
State and Local Deflator
|
3.7%
|
4.2%
|
3.9%
|
|
California Population
|
1.6
|
1.1
|
1.3
|
|
Totals
|
5.3%
|
5.3%
|
5.2%
|
Key findings concerning adjusted General Fund spending growth since 1999–00 include:
- General Fund spending on social services grew at an average of 5 percent in the first half of the decade and slowed to just under 2 percent in the second half.
- During the early part of the decade spending growth was similar to the growth in California’s population and inflation. In the latter part of the decade spending growth was substantially less than growth in population and inflation.
- The IHSS is the fastest growing social services program. The SSI/SSP is the slowest growing social services program.
- Besides IHSS, programs for children were the only programs which grew faster than inflation and population.
The primary cost drivers in social services programs are caseload growth, grant levels, and service provider rates.
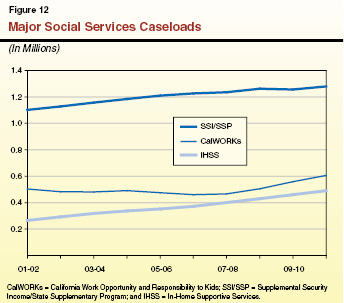
Caseload. Figure 12 shows caseload trends for the three largest social services programs. As the figure shows, the IHSS caseload has been growing rapidly throughout the decade, which explains a significant amount of the cost growth in this program. The CalWORKs caseload was relatively flat in the early part of the decade but has grown substantially during the recent recession. CalWORKs is a “countercyclical” program providing income maintenance when families are unable to support themselves, as in periods of recession. In contrast, SSI/SSP has been growing slowly throughout the decade. This slow growth rate makes sense because the disabled are the largest component of the SSI/SSP caseload and disability is not generally correlated with trends in the economy. Within children’s programs, the AAP caseload (not shown in the figure) grew very rapidly during this period, which explains some of the spending growth.
Grant Levels. In recent budgets the Legislature has reduced costs in CalWORKs and SSI/SSP by reducing grants. These grant reductions in part explain the relatively low spending growth rates for these programs in recent years. In the earlier part of the decade, the Legislature provided some COLAs to grant payments. For CalWORKs, the last COLA was provided in December 2004. The SSI/SSP grants have not had a COLA since April 2005. After many years with no COLA, the Legislature increased most Foster Care grants by 5 percent in 2007–08.
Discretionary Increases and Decreases in CWS. Over the years, the Legislature has provided discretionary augmentations to the CWS budget in an effort to provide workload relief for social workers and to improve outcomes and service delivery. Major CWS augmentations include about $35 million General Fund in 2000–01 for workload relief and about $74 million General Fund in 2005–06 for outcome improvements. We note that in subsequent years, there have been reductions to CWS because of budget constraints, most notably the Governor’s veto of $80 million General Fund from the program for 2009–10.
Cost of Service. With respect to service costs, the Legislature has taken recent action to reduce expenditures. In CalWORKs, the Legislature reduced funding for child care and welfare–to–work services by $375 million in 2009–10 and 2010–11. As noted above, the Legislature also reduced state participation in IHSS provider wages, although the federal courts have blocked implementation of this reduction. We note that other factors are driving up the cost of social services. The IHSS costs have been rising for the past decade in part because the Legislature increased state participation in provider wages and counties negotiated wage increases through collective bargaining. These increases in the costs of IHSS would have been even greater in the latter half of the decade had the state not obtained a federal waiver which increased federal funding with corresponding decreases in state General Fund costs.
Below, we describe the major sources of funding for H&SS programs. Generally, we describe funding streams that provide $50 million or more annually in support of these programs.
General Fund. The General Fund is the main state fund for financing state government programs. Revenues are deposited into the General Fund unless they are specifically designated to be deposited into another fund. The primary sources of revenue for the General Fund are the personal income tax, sales tax, and bank and corporation taxes.
Federal Funds. Federal funds are those received directly from an agency of the federal government. The use of federal funding streams is generally restricted to certain uses that the federal government has deemed a policy priority. In order to receive federal funds, the state may have to meet federal matching requirements, maintenance of effort (MOE) requirements, or other conditions. There are many different federal funding streams. Some of these streams have existed for many years and represent relatively stable ongoing authorizations from Congress. On the other hand, ARRA created two new major funding enhancements for H&SS which will expire in the near future. (We discuss these further below.)
Special Funds. Special funds are state funding sources which must be devoted to some special use defined in state statute. Among other purposes, they are used to account for revenues from taxes, licenses, and fees, the use of which is restricted by law for particular functions or activities of government. Some special funds are not subject to appropriation through the annual budget process. For example, special funds are used to fund so–called state–county realignment programs. Counties receive dedicated tax revenues from the sales tax and vehicle license fee to help pay for the mental health, social services, and health services they provide. Generally, the 1991 realignment legislation governs county state/county funding responsibilities for H&SS programs, as discussed in the nearby box.
|
In 1991, the state enacted a major change in the state and local government relationship, known as realignment. In the areas of health and social services, realignment transferred programs from the state to county control, altered program cost–sharing ratios, and provided counties with dedicated tax revenues from the sales tax and vehicle license fee to pay for these changes. Each county created three program accounts, one each for mental health, social services, and health. Through a complicated series of accounts and subaccounts at the state level, counties receive revenues into their three accounts for spending on programs in their respective policy areas.
Components of Realignment
|
Transferred Programs—State to County
|
|
|
Mental Health
|
- Community–based mental health programs
- State hospital services for county patients
- Institutions for Mental Diseases
|
|
Public Health
|
- AB 8 County Health Services
- Local Health
Services
|
|
Indigent Health
|
- Medically Indigent Services Program
- County Medical Services Program
|
|
|
|
Local Block Grants
|
- County Revenue Stabilization Program
- County Justice Subvention Program
|
|
County Cost–Sharing
Ratio Changes
|
State/County Shares
of Nonfederal Program Costs (%)
|
|
|
Prior Law
|
Realignment
|
|
Health
|
|
|
- California Children’s Services
|
75/25
|
50/50
|
|
Social Services
|
|
|
- AFDC—Foster Care (AFDC–FC)
|
95/5
|
40/60
|
|
|
76/24
|
70/30
|
- In–Home Supportive Services
|
97/3
|
65/35
|
- County Services Block Grant
|
84/16
|
70/30
|
- Adoption Assistance Program
|
100/0
|
75/25
|
- Greater Avenues for Independence program
|
100/0
|
70/30
|
- AFDC—Family Group and Unemployed Parent (AFDC–FG&U)
|
89/11
|
95/5
|
- County Administration (AFDC–FC, AFDC–FG&U, Food Stamps)
|
50/50
|
70/30
|
|
Reimbursements. A reimbursement is an amount received by an agency or department as payment for the cost of services it provided (for example, reimbursement of one state department by another for administrative work it performed on its behalf). State agencies also receive reimbursements for expenditures made on behalf of another agency or department (for example, the purchase of equipment for another department). Sometimes, counties are reimbursed by the state, but the converse also occurs.
County Funds. Counties participate with a share of cost in certain H&SS programs. Generally, the most significant county cost shares are in Foster Care, IHSS, and California Children’s Services. The 1991 realignment legislation established most of the current state–county sharing ratios, and the realignment funds described above provide a majority of the county funding to pay for the county share of cost. However, in some programs, especially CWS, counties put in their own resources beyond these required amounts.
In order to fully understand how the state’s H&SS programs are budgeted, it is important to acknowledge the role of the major federal funding streams—those that provide $50 million or more for these programs mostly on an ongoing basis. Some of the federal funding streams fund multiple state programs. Some federal funding streams may only be used for certain purposes and therefore are specific to only one department or program. For example, federal funds for the Substance Abuse Prevention and Treatment (SAPT) Block Grant are administered solely by the Department of Alcohol and Drug Programs. The major federal funding streams for H&SS are:
Title XIX. In 1965 Title XIX of the Social Security Act established Medicaid as a voluntary state health care program. As a joint federal–state program, federal funds are available to the state for both the provision of health care services and certain administrative functions. The amount of federal participation a state receives is referred to as the Federal Medical Assistance Percentage (FMAP) and is determined by a formula. No state receives less than a 50 percent FMAP. (California is at this dollar–for–dollar federal match for most Medi–Cal costs.) However, the state receives an enhanced FMAP for some medical services and administrative functions. Furthermore, the federal government has sometimes temporarily enhanced the FMAPs provided to the states in order to provide fiscal relief, and is currently doing so.
TANF Block Grant Funds. The 1996 federal welfare reform legislation consolidated most federal funding for income maintenance and welfare–to–work services into the TANF block grant. California’s annual block grant was established at $3.7 billion and has never been adjusted. To receive these funds, California must meet an MOE requirement of about $2.9 billion. Unspent TANF block grant funds may be carried over indefinitely from one fiscal year to the next. Thus, states can “bank” their TANF funds without any fear of losing the funds. The TANF funds may be used for any activity which is reasonably calculated to meet a purpose of the federal TANF program. The four stated purposes of TANF are:
- Assisting needy families so that children can be cared for in their own homes.
- Reducing the dependency of needy parents by promoting job preparation, work, and marriage.
- Preventing out–of–wedlock pregnancies.
- Encouraging the formation and maintenance of two–parent families.
States may also (1) transfer some of their TANF funds into the Title XX Social Services Block Grant (described below) or the Child Care Development Fund and (2) use the TANF funds for any purpose allowed under its predecessor programs. Although TANF is the primary federal source of funding for the CalWORKs program, the broad purposes of TANF and flexible transfer provisions allow states to use TANF funds for many different programs.
Title IV–E Funds. Title IV–E of the Social Security Act provides federal matching funds for eligible children in CWS, Foster Care, and AAP. (Recent federal legislation also provides an option for states to draw down Title IV–E funding for relative guardianship grants.) Title IV–E currently funds (1) maintenance payments to foster homes or agencies, covering the costs of shelter, food, and clothing for foster children; (2) administrative costs, including child welfare case management; and (3) grants to adoptive parents of special needs foster children. The state is estimated to receive about $1.4 billion in Title IV–E funds in 2009–10. Typically, about 70 percent of children in the child welfare system are eligible for Title IV–E funding.
WIC Special Supplemental Nutrition Program. The WIC program is entirely federally funded through a grant of approximately $1.1 billion. The program provides food, nutrition education, and referrals to H&SS programs for pregnant women, new mothers, and young children. There are no state funds used to support the WIC program.
Children’s Health Insurance Program. Title XXI of the Social Security Act, also known as CHIP, gives grants to states to provide health insurance coverage to uninsured children. These funds are used to support HFP—the state receives a roughly two–to–one federal to state funds match. In 2009–10 the state will receive about $732 million in federal support for HFP.
Title IV–D Funds. Under Title IV–D of the Social Security Act, the federal government pays for 66 percent of the cost of child support enforcement. For 2009–10, Title IV–D provides approximately $600 million in federal funds to DCSS.
Energy Assistance. The Department of Community Services and Development receives multiple federal funding streams which assist low–income Californians with energy bills and weatherization. Total funding is estimated to be about $320 million in 2009–10, including certain one–time funds.
SAPT Block Grant. The SAPT block grant is a federal formula grant awarded to a single state agency in each state based on a formula. In 2009–10 the state will receive about $260 million in SAPT block grant funds. To receive these funds, the state must submit an annual application and report that demonstrates compliance with SAPT block grant requirements and maintenance of state expenditures at a specified level.
Title XX Social Services Block Grant. Subject to appropriation by Congress, California receives about $200 million each year in Title XX block grant funds. Title XX funds can be used for five specified federal purposes including: promoting economic self–sufficiency, preventing or remedying abuse and neglect, and helping individuals avoid institutional care. Currently, California uses Title XX funds for DDS programs, Foster Care, CWS, deaf access, and child care.
Older American Act Funds. Including certain one–time increases, the Department of Aging received about $163 million in Older American Act funding in 2009–10. These funds are used for such purposes as nutrition assistance, supportive services, and senior employment programs.
Ryan White Comprehensive AIDS Resources Emergency (CARE) Act. The state receives approximately $130 million per year through the federal Ryan White CARE Act, a federal funding stream that supports medical care and support services for individuals living with human immunodeficiency virus (HIV) and acquired immunodeficiency syndrome (AIDS). The state is required to maintain its expenditures for these purposes each year at or above prior–year levels in order to receive the grant.
Smaller Federal Funding Streams. The state receives many smaller federal grants that the state must use for specified purposes. For example, the state receives approximately $50 million through Title V of the Social Security Act for maternal, child, and adolescent health programs. The federal government also provides the state between $50 million and $100 million annually for each of the following activities:
- Certification that health facilities meet minimum standards for Medicare and Medi–Cal.
- Public health emergency preparedness.
- Improvements to drinking water infrastructure to improve water quality through the Drinking Water State Revolving Fund.
- Early intervention for children with developmental disabilities through Individuals With Disabilities Educations Act funds.
- Community mental health and substance abuse services through the Substance Abuse and Mental Health Services Administration block grant.
Some of these funding streams have associated state matching or MOE requirements. The H&SS departments also receive a variety of federal grants under $50 million for specific activities; these grants are too numerous to list here.
The ARRA provided states with about $330 billion in additional funding. Although California received many different types of ARRA funds, the two most significant funding modifications for H&SS programs are enhanced FMAP funding and the TANF Emergency Contingency Fund (ECF).
Enhanced FMAP. The ARRA temporarily increases the FMAP for all states through December 2010 subject to certain requirements and restrictions. Under the enhanced FMAP, instead of sharing most Medi–Cal costs 50–50, the state–federal split is 38–62. (There were actually two components to this increase: a base increase of 6.2 percent applicable to all states and potential further increases depending on certain state specific characteristics, such as high levels of unemployment.) In order to receive the enhanced FMAP a state must maintain eligibility levels and procedures that were in place as of July 1, 2008 and meet certain requirements that ensure that medical providers are paid promptly for their services. We note that Foster Care and AAP also received the base increase in the enhanced FMAP to 56.2 percent in California.
TANF ECF. The TANF ECF provides additional funding for the state’s CalWORKs program. Specifically, the ECF provides 80 percent federal participation in grant, subsidized employment, and certain other one–time costs which exceed the state’s base cost in 2007. Under current law this funding stream expires on September 30, 2010. For 2009–10, the budget reflects about $550 million in TANF ECF.
ARRA Extension in the President’s Budget. The President’s budget proposes to extend enhanced FMAP by six months to the end of June 2011. It also proposes to extend TANF ECF for one year through the end of September 2011.
As described in the previous section, the federal government has created over 17 different funding streams to support H&SS programs. For 2009–10, the budget includes $34.5 billion in federal funds for H&SS programs. Acceptance of these funds means that California must comply with federal program requirements. In addition to the federal statutory and regulatory requirements, recent federal court action has placed further restrictions on state program design and service levels. Our companion report entitled
The 2010–11 Budget: Health & Social Services—A Restricted Environment further discusses these issues.